- The Canadian economy is rebounding
- Q1 GDP was much stronger under the hood…
- ...as Final Domestic Demand grew by the fastest in two years…
- ...which is sure to attract the BoC’s attention...
- ...especially because consumer spending is on fire and needs no rate cuts…
- …while inventories dragged on GDP which does not merit policy easing
- Full-year 2023 revisions left the level of GDP unchanged at year-end
- March GDP was weighed down by temporary retooling
- April GDP growth was solid, Q2 is tracking sustained momentum
- Why the shrill cries about per capita GDP border upon being outrageous
- USDCAD shook off GDP because US core PCE was soft
- Canadian GDP Q1, q/q % SAAR:
- Actual: 1.7
- Scotia: 2.2
- Consensus: 2.2
- Prior: 0.1 (revised from 1.0%)
- Canadian GDP March, m/m % SA:
- Actual: 0.0
- Scotia: -0.1
- Consensus: 0.0
- Prior: 0.2
- April GDP guidance, m/m %: +0.3
Markets didn’t spend any time looking beneath the GDP headlines while piling into the Canadian front-end and driving yields lower. They should have. I view the numbers as very constructive for several reasons not least of which that growth in consumer spending is at its strongest in years and needs no help from rate cuts.
Before turning to details, the immediate market reaction was that Canadian two-year bonds rallied by about 9bps post data. The Canadian dollar was little changed to the USD because of soft US core PCE that was up by just 0.2% m/m SA and that took some wind out of the USD. Pricing for next Wednesday’s BoC decision moved up to 19bps of a cut with July’s pricing increasing a couple of basis points to about 30bps, signalling that markets are not yet convinced that back-to-back moves could be delivered.
What Markets Didn’t Like
Markets saw 1.7% q/q SAAR GDP growth in Q1 that was a half point softer than consensus and 1.1 ppts weaker than the BoC’s April MPR projection plus a downward revision to 0.1% from 1% q/q SAAR growth in Q4 and looked no further than to drive yields lower on the narrative the BoC would obviously cut on the back of these numbers. Toss in the flat March reading for extra good measure. Sounds pretty compelling as justification to drive rates lower, right?
Now for why I think that was the wrong interpretation.
The Economy is Rebounding
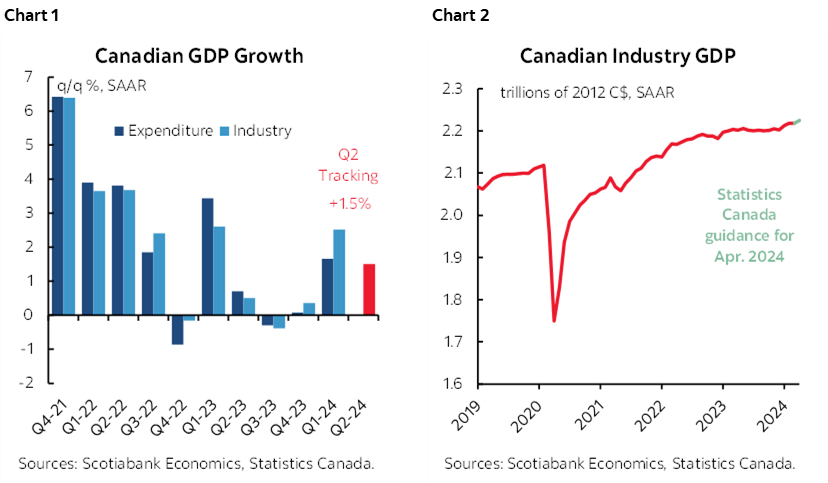
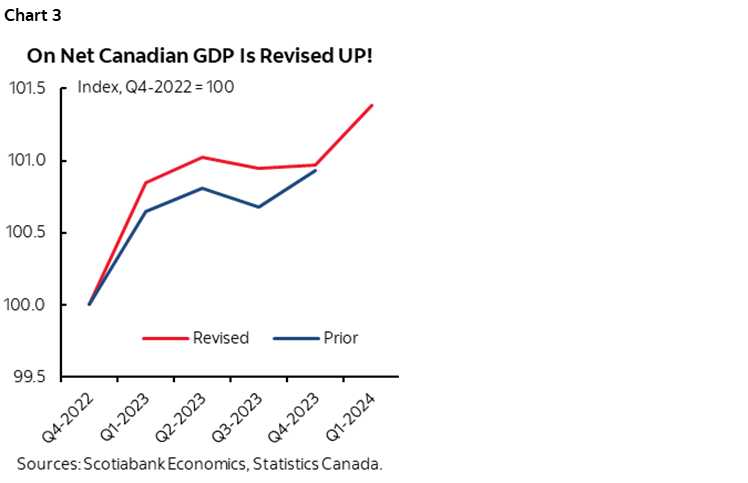
This isn’t the strongest point to follow, but a first quick point is to recall that the BoC was saying at the start of the year that 2024H1 would be basically ugly and peak pain. Before turning to the even better details below, charts 1 and 2 show that the economy is hardly ripping, but it’s posting the strongest sustained growth in a year. Q1 GDP was up by 1.7% q/q SAAR which isn’t that ugly. Q2 tracking based on the monthly GDP figures has 1.5% q/q SAAR growth baked in so far based only on the Q1 average and April GDP with May and June still ahead.
The Complete Set of Revisions Left the Level of GDP Unchanged
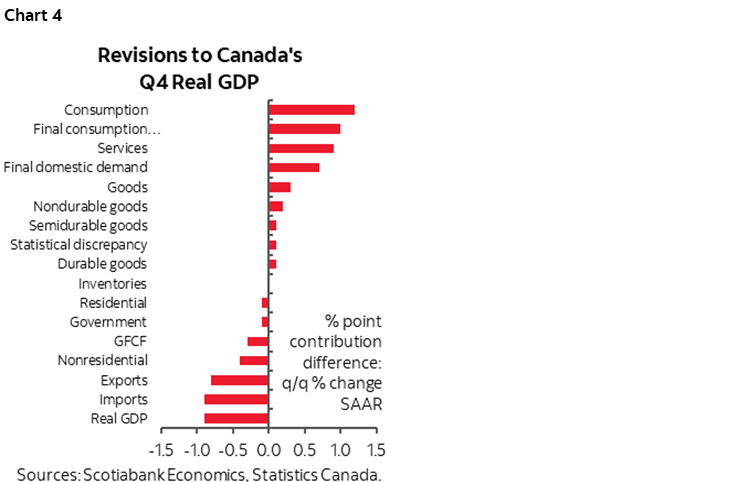
Let’s deal with revisions first. They were not just done to Q4. There were positive revisions to every other prior quarter in 2023 and they leave us on net with an unchanged level of GDP into year-end compared to what we understood going in. That represents no new information in terms of how it translates into output gaps as input into how the BoC judges slack.
2023Q1 growth was revised up 0.8 ppts to 3.4% q/q SAAR growth now. 2023Q2 was revised up by 0.1 ppts and 2023Q3 was revised up by 0.2 ppts.
Chart 3 shows the net effect on the level of GDP throughout these revisions. The level after revisions was tracking higher until 2023Q3 but then turned to no net change by Q4. If you only looked at the Q4 GDP revision then you totally missed this point.
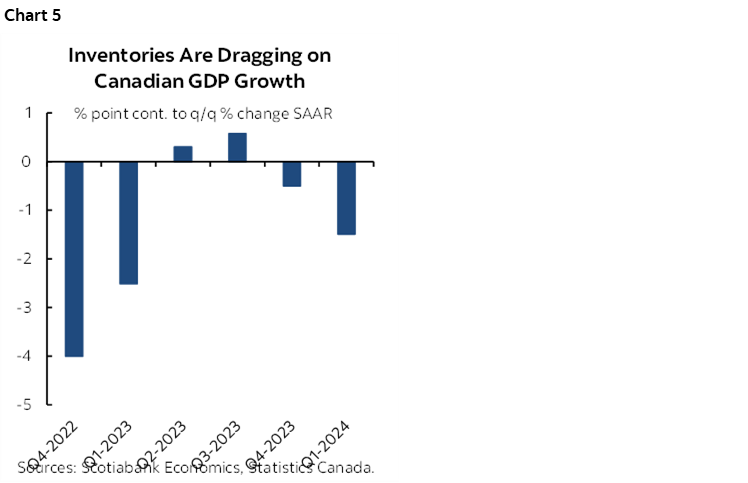
What drove the Q4 downward revision? Chart 4 summarizes the effects in terms of the difference between contributions to growth by component after revisions minus before revisions. The main downsides were exports (-0.8 ppts less of a contribution to Q4 GDP growth compared to previously), and gross fixed capital formation (-0.4 ppts compared to previously) and that was through residential investment.
But offsetting that was an upward revision to Q4 consumption that is now adding an extra 1.1 ppts, going from little contribution of 0.2 ppts to 1.2 ppts now.
Q1 GDP Was Much Better Under the Hood
Next let’s deal with what drove the softness in Q1 GDP. Inventories, inventories, inventories. Q1 saw inventories shave 1.5 ppts off of GDP growth which returns us to something similar to what was happening toward the end of 2022 and early 2023 (chart 5).
The inventory shedding confirms part of my thesis that core inflation may have been soft at the start of the year because businesses got stuck with inventory overhangs and discounted like crazy. That's likely temp imo
What happened to the rest of the picture?
Final Domestic Demand Grew the Most in Two Years!
Key is that Final Domestic Demand was up by 2.9% q/q SAAR in Q1. This is a cleaner, more distortion-free assessment of the underlying momentum in the domestic economy that removes inventory and net trade effects on growth and boils things down to what more directly applies to the BoC’s ability to steer the economy.
That was the strongest growth in final domestic demand that Canada has seen since 2022Q1 (chart 6). Two years folks.
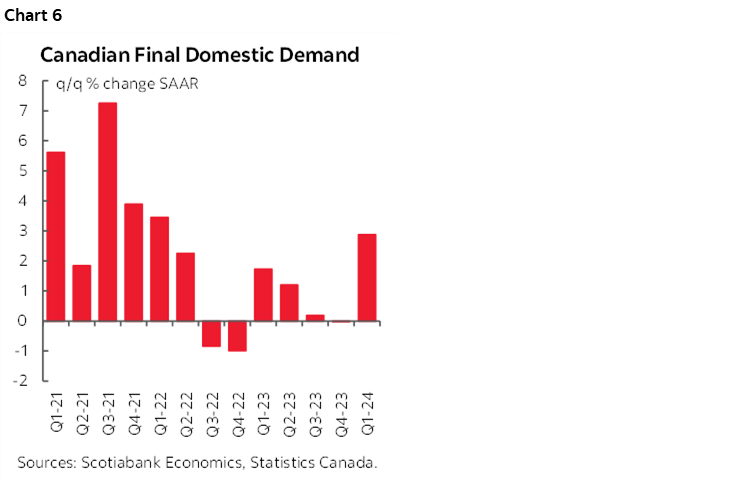
When FDD performs like it just did, the BoC usually statement-codifies it as an offset to the mild Q1 GDP headline.
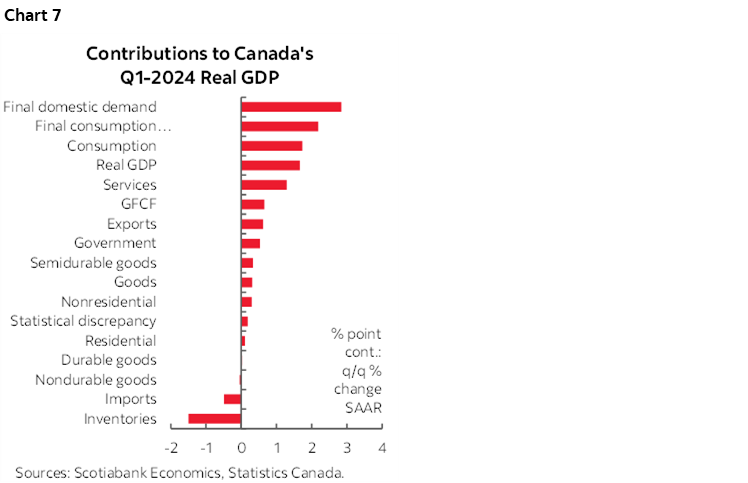
Chart 7 shows a full breakdown of the weighted contributions to Q1 GDP growth by sector. Inventories were the sole major drag. Higher imports dragged on GDP growth because in GDP accounting they get treated as a leakage effect out of the economy. Consumption added a strong weighted 1.6 percentage points to Q1 GDP growth.
Consumer Spending is Ripping and Needs No Help!
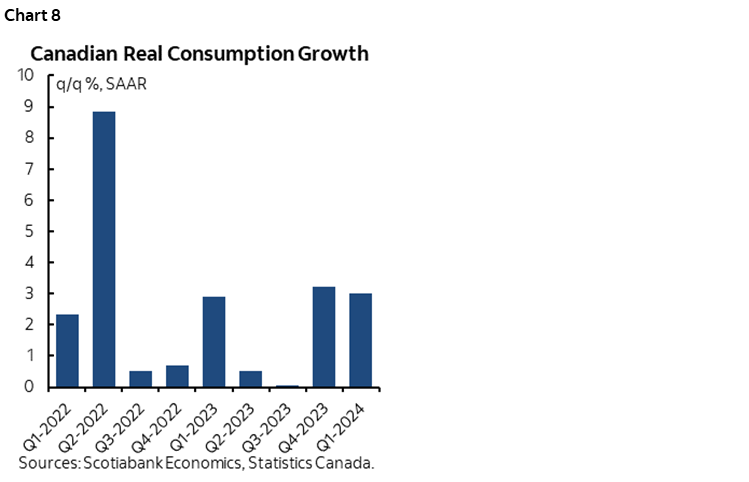
Pause for a minute here in order to appreciate this latter point’s significance. In unweighted terms, inflation-adjusted consumer spending was up by 3% q/q SAAR in Q1. 3%!! That followed a 3.2% q/q SAAR rise in consumer spending in Q4. 3.2%!! Chart 8 shows that Canada is posting the strongest back-to-back quarters for growth in consumer spending since the first half of 2022.
Markets want to give rate cuts to interest-sensitive consumer spending that is performing that strongly? Well then the front-end is suffering from early onset madness imo. You’re gonna reignite it all over again and send us back in time.
March GDP Was Distorted by Retooling
Drivers of March GDP are shown in chart 9. March GDP would have posted mild growth if not for auto sector retooling. The effects on the manufacturing and wholesale sectors knocked around 0.1% m/m off of GDP growth in weighted terms. Statcan had this to say:
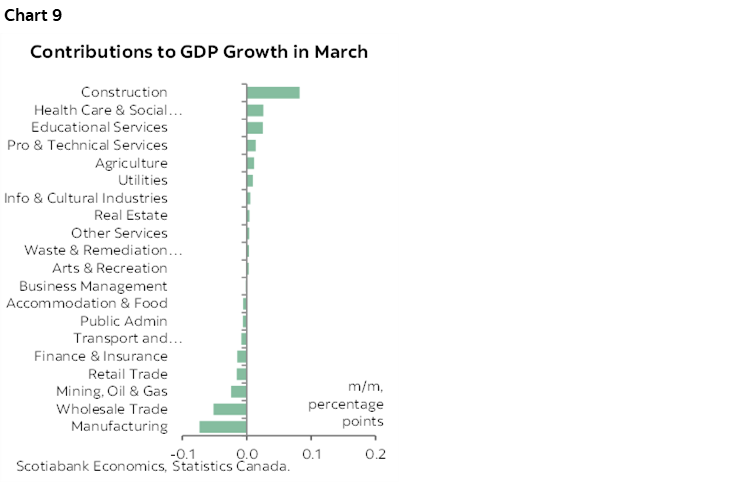
“The transportation equipment manufacturing subsector (-2.4%) was the largest detractor to growth in March, posting its third decline in four months, as ongoing retooling activities at multiple automotive assembly plants in Ontario contributed to lower activity in the subsector. The motor vehicle manufacturing industry group was down 8.2%, while the motor vehicle parts manufacturing industry group decreased 3.0%.”
And:
“Motor vehicle and motor vehicle parts and accessories wholesaling contracted 5.3% in March and contributed the most to the overall decline in the sector. The retooling work at several automotive assembly plants in Ontario contributed to lower wholesaling activity in the motor vehicle industry group.”
April Rebounded
Statcan’s preliminary guidance for April GDP was up by 0.3% m/m. That’s within spitting distance of what I had indicated my simple OLS regression was spitting out at 0.4% based upon the few readings we had to go by.
Statcan does not provide details for this preliminary flash reading, but offered light verbal guidance that it was driven by gains in manufacturing, mining, quarrying and oil and gas extraction, and wholesale trade offset in part by utilities. Depending upon how big the utilities drag was in April, I would control for it as a possible weather effect such that underlying growth might have been slightly firmer than 0.3%.
Be Wary Toward The Shrill Sounding Per Capita Cries
Now the usual folks will lament that per capita GDP growth is even weaker and that this says things are just terrible out there. They’ll say that the economy is actually contracting in per capita terms as a sign of total failure of the immigration experiment.
I have never bought this argument and always given two reasons for not doing so:
- Much of the population surge has been in the temps, or nonpermanent residents category. They shouldn't be expected to immediately contribute to GDP in proportionate terms to others in the first place, so don't include all of them in per cap numbers. Temps are made up of asylum seekers from Ukraine and Syria, plus temporary foreign workers who send their pay cheques home and take the rest back with them after only spending on the means of subsistence while here, and international students that contribute relatively little to the economy. Students, many of us will recall, contribute to the economy through summer or part-time jobs, tuition, books, room, kraft dinner and beer and not necessarily in that order! Why include all of these folks in proportionate one-for-one fashion when they've been a huge part of the population surge?? Now, if they stay, and get jobs, and buy homes, then we'll see. If they go, they’ll take population growth back down with them.
- Secondly, a population shock has multi-stage effects. It's too soon to expect full integration without dragging on real per capita GDP. It takes time to integrate new arrivals, to get a first job, to trade up jobs, to buy a home, to buy stuff to go into a home, to maybe start a business. The suddenness of this population shock makes it too soon to evaluate this multi-year effect. It’s a multi-stage experiment and expecting immediate dividends is being rather flattering to the historical experience when it comes to Canada’s ability to integrate new arrivals. Canada is a tough nut to crack for new arrivals for a whole host of reasons.
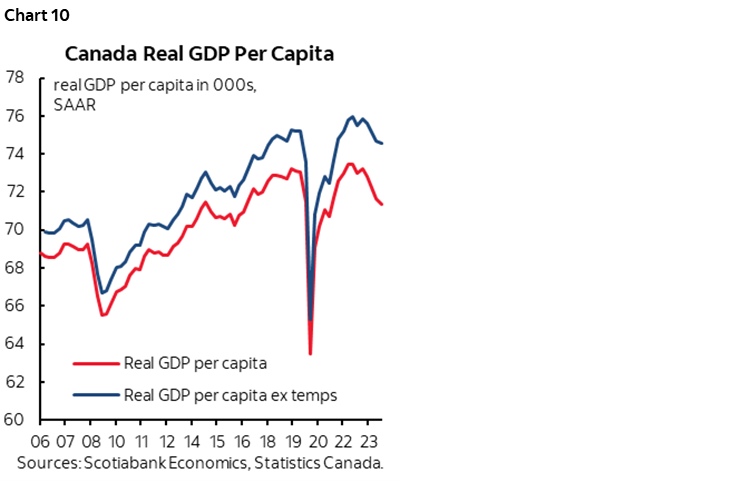
Chart 10 shows what kind of a difference including or excluding temps would make to the per capita GDP numbers. It’s still not great, but it’s much less damning than the per capinistas portray. Further, while there are longstanding productivity problems behind this trend, some of the weakness in GDP over 2023 was due to effects from wildfires, massive strike activity since folks on picket lines are producing goods and services, and sector-specific distortions like retooling and maintenance in autos and petrochemicals for instance. Don’t blame new arrivals for those things.
Here’s another way of looking at it. Recall all those years in which Alberta's oilsands were a capital sinkhole. There was a lot going in to develop the projects, nothing coming out, and it was a drain on productivity. The immigration-driven population shock could work the exact same way. If Canada unleashes the potential of these arrivals in future, then what will the shops who are lamenting real per capita GDP figures say if/when real GDP per cap starts to rise?!
In all, be careful toward per capita GDP comparisons including versus the US. Some of the divergence is a productivity problem that has been long in the making for many decades, but not all of it. The US is also at the forefront of the technological changes sweeping through the economy. One distortion, however, has been that US fiscal deficits have been much bigger and brought forward more US growth than in Canada and may very well present a bigger risk to future US growth when the bills come due. Trade disputes and the pandemic took an arguably bigger toll on Canada. Further, the US per capita numbers look better because for years they had little to no population growth during the Trump era and even after, and so is the inference being made one that says no population growth is good for the long haul? Pffft.
Bank of Canada Implications
I’ll have a full preview in my Global Week Ahead late today. For now, however, it’s my belief that the BoC will look more constructively on the overall set of numbers we just received than markets did.
DISCLAIMER
This report has been prepared by Scotiabank Economics as a resource for the clients of Scotiabank. Opinions, estimates and projections contained herein are our own as of the date hereof and are subject to change without notice. The information and opinions contained herein have been compiled or arrived at from sources believed reliable but no representation or warranty, express or implied, is made as to their accuracy or completeness. Neither Scotiabank nor any of its officers, directors, partners, employees or affiliates accepts any liability whatsoever for any direct or consequential loss arising from any use of this report or its contents.
These reports are provided to you for informational purposes only. This report is not, and is not constructed as, an offer to sell or solicitation of any offer to buy any financial instrument, nor shall this report be construed as an opinion as to whether you should enter into any swap or trading strategy involving a swap or any other transaction. The information contained in this report is not intended to be, and does not constitute, a recommendation of a swap or trading strategy involving a swap within the meaning of U.S. Commodity Futures Trading Commission Regulation 23.434 and Appendix A thereto. This material is not intended to be individually tailored to your needs or characteristics and should not be viewed as a “call to action” or suggestion that you enter into a swap or trading strategy involving a swap or any other transaction. Scotiabank may engage in transactions in a manner inconsistent with the views discussed this report and may have positions, or be in the process of acquiring or disposing of positions, referred to in this report.
Scotiabank, its affiliates and any of their respective officers, directors and employees may from time to time take positions in currencies, act as managers, co-managers or underwriters of a public offering or act as principals or agents, deal in, own or act as market makers or advisors, brokers or commercial and/or investment bankers in relation to securities or related derivatives. As a result of these actions, Scotiabank may receive remuneration. All Scotiabank products and services are subject to the terms of applicable agreements and local regulations. Officers, directors and employees of Scotiabank and its affiliates may serve as directors of corporations.
Any securities discussed in this report may not be suitable for all investors. Scotiabank recommends that investors independently evaluate any issuer and security discussed in this report, and consult with any advisors they deem necessary prior to making any investment.
This report and all information, opinions and conclusions contained in it are protected by copyright. This information may not be reproduced without the prior express written consent of Scotiabank.
™ Trademark of The Bank of Nova Scotia. Used under license, where applicable.
Scotiabank, together with “Global Banking and Markets”, is a marketing name for the global corporate and investment banking and capital markets businesses of The Bank of Nova Scotia and certain of its affiliates in the countries where they operate, including; Scotiabank Europe plc; Scotiabank (Ireland) Designated Activity Company; Scotiabank Inverlat S.A., Institución de Banca Múltiple, Grupo Financiero Scotiabank Inverlat, Scotia Inverlat Casa de Bolsa, S.A. de C.V., Grupo Financiero Scotiabank Inverlat, Scotia Inverlat Derivados S.A. de C.V. – all members of the Scotiabank group and authorized users of the Scotiabank mark. The Bank of Nova Scotia is incorporated in Canada with limited liability and is authorised and regulated by the Office of the Superintendent of Financial Institutions Canada. The Bank of Nova Scotia is authorized by the UK Prudential Regulation Authority and is subject to regulation by the UK Financial Conduct Authority and limited regulation by the UK Prudential Regulation Authority. Details about the extent of The Bank of Nova Scotia's regulation by the UK Prudential Regulation Authority are available from us on request. Scotiabank Europe plc is authorized by the UK Prudential Regulation Authority and regulated by the UK Financial Conduct Authority and the UK Prudential Regulation Authority.
Scotiabank Inverlat, S.A., Scotia Inverlat Casa de Bolsa, S.A. de C.V, Grupo Financiero Scotiabank Inverlat, and Scotia Inverlat Derivados, S.A. de C.V., are each authorized and regulated by the Mexican financial authorities.
Not all products and services are offered in all jurisdictions. Services described are available in jurisdictions where permitted by law.