- GDP strength means more excess demand than the BoC has judged
- Positive momentum is extending into Q2 after a strong Q1
- Details behind the growth readings are robust...
- ...including evidence that housing is returning to add to Q2 growth
- The BoC needs to hike next week
- GDP, Q1 q/q SAAR % / m/m % March, SA:
- Actual: 3.1 / 0.0
- Scotia: 2.5 / 0.0
- Consensus: 2.5 / -0.1
- Prior: -0.1 / 0.1 (revised from 0.0 / 0.1)
- April GDP ‘flash’: 0.2% m/m
GDP data is the latest in a string of evidence supporting my long held view that the BoC quit its hiking cycle prematurely in January and needs to return with further tightening now. Markets reacted to upside surprises by driving a three-quarters of a cent appreciation in CAD to the USD when combined with strong US JOLTS data and by pushing up the two-year GoC yield by 5bps through higher market probabilities attached to a BoC hike as soon as next week.
The Bank of Canada needs to exhibit a sense of urgency in next Wednesday’s decision by hiking the overnight rate by at least 25bps as per our forecast. They should leave the door open to further increases as the real policy rate is not yet restrictive enough for the idiosyncratic factors that continue to drive Canada’s economy and Canadian inflation. On this list are immigration, the terms of trade, ongoing fiscal expansion, strong corporate balance sheets, still pent-up services demand, an undervalued C$ etc.
GDP growth is outpacing the BoC’s April MPR projections which indicates that the economy is in a deeper state of excess demand than they had judged at the time. For starters, 3.1% q/q growth in Q1 exceeded the BoC’s 2.3% forecast. That’s a strong snapback from the Q4 softness shown in chart 1. Readers may recall that Q4 was temporarily dragged down by inventory shedding in excess of lessened import contributions to growth through lower leakage effects, but also by transitory shocks such as temporary closing of a section of the Keystone pipeline, two train derailments and disruptions to air travel. All of that was shaken off in Q2 as those effects stabilized or reversed just as other drivers kicked in as explained in a moment.

Furthermore, Q2 is tracking around what the BoC anticipated which means that the first half of the year in its totality is surpassing the BoC’s expectations. Q2 growth is tracking at around 1% q/q SAAR using the monthly production-side accounts and this figure relies upon taking the Q1 GDP average, the way Q1 ended in March (0% m/m, matching Scotia, consensus -0.1%), the way Q2 began in April using Statcan’s preliminary guidance (+0.2%) and assuming unchanged readings in May and June solely in order to focus the math upon the effects of what we know so far. The BoC’s 1% Q2 GDP growth forecast used the expenditure-based GDP accounts that don’t necessarily match the monthly GDP accounts, but at this stage we can treat one as a rough proxy for the other. In fact, with housing and the consumer holding strong, the BoC may have to revise up Q2 growth in the July MPR.
The details behind the Q1 growth numbers were arguably more impressive than the headline print of 3.1% and in a way that indicates that the Q1 rebound was about much more than just reversing the distortions to 2022Q4 GDP. Key is that despite all the overly gloomy consensus talk, the Canadian consumer remains alive and kicking and by enough to have contributed 3.0 ppts to the 3.1% GDP gain in Q1 in weighted terms. Goods spending by consumers contributed 1.5 ppts in weighted terms to GDP growth with services contributing 1.6ppts. This indicates that the interest-sensitive forms of spending were strong including durable goods consumption that contributed 0.9% to overall GDP growth.
Who’s spending? Who’s not, is the better question. 60% of households don’t have a mortgage and are loving a strong job market with idle cash kicking around. The tail of the 40% of households with a mortgage is pressured, but relying upon their pressures to make a macro forecast is a classic case of the tail wagging the dog before even considering the influx of population growth that is leading the G10 group of economies through higher immigration of folks all searching for a place to live in a market with no housing supply.
Chart 2 offers another way of depicting the underlying details by showing the strong rebound in final domestic demand. FDD measures consumption plus investment plus government spending and is a less distorted gauge of underlying economic growth than overall GDP that can be swung in either direction by other effects such as volatile changes in imports and inventories. FDD grew by 2.6% q/q in Q1 which is a very strong reading that the BoC is bound to pay close attention to.
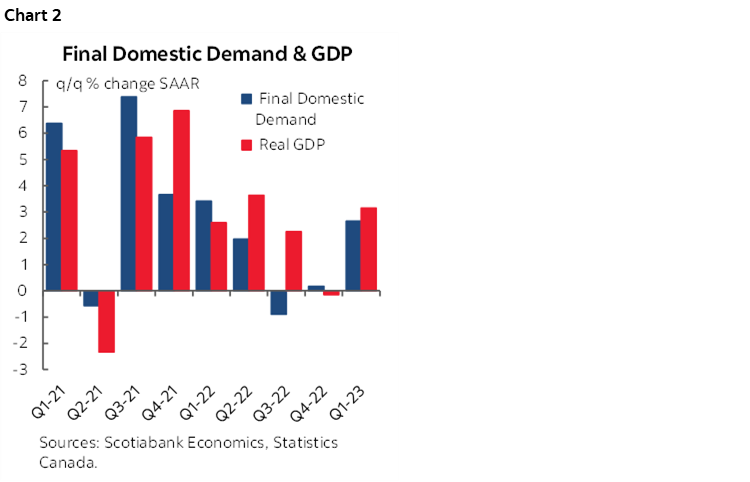
Chart 3 breaks down the weighted contributions to growth by expenditure category in Q1. In addition to consumption drivers, exports added 3.3 ppts to GDP growth. Imports subtracted just 0.3 ppts in annualized terms to Q1 growth because a slightly higher volume of imports represented a bit more of a leakage from the GDP accounting.
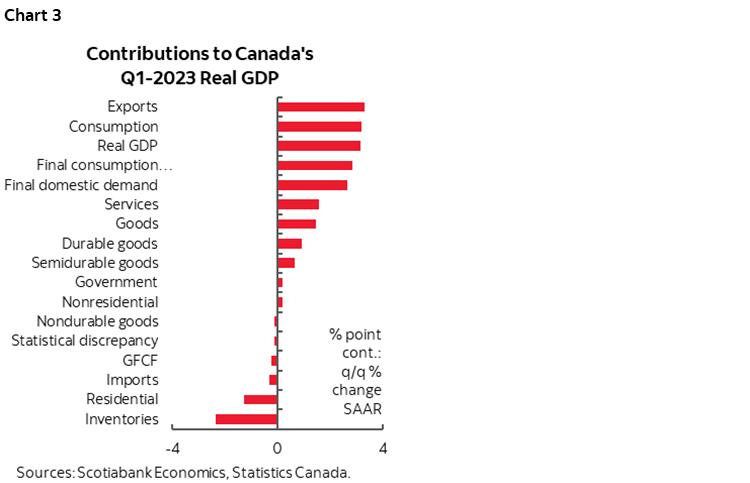
Inventories thankfully subtracted 2.4 ppts from Q1 GDP growth as the pace of inventory accumulation slowed to half the pace of the prior quarter on depletion through strong consumption. In fairness, we can’t just add back inventories to argue that if not for this factor GDP would have truly ripped because we’d also have to adjust other things like consumption, but acknowledging the role played by inventories further highlights the point that the details are robust.
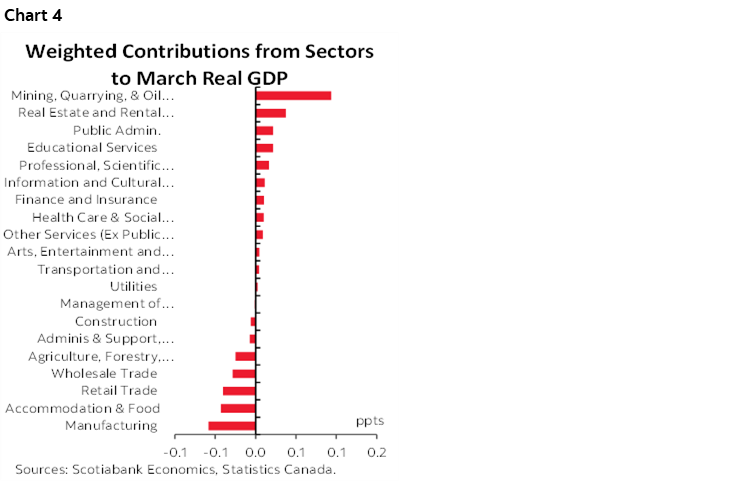
Chart 4 shows the weighted contributions to growth in March by sector of the economy.
April Continued the Resilience
We don't get the breakdown of the preliminary 0.2% m/m April flash GDP reading, but the verbiage does point to softness in public administration which was the strike effect. I suspect that knocked 0.1–0.2 off of April GDP that would have been even stronger than the 0.2% flash reading if not for the strike's direct and indirect effects (also on agriculture etc). That effect will reverse in May to add to growth.
The Housing Wake Up Call
The BoC should definitely pay attention to housing, whatever others think. One reason is stability that I still think is more about stability risks due to unfettered housing strengths rather than exaggerated downside concerns. Some folks won’t like this but in my professional opinion Canada needs monetary policy and macropru tools to further tighten the screws. Another is inflation. Related to the latter is not only housing's direct and indirect contributions to CPI, but also housing's contribution to growth and the overall output gap framework.
To that effect, Statcan noted the following:
"The real estate and rental and leasing sector increased 0.3% in March, its fastest growth rate since February 2022. After a 0.8% increase in February 2023, activity at the offices of real estate agents and brokers and activities related to real estate increased 2.8% in March, its first consecutive increase since February 2022. With the Bank of Canada pausing interest rate hikes and prices seemingly moderating, some buyers re-entered the market, as reflected by increases largely concentrated in British Columbia, particularly the Fraser Valley."
BoC Implications
The BoC is getting clear signals that its policy stance is not yet restrictive enough with each piece of evidence that showcases how core inflation is unacceptably high (here), that growth is resilient as indicated in today’s numbers, that consumers are doing quite well on balance amid obscenely exaggerated concerns about a minority of them, that housing is on a tear again and that the job market is still strong (here). Roughly 20 months into a bond market tightening cycle that preceded the commencement of policy rate hikes should be marked by greater evidence of the damage being done through lag effects that have been given long enough to work by now.
Furthermore, households and businesses don’t believe the BoC’s 2% inflation target as evidenced in the BoC’s own surveys. Prominent strike action resulting in aggressive settlements signals that workers don’t believe the BoC either. It’s time for Governor Macklem to take the gloves off and prove that he’ s serious with concrete action instead of just talk.
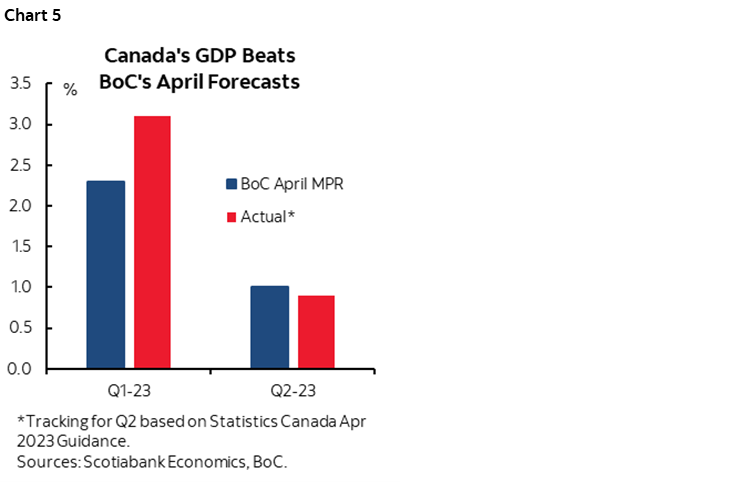
All of this means that the economy is somewhat further into excess demand conditions than they judged in the April MPR (chart 5). That in turns means Canada is still not taking any steps toward opening up disinflationary slack in the economy which means even more concern toward upside risk to inflation than the Governor has already emphasized. And that perspective only addresses inflation risk through the BoC’s beloved output gap framework in a world in which inflation has many more drivers than just output gaps.
If the US House of Representatives passes the debt ceiling agreement this evening as expected, then there is no good reason why the BoC should dither any longer. A hike was considered in April and the case for hiking has since grown. Governor Macklem does not need to tee anything up; he has already done so through his April press conference, his IMF media roundtable, and two rounds of parliamentary testimony. He has made it clear throughout those communications that they are contemplating a hike and that they are more worried about inflation upsides than downsides. He can easily say that those communications teed up a June hike. To wait until July when they’ve already paused for too long now would mean a further loss of precious time in the race against runaway inflation risk. In any event, the BoC surprised markets in 3 of the 8 policy meetings last year and so I don’t know why some still attach such great significance to advance preparedness for their decisions.
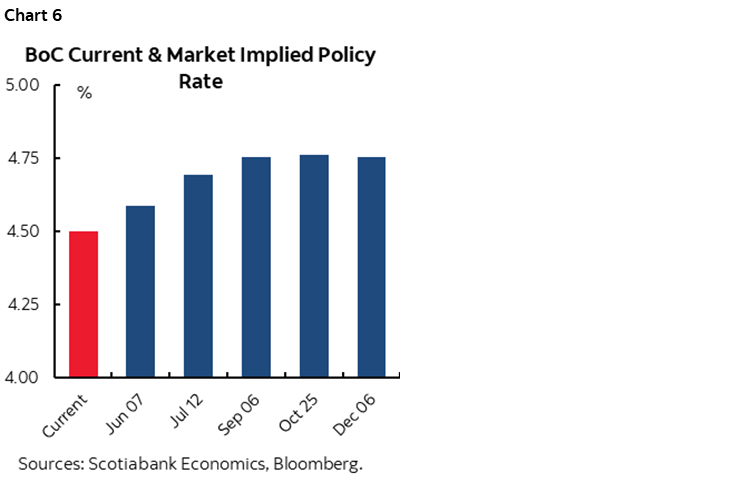
All of which leaves us with chart 6. It sets the minimum bar for the BoC’s policy rate path going forward in my opinion. A 25bps hike would prove that the BoC is serious when it says it is thinking of further tightening and against cutting anytime soon in a signalling sense, but it would probably be insufficient. A more respectable policy rate level should be 5-handled just as the Fed is probably going to take another tightening step on June 14th.
DISCLAIMER
This report has been prepared by Scotiabank Economics as a resource for the clients of Scotiabank. Opinions, estimates and projections contained herein are our own as of the date hereof and are subject to change without notice. The information and opinions contained herein have been compiled or arrived at from sources believed reliable but no representation or warranty, express or implied, is made as to their accuracy or completeness. Neither Scotiabank nor any of its officers, directors, partners, employees or affiliates accepts any liability whatsoever for any direct or consequential loss arising from any use of this report or its contents.
These reports are provided to you for informational purposes only. This report is not, and is not constructed as, an offer to sell or solicitation of any offer to buy any financial instrument, nor shall this report be construed as an opinion as to whether you should enter into any swap or trading strategy involving a swap or any other transaction. The information contained in this report is not intended to be, and does not constitute, a recommendation of a swap or trading strategy involving a swap within the meaning of U.S. Commodity Futures Trading Commission Regulation 23.434 and Appendix A thereto. This material is not intended to be individually tailored to your needs or characteristics and should not be viewed as a “call to action” or suggestion that you enter into a swap or trading strategy involving a swap or any other transaction. Scotiabank may engage in transactions in a manner inconsistent with the views discussed this report and may have positions, or be in the process of acquiring or disposing of positions, referred to in this report.
Scotiabank, its affiliates and any of their respective officers, directors and employees may from time to time take positions in currencies, act as managers, co-managers or underwriters of a public offering or act as principals or agents, deal in, own or act as market makers or advisors, brokers or commercial and/or investment bankers in relation to securities or related derivatives. As a result of these actions, Scotiabank may receive remuneration. All Scotiabank products and services are subject to the terms of applicable agreements and local regulations. Officers, directors and employees of Scotiabank and its affiliates may serve as directors of corporations.
Any securities discussed in this report may not be suitable for all investors. Scotiabank recommends that investors independently evaluate any issuer and security discussed in this report, and consult with any advisors they deem necessary prior to making any investment.
This report and all information, opinions and conclusions contained in it are protected by copyright. This information may not be reproduced without the prior express written consent of Scotiabank.
™ Trademark of The Bank of Nova Scotia. Used under license, where applicable.
Scotiabank, together with “Global Banking and Markets”, is a marketing name for the global corporate and investment banking and capital markets businesses of The Bank of Nova Scotia and certain of its affiliates in the countries where they operate, including; Scotiabank Europe plc; Scotiabank (Ireland) Designated Activity Company; Scotiabank Inverlat S.A., Institución de Banca Múltiple, Grupo Financiero Scotiabank Inverlat, Scotia Inverlat Casa de Bolsa, S.A. de C.V., Grupo Financiero Scotiabank Inverlat, Scotia Inverlat Derivados S.A. de C.V. – all members of the Scotiabank group and authorized users of the Scotiabank mark. The Bank of Nova Scotia is incorporated in Canada with limited liability and is authorised and regulated by the Office of the Superintendent of Financial Institutions Canada. The Bank of Nova Scotia is authorized by the UK Prudential Regulation Authority and is subject to regulation by the UK Financial Conduct Authority and limited regulation by the UK Prudential Regulation Authority. Details about the extent of The Bank of Nova Scotia's regulation by the UK Prudential Regulation Authority are available from us on request. Scotiabank Europe plc is authorized by the UK Prudential Regulation Authority and regulated by the UK Financial Conduct Authority and the UK Prudential Regulation Authority.
Scotiabank Inverlat, S.A., Scotia Inverlat Casa de Bolsa, S.A. de C.V, Grupo Financiero Scotiabank Inverlat, and Scotia Inverlat Derivados, S.A. de C.V., are each authorized and regulated by the Mexican financial authorities.
Not all products and services are offered in all jurisdictions. Services described are available in jurisdictions where permitted by law.