- GDP growth is outpacing BoC expectations...
- ...as Q1 sharply rebounds with evidence of positive momentum into Q2
- Markets may be betting that accidents will drive easing...
- ...but the fundamentals picture doesn’t support this
- Powell’s preferred inflation gauge remains sticky...
- ...which also favours continued Fed tightening...
- ...although it’s a long road to the FOMC’s May meeting
- Canadian GDP, m/m % change, SA, January:
- Actual: 0.5
- Scotia: 0.7
- Consensus: 0.4
- Prior: -0.1
- February guidance: 0.3%
Canada’s economy is rebounding from all of the temporary drags that drove overreaction to Q4 softness. On net, the economy over Q4 and Q1 is outpacing the Bank of Canada’s forecasts and continuing to showcase trend resilience. The figures are a combination of one-part fresh and one-part stale in terms of significance to the outlook.
That’s because while on the one hand they may count for relatively little in a world focused upon forward-looking considerations, on the other hand it says that the economy is not yet anywhere close to creating material disinflationary slack. Ditto for the labour market. By corollary, barring a severe liquidity event in global markets, the fundamentals part of the equation to what drives monetary policy considerations does not lend itself to supporting market pricing for rate cuts and the Canadian front-end remains too dear in my view.
DETAILS
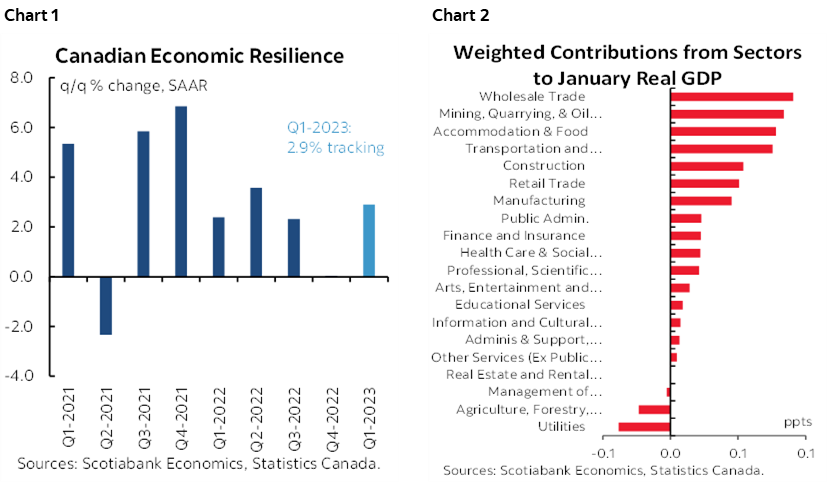
GDP was up 0.5% m/m in January which was a touch stronger than most expected, but more important is the fact that preliminary guidance for February pointed to another gain of 0.3% m/m.
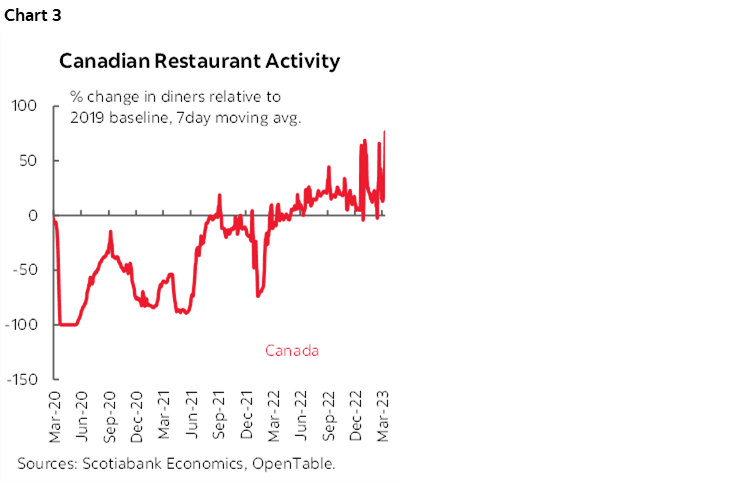
Based upon those readings and assuming flat March GDP only in order to focus the math upon the effects of what is known so far results in Q1 GDP tracking of 2.9% q/q SAAR (chart 1). February’s growth was very broadly based including expected rebounds in some of the sectors that were temporarily held back by distortions late last year (chart 2). Distortions that included the shut Keystone flows given a spill south of the border, two train derailments that disrupted the transportation sector and halted the flow of products to other sectors, and more adverse weather than usual that disrupted travel.
That’s on a production basis and there are strong caveats. Caveats that are more tilted toward the upside.
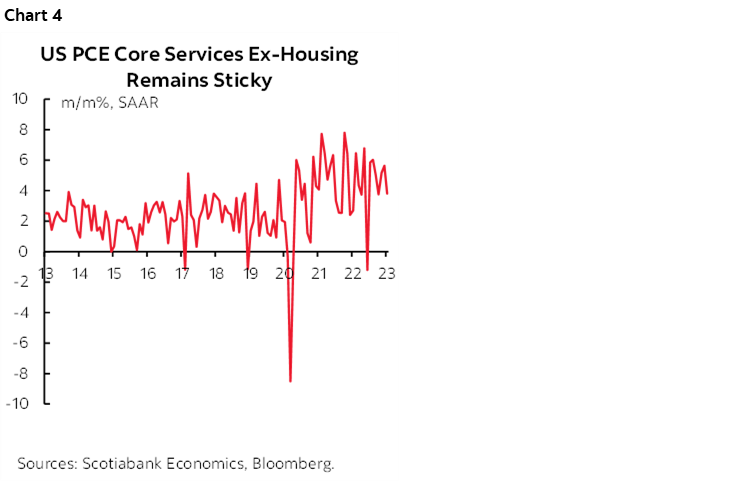
For one thing, alt-data is showing that March could get a strong lift from services given tracking of measures like Open Table restaurant attendance and air travel as previously observed (chart 3). That means that Q1 GDP could grow by over 3% using production-based accounts.
The other caveat is that what the BoC and private forecasters predict is expenditure-based GDP which also considers how higher sales and output were achieved by considering net trade—and hence how much activity did or did not leak out of GDP through imports—and inventory swings. Q4 saw a 40+ year record high inventory drag effect on GDP as inventories lopped multiple percentage points off of growth. Some but not all of that was offset by imports, but on net the two factors were a material drag on Q4 GDP. Q1 is likely to moderate this effect which could add further upside not well captured in production-based GDP.
WHY IT MATTERS TO THE BOC
That matters because the BoC had projected q/q SAAR GDP growth in Q1 of just 0.5% in its January MPR after it overestimated Q4 growth with a 1.3% q/q expansion instead of the flat reading we got. On net, the BoC's GDP forecasts for the two quarters combined face upside and may continue to do so if the above point on March GDP offering an attractive hand-off into Q2 proves to be valid. We’ll see, as all the harder data lies ahead.
What that means is that the economy is not making the BoC’s expected progress toward opening up disinflationary slack. At least not yet. Postponed. Again. And again. And again. And on both sides of the border.
Markets are pricing a quarter point BoC rate cut by September or October of this year and smaller probabilities of a cut before then that have been tamped down from recent peaks. I don’t dismiss the risk of accidents driving market turmoil while nervously awaiting how developments like political dysfunction in the US debt ceiling fracas might cast a pall over summer, but accidents are not a foundation for a forecast and at least thus far the tools at the hands of regulators and central banks have been sufficient to contain the flares that we have observed to date.
Setting aside a forecast bias based upon accidents happening and being mishandled or overwhelming liquidity management, the fundamentals don’t support cut pricing. In my view, central banks are likely to set a higher bar against easing than market participants who think every soft bump and wiggle should drive a pile on into the front-end. In my view, the plague that has beset front-end traders from day one at the embryonic stage of debating hike timing continues to hold them in its grip. The plague that has driven thinking that they can’t possibly hike because gosh that might damage growth when that’s the point. The plague that what kept inflation low in the past must always hold in future. The plague that drives thinking that all it would take is a handful of weak readings to driver central banks toward an abrupt turnaround.
POWELL’S PREFERRED INFLATION GAUGE REMAINS STICKY
On the other side of the border, Chair Powell emphasizes that the measure of inflation he is watching most carefully is PCE core services (ex-energy services) and excluding housing. It serves as a proxy for underlying momentum in service sector inflation as other gauges like housing inflation are likely to weaken in lagging fashion to market-based measures.
This measure was up by 3.8% m/m SA at an annualized rate in February. As chart 4 shows, this remains relatively sticky around the average of the past couple of years. It is not yet posting enough material progress toward slowing back to the Fed’s 2% PCE inflation target.
The main reason for why headline PCE at 0.3% m/m was a touch weaker than CPI at 0.4% was because of the much lower weight that PCE puts on shelter. Shelter was hot in CPI but chopping its weight in half in PCE relative to CPI knocked about 0.1 m/m off PCE. The reconciliation of all of the other differences in CPI and PCE yielded negligible other drivers.
In my view, the core PCE data should do nothing to alter expectations for another 25bps hike from the Fed in May. Onto payrolls next Friday and another round of inflation prints. Today's positioning swings are just noise in the meantime.
DISCLAIMER
This report has been prepared by Scotiabank Economics as a resource for the clients of Scotiabank. Opinions, estimates and projections contained herein are our own as of the date hereof and are subject to change without notice. The information and opinions contained herein have been compiled or arrived at from sources believed reliable but no representation or warranty, express or implied, is made as to their accuracy or completeness. Neither Scotiabank nor any of its officers, directors, partners, employees or affiliates accepts any liability whatsoever for any direct or consequential loss arising from any use of this report or its contents.
These reports are provided to you for informational purposes only. This report is not, and is not constructed as, an offer to sell or solicitation of any offer to buy any financial instrument, nor shall this report be construed as an opinion as to whether you should enter into any swap or trading strategy involving a swap or any other transaction. The information contained in this report is not intended to be, and does not constitute, a recommendation of a swap or trading strategy involving a swap within the meaning of U.S. Commodity Futures Trading Commission Regulation 23.434 and Appendix A thereto. This material is not intended to be individually tailored to your needs or characteristics and should not be viewed as a “call to action” or suggestion that you enter into a swap or trading strategy involving a swap or any other transaction. Scotiabank may engage in transactions in a manner inconsistent with the views discussed this report and may have positions, or be in the process of acquiring or disposing of positions, referred to in this report.
Scotiabank, its affiliates and any of their respective officers, directors and employees may from time to time take positions in currencies, act as managers, co-managers or underwriters of a public offering or act as principals or agents, deal in, own or act as market makers or advisors, brokers or commercial and/or investment bankers in relation to securities or related derivatives. As a result of these actions, Scotiabank may receive remuneration. All Scotiabank products and services are subject to the terms of applicable agreements and local regulations. Officers, directors and employees of Scotiabank and its affiliates may serve as directors of corporations.
Any securities discussed in this report may not be suitable for all investors. Scotiabank recommends that investors independently evaluate any issuer and security discussed in this report, and consult with any advisors they deem necessary prior to making any investment.
This report and all information, opinions and conclusions contained in it are protected by copyright. This information may not be reproduced without the prior express written consent of Scotiabank.
™ Trademark of The Bank of Nova Scotia. Used under license, where applicable.
Scotiabank, together with “Global Banking and Markets”, is a marketing name for the global corporate and investment banking and capital markets businesses of The Bank of Nova Scotia and certain of its affiliates in the countries where they operate, including; Scotiabank Europe plc; Scotiabank (Ireland) Designated Activity Company; Scotiabank Inverlat S.A., Institución de Banca Múltiple, Grupo Financiero Scotiabank Inverlat, Scotia Inverlat Casa de Bolsa, S.A. de C.V., Grupo Financiero Scotiabank Inverlat, Scotia Inverlat Derivados S.A. de C.V. – all members of the Scotiabank group and authorized users of the Scotiabank mark. The Bank of Nova Scotia is incorporated in Canada with limited liability and is authorised and regulated by the Office of the Superintendent of Financial Institutions Canada. The Bank of Nova Scotia is authorized by the UK Prudential Regulation Authority and is subject to regulation by the UK Financial Conduct Authority and limited regulation by the UK Prudential Regulation Authority. Details about the extent of The Bank of Nova Scotia's regulation by the UK Prudential Regulation Authority are available from us on request. Scotiabank Europe plc is authorized by the UK Prudential Regulation Authority and regulated by the UK Financial Conduct Authority and the UK Prudential Regulation Authority.
Scotiabank Inverlat, S.A., Scotia Inverlat Casa de Bolsa, S.A. de C.V, Grupo Financiero Scotiabank Inverlat, and Scotia Inverlat Derivados, S.A. de C.V., are each authorized and regulated by the Mexican financial authorities.
Not all products and services are offered in all jurisdictions. Services described are available in jurisdictions where permitted by law.