- Canada generated another job gain that defied the doomsters
- Wage growth took off again
- A strong gain in hours worked points to a strong GDP rebound
- BoC hike pricing is too low
- Canadian jobs m/m 000s // unemployment rate, February, SA:
- Actual: +21.8 / 5.0
- Scotia: 10 / 5.0
- Consensus: 10 (-25k to +40k range) / 5.1
- Prior: 150 / 5.0
Canada’s jobs juggernaut continues to march on and in ways that reignited wage pressures while pointing toward a strong rebound in GDP.
At the margin the evidence continues to support the narrative that the BoC isn’t done yet. I think contract pricing for each of the next three meetings is underestimating the risk of a hike. Interfering with market pricing are what I think to be exaggerated market reactions to Silicon Valley Bank and a different interpretation of US jobs numbers explained in a separate note about them. Wage pressures and rebounding GDP both add inflation risk.
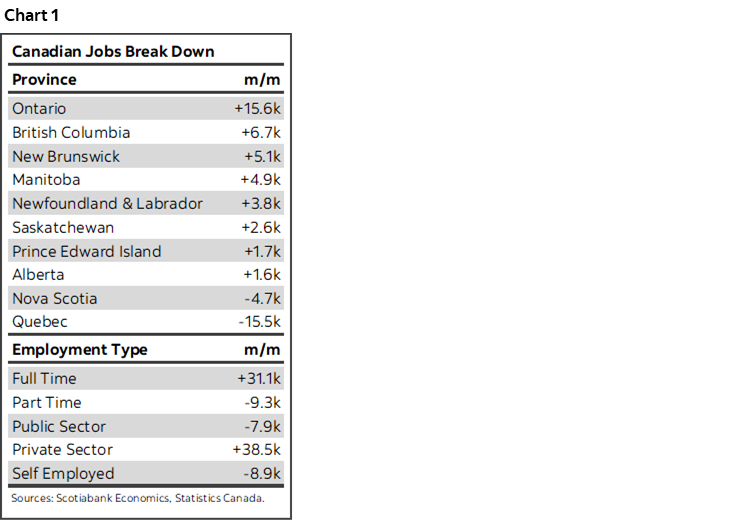
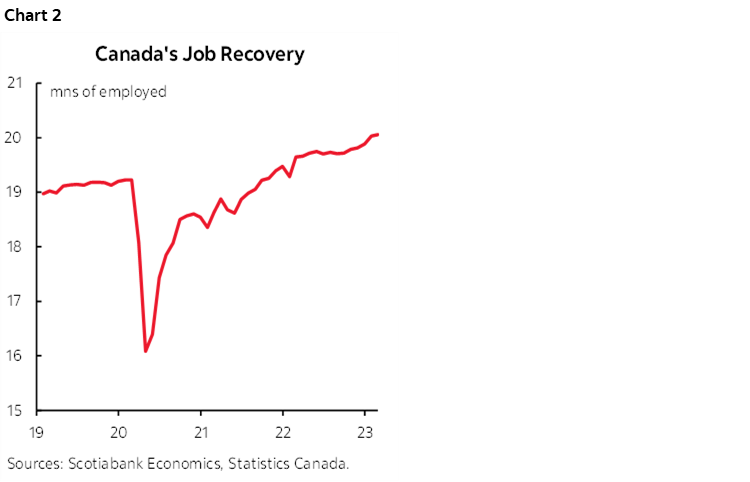
Chart 1 shows some summary details. Chart 2 shows that there are now 831,000 more jobs today than there were just before the pandemic struck back in February 2020.
The 22k rise in employment adds to what has been a cumulative pace of job growth equalling 172k so far in 2023 and 336k new jobs since job creation began to take off in October. It has been 12– 18 months since rates began to take off depending upon whether we cite BoC hikes that began a year ago or market pressures that began to price hikes before that. It’s perplexing to see job growth accelerate this far into higher rate pressures instead of at least decelerating and this continues to emphasize my arguments for how the labour cycle may be very different this time. I’ll repeat those points later in this note.
Statcan curiously said that employment ‘held steady.’ Using the +/-57k 95% confidence interval for monthly changes in employment would suggest that employment was anywhere between -35k and +79k. To say it ‘held steady’ biases their commentary toward the left tail of this confidence interval which isn’t statistically justified in my view.
WAGE PRESSURES WERE REIGNITED
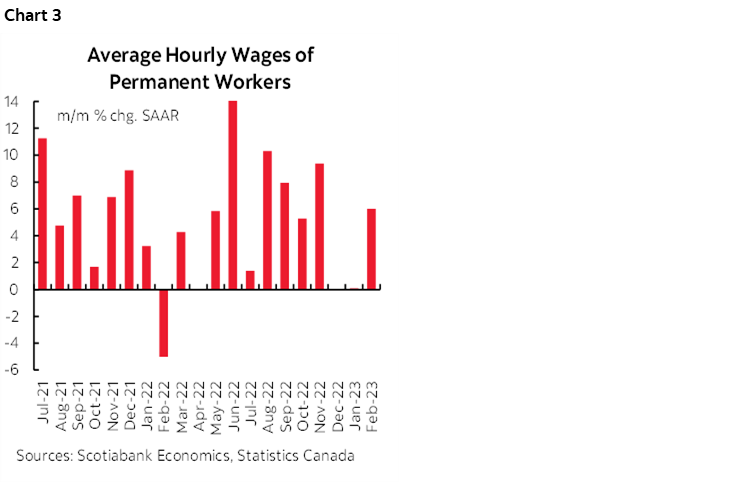
Wage growth took off again. Average hourly wages of permanent employees were up by 6% m/m at a seasonally adjusted and annualized pace in February. Canada had gone through a soft patch for wage growth in December and January and February’s gain takes that back up to the powerful gains that were being recorded from about last May through to November (chart 3). More data is required to avoid over-reacting to either the soft patch or the resumption of strong gains. Still, the BoC likes to quote year-over-year wage growth for whatever reason and it picked up to 5.4% from 4.5% the prior month.
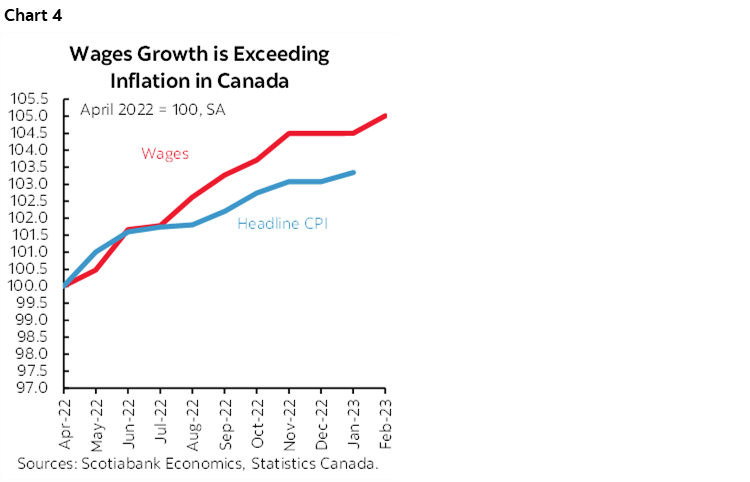
As chart 4 shows, the trend remains pointed to how wage gains have been outpacing headline inflation for almost a year now.
HOURS WORKED POINT TO A STRONG Q1 GDP REBOUND
My goodness you are a bunch of busy beavers. Hours worked are tracking a strong gain of 4.5% q/q SAAR in Q1. That’s the biggest gain since 2021Q4 (chart 5).
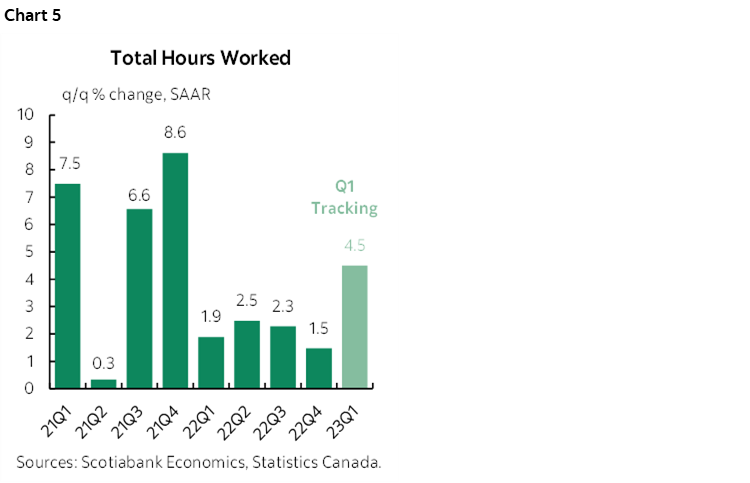
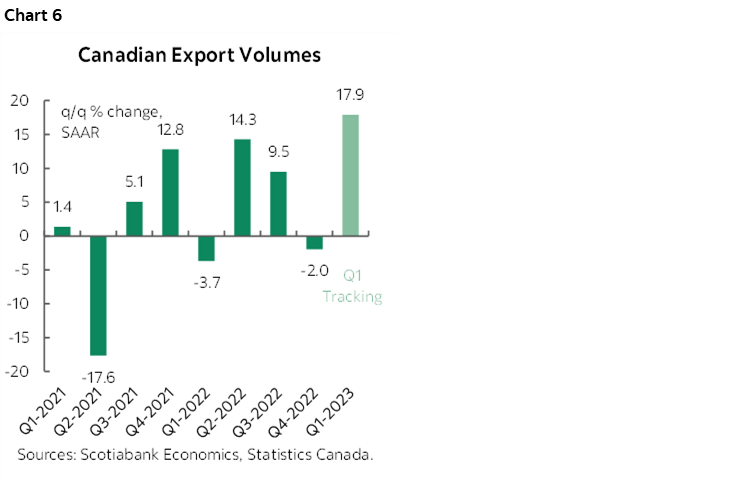
Since GDP is hours worked times labour productivity, the strong gain in hours is a positive indicator for GDP. When added to the strong gain in exports that is being tracked so far for Q1 (chart 6) the overall effect suggests that Q1 GDP growth will be strong.
DETAILS
The composition of the job gain in Canada was solid. It was all full-time (+31k) as part-time jobs were down 9k.
The gain was all in private sector payrolls (+39k) as public payrolls slipped by 8k and the self-employed category was down by 9k.
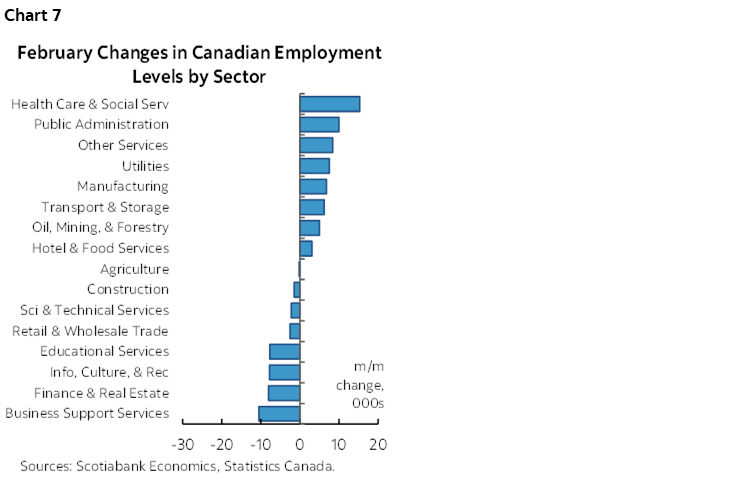
By sector, it was goods-producing industries that led the way for a change (chart 7). Manufacturing added 7k with utilities up 8k and resources added 5k. Service sectors added only 4k with the main addition coming through health care and social assistance (+15k) as well as transportation and warehousing (+6k).
Ontario led the way among the provinces (+16k) with smaller assists from BC, Manitoba and the east coast provinces of N.B. and Newfoundland & Labrador.
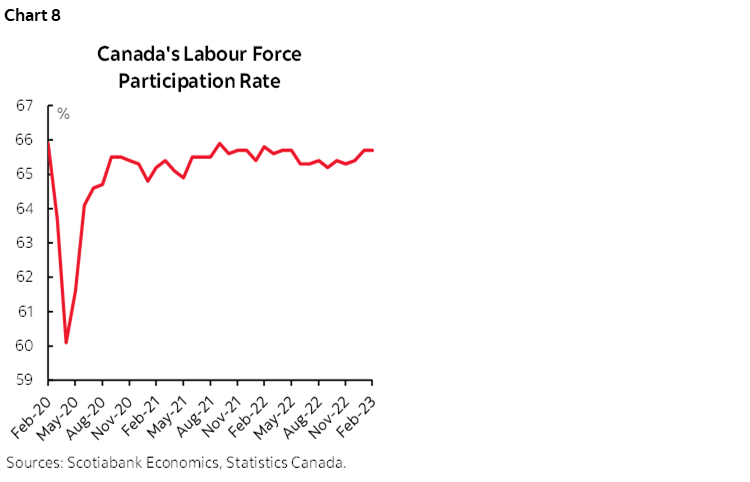
The unemployment rate held steady at 5%. That was because the employment gain of 22k was outpaced by a 42k rise in the size of the labour force but that wasn’t a big enough different to impact the UR. The labour force participation rate was unchanged at 65.7% (chart 8).
WHY IS THIS HAPPENING?
I’ll repeat arguments that have been provided on prior occasions for why trend job growth has accelerated rather than decelerating this far into a rising rate cycle.
- Supply chains are improving, offering the ability to produce more. It’s extremely unusual to have improving supply chains into a tightening environment which is among many differences in our times compared to the human tendency to look for past parallels.
- To meet higher production, adding variable costs may be preferred over fixed costs in terms of sourcing inputs to produce more amid all of the uncertainty. It’s easier to adjust VCs than getting stuck with fixed depreciation and interest charges.
- Productivity is weaker than in 2019 in absolute terms. Employers may feel they need to hire more workers to produce an hour's worth of output than they would have had to hire in 2019 to do the same. In short, hire more folks to make up for some of the slackers!
- There are still massive job vacancies in sectors that couldn't hire anyone in the past and now can. I don’t buy Macklem’s line about falling vacancies as the decline is a rounding error with still nearly 1 million job openings in Canada.
- I’m really not sure about the effects of immigration. It’s not showing up in 'traditional' sectors (prof/sci/tech or trades or self-employed) as much as elsewhere. Plus there tend to be integration lags.
- There is probably ongoing labour hording. Companies that release talent in this environment can just simply wave buh-bye as they go to the competition and permanently handicap organizations. I’m of the strong belief that companies need to be super careful that excessive restructuring winds up harming their revenues and competitiveness in this environment.
- And of course there are the fundamental supports via the terms of trade, excellent corporate balance sheet fundamentals, manageable inventories that if anything need to go higher on an I:S ratio basis, and fiscal supports. Plus I’m still of the belief that there is way too much negativity toward the household sector in Canada.
- Another explanation I've been using is the economic necessity angle. In other words, we have more people being drawn into the workforce and going back to work if they have that as an option in their households and given pressures on finances. They are filling vacancies out of necessity which eases the shock to finances. In other cases, higher wages may be driving a pull factor even though that stumbled a bit that last couple of months.
DISCLAIMER
This report has been prepared by Scotiabank Economics as a resource for the clients of Scotiabank. Opinions, estimates and projections contained herein are our own as of the date hereof and are subject to change without notice. The information and opinions contained herein have been compiled or arrived at from sources believed reliable but no representation or warranty, express or implied, is made as to their accuracy or completeness. Neither Scotiabank nor any of its officers, directors, partners, employees or affiliates accepts any liability whatsoever for any direct or consequential loss arising from any use of this report or its contents.
These reports are provided to you for informational purposes only. This report is not, and is not constructed as, an offer to sell or solicitation of any offer to buy any financial instrument, nor shall this report be construed as an opinion as to whether you should enter into any swap or trading strategy involving a swap or any other transaction. The information contained in this report is not intended to be, and does not constitute, a recommendation of a swap or trading strategy involving a swap within the meaning of U.S. Commodity Futures Trading Commission Regulation 23.434 and Appendix A thereto. This material is not intended to be individually tailored to your needs or characteristics and should not be viewed as a “call to action” or suggestion that you enter into a swap or trading strategy involving a swap or any other transaction. Scotiabank may engage in transactions in a manner inconsistent with the views discussed this report and may have positions, or be in the process of acquiring or disposing of positions, referred to in this report.
Scotiabank, its affiliates and any of their respective officers, directors and employees may from time to time take positions in currencies, act as managers, co-managers or underwriters of a public offering or act as principals or agents, deal in, own or act as market makers or advisors, brokers or commercial and/or investment bankers in relation to securities or related derivatives. As a result of these actions, Scotiabank may receive remuneration. All Scotiabank products and services are subject to the terms of applicable agreements and local regulations. Officers, directors and employees of Scotiabank and its affiliates may serve as directors of corporations.
Any securities discussed in this report may not be suitable for all investors. Scotiabank recommends that investors independently evaluate any issuer and security discussed in this report, and consult with any advisors they deem necessary prior to making any investment.
This report and all information, opinions and conclusions contained in it are protected by copyright. This information may not be reproduced without the prior express written consent of Scotiabank.
™ Trademark of The Bank of Nova Scotia. Used under license, where applicable.
Scotiabank, together with “Global Banking and Markets”, is a marketing name for the global corporate and investment banking and capital markets businesses of The Bank of Nova Scotia and certain of its affiliates in the countries where they operate, including; Scotiabank Europe plc; Scotiabank (Ireland) Designated Activity Company; Scotiabank Inverlat S.A., Institución de Banca Múltiple, Grupo Financiero Scotiabank Inverlat, Scotia Inverlat Casa de Bolsa, S.A. de C.V., Grupo Financiero Scotiabank Inverlat, Scotia Inverlat Derivados S.A. de C.V. – all members of the Scotiabank group and authorized users of the Scotiabank mark. The Bank of Nova Scotia is incorporated in Canada with limited liability and is authorised and regulated by the Office of the Superintendent of Financial Institutions Canada. The Bank of Nova Scotia is authorized by the UK Prudential Regulation Authority and is subject to regulation by the UK Financial Conduct Authority and limited regulation by the UK Prudential Regulation Authority. Details about the extent of The Bank of Nova Scotia's regulation by the UK Prudential Regulation Authority are available from us on request. Scotiabank Europe plc is authorized by the UK Prudential Regulation Authority and regulated by the UK Financial Conduct Authority and the UK Prudential Regulation Authority.
Scotiabank Inverlat, S.A., Scotia Inverlat Casa de Bolsa, S.A. de C.V, Grupo Financiero Scotiabank Inverlat, and Scotia Inverlat Derivados, S.A. de C.V., are each authorized and regulated by the Mexican financial authorities.
Not all products and services are offered in all jurisdictions. Services described are available in jurisdictions where permitted by law.