- With May’s upside, we have three months of above-target core inflation
- More pressure lies ahead
- The BoC is at risk of missing the memo that other central banks have gotten…
- ...as the real rate is too low while bank capital rules ease and CAD tumbles…
- ...alongside fiscal policy easing and resilient trade
- Canadian CPI m/m / y/y %, NSA, May:
- Actual: 1.0 / 3.2
- Scotia: 0.8 / 3.1
- Consensus: 0.8 / 3.0
- Prior:0.4 / 2.8
- Trimmed mean CPI m/m SAAR %: 2.8
- Weighted median CPI m/m SAAR %: 2.2
This note was delayed by marketing demands but I think it’s worth advancing a thesis I don’t see well covered.
We now have three reports that provide convincing evidence that a temporary soft patch on underlying inflation is being left behind. Core inflation measures picked up in May and their three-month moving averages are restoring above-2% momentum in price pressures at the margin. See charts 1–3.
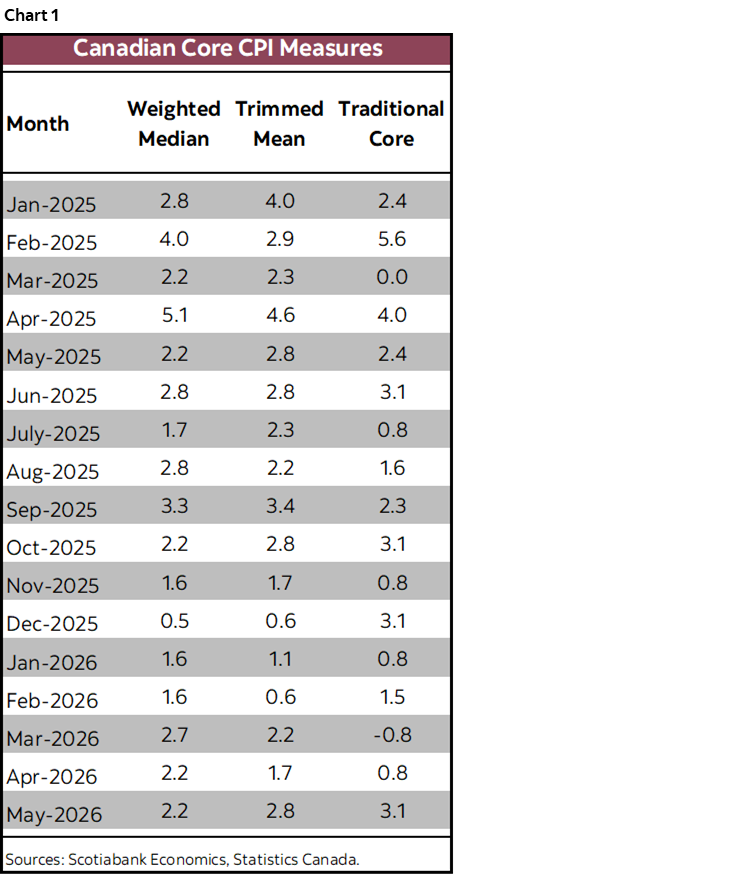
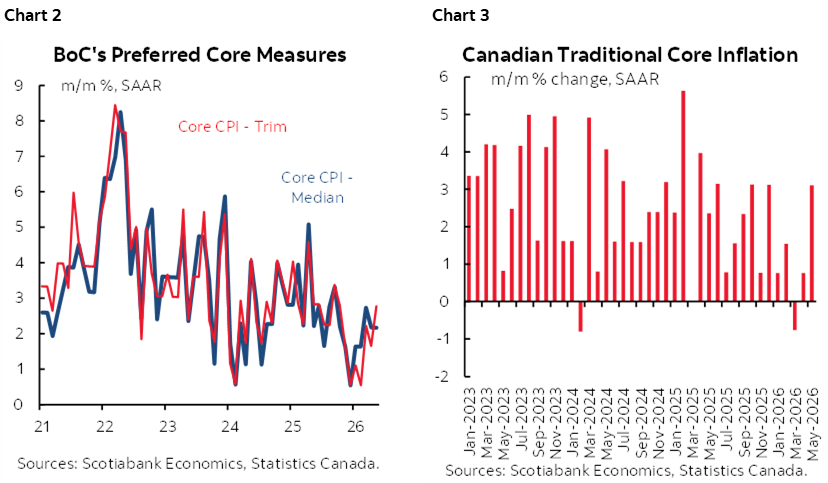
Key are the m/m annualized and seasonally adjusted (SAAR) trimmed mean and weighted median CPI measures. They provide evidence on inflationary pressures at the margin, whereas the year-over-year measures are calculated as slow-moving 12-month weighted contributions to a year-over-year rate and they turn slowly and with a lag.
Trimmed mean CPI landed at 2.8% m/m SAAR in May. Weighted median CPI was 2.2%. Their average of 2.5% is above the 2% headline target along with total CPI at 3.2%. The 3-month moving averages of TM and WM inflation now stand at 2.4% for weighted median CPI and 2.2% for trimmed mean CPI. Canada has left behind the low readings over the November to February period.
Traditional core CPI (ex-food and energy) was up by 3.1% m/m SAAR in May. The 3-month moving average measure for that was soft at 1% m/m SAAR but is not the BoC’s preferred gauge and has had unusual distortions.
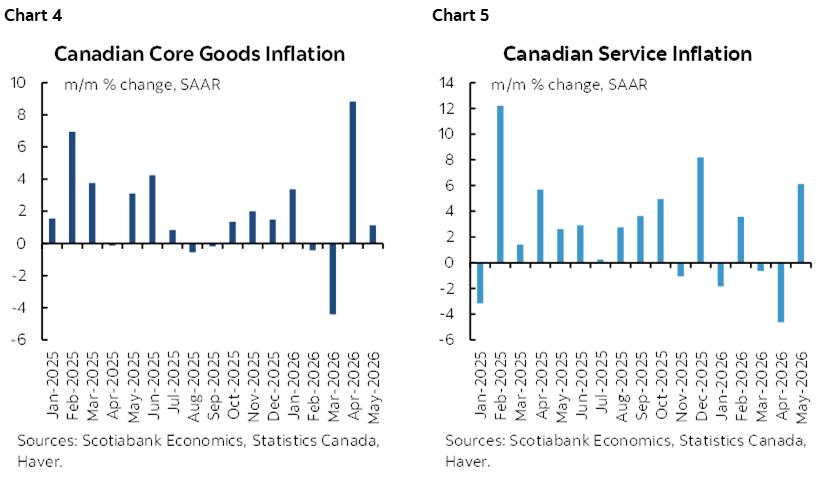
Charts 4 and 5 show core goods inflation and services inflation with the caution they are not trimmed or median measures.
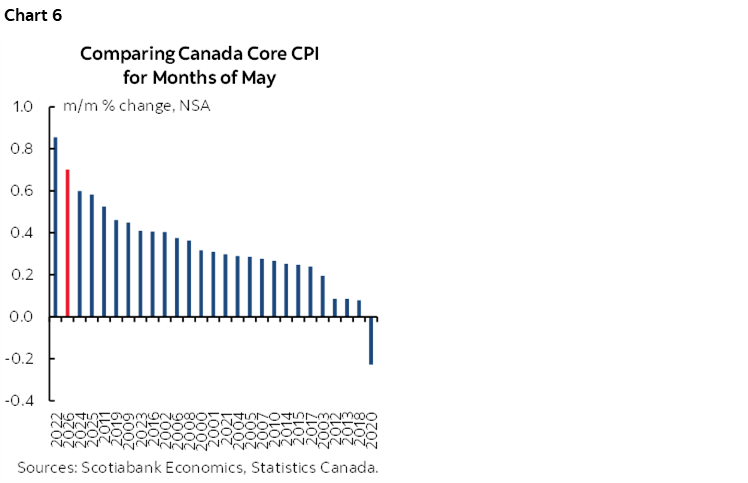
In seasonally unadjusted terms, core CPI at 0.7% m/m NSA was the second highest reading compared to like months of May this century (chart 6). The seasonal adjustment factor applied to core CPI was among the lowest on record compared to like months of May which held back the already hot core CPI m/m measure from being even hotter in May.
Governor Macklem said the BoC would look through inflation affecting total CPI via commodities. He did also warn they would not allow this to become a broader inflation challenge in the core readings.
Governor Macklem has evidence that the BoC risks falling behind a rebound in core inflation into further likely upside risk. Please see my weekly for an explanation of those forms of upside risk to underlying inflation here.
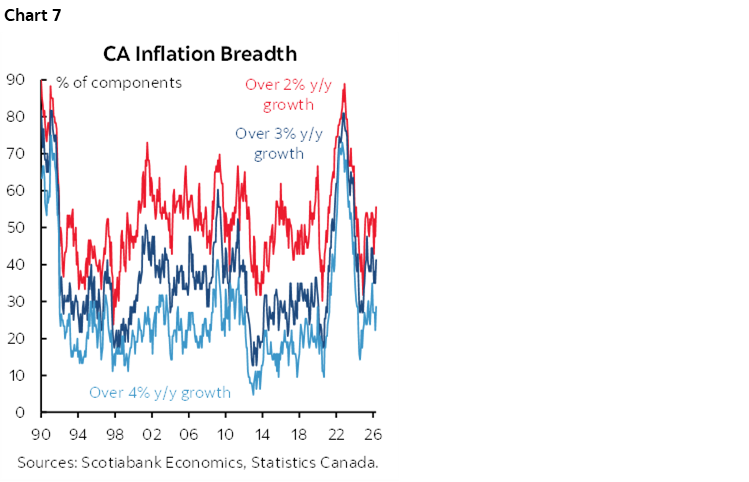
Chart 7 shows persistently elevated breadth of price increases above the 2% inflation target.
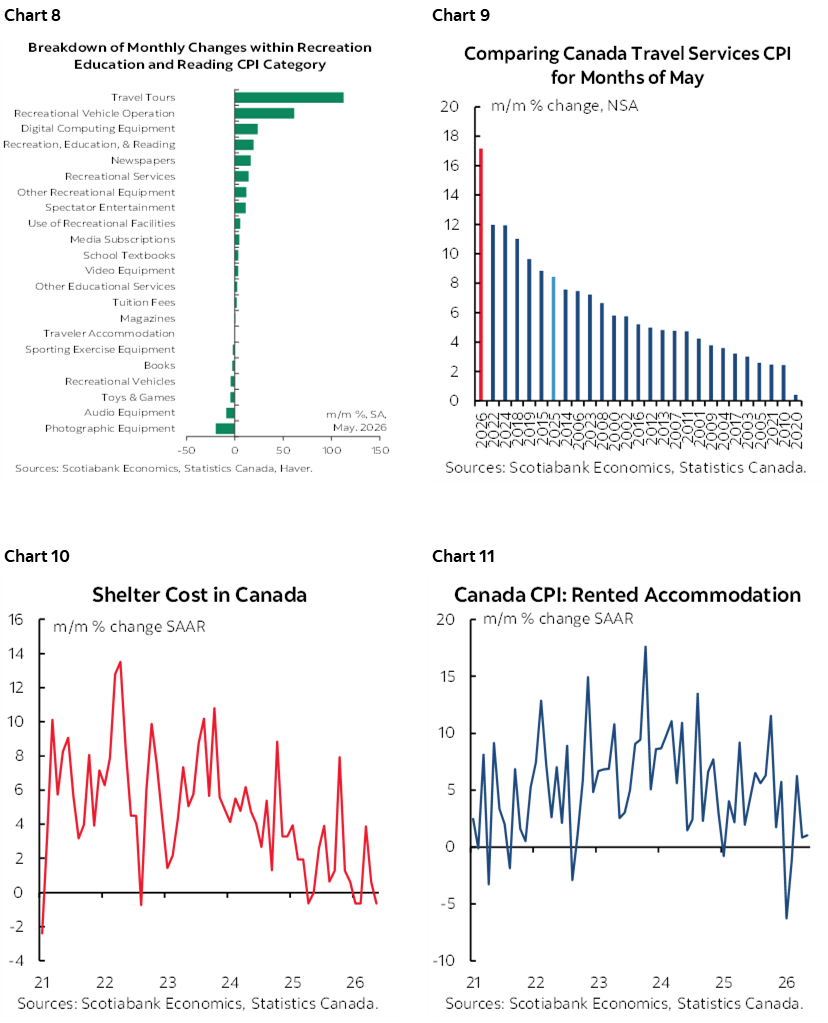
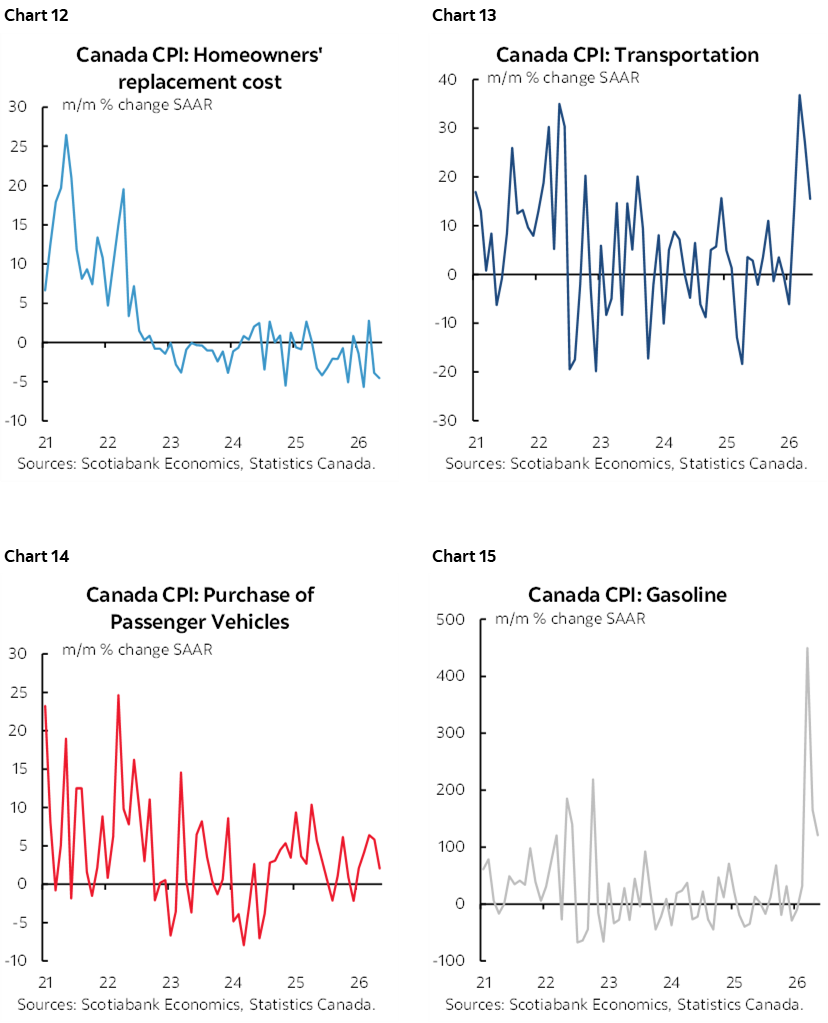
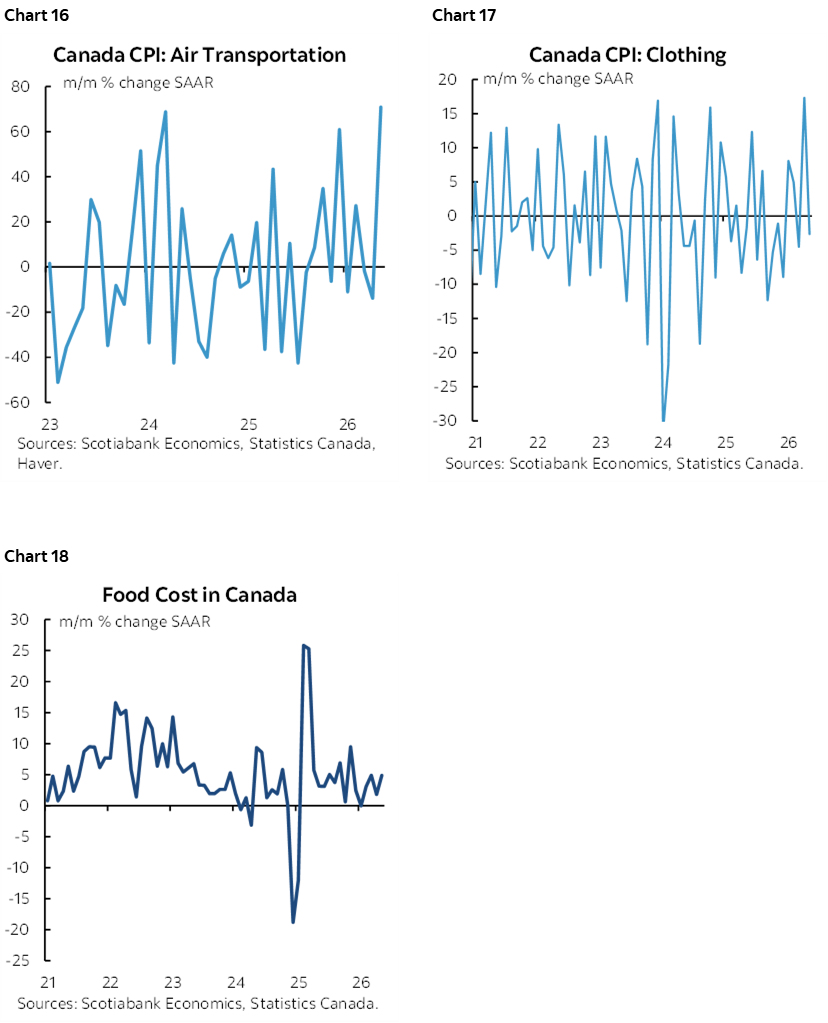
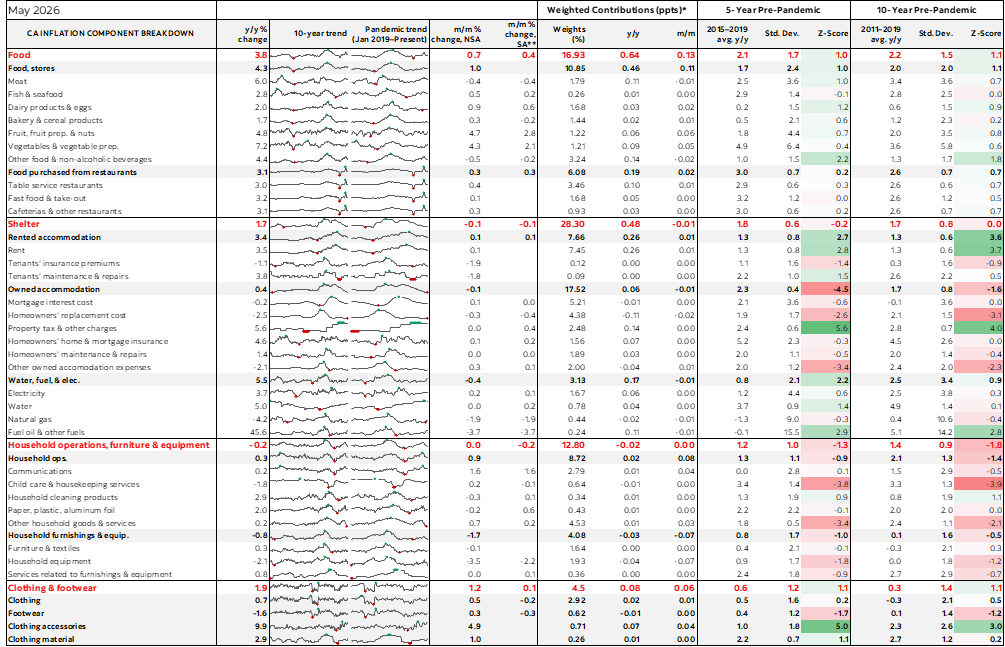
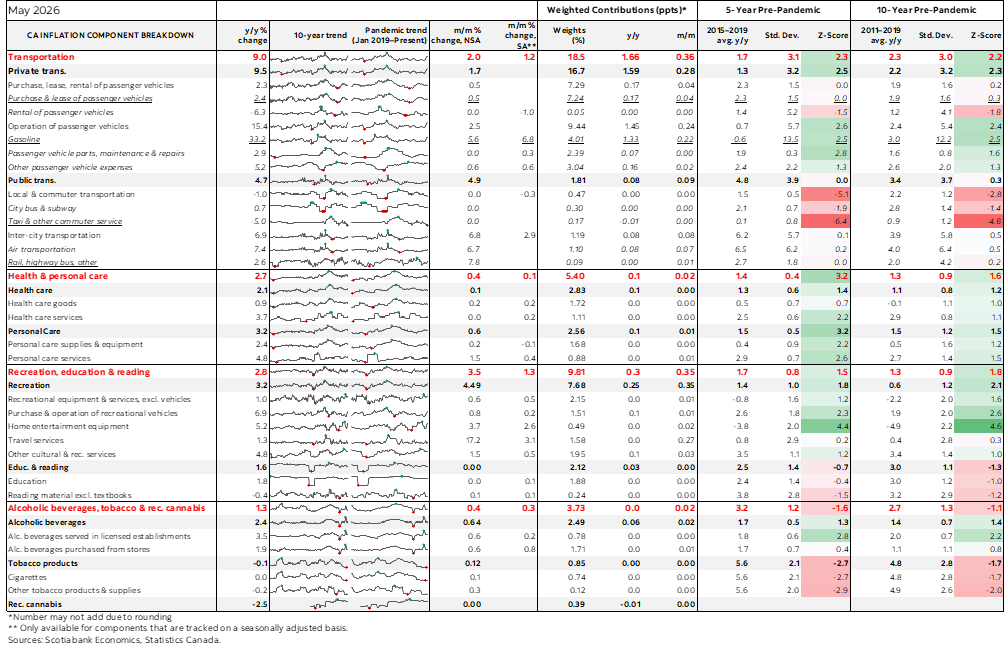
Charts 8–18 showcase individual contributors.
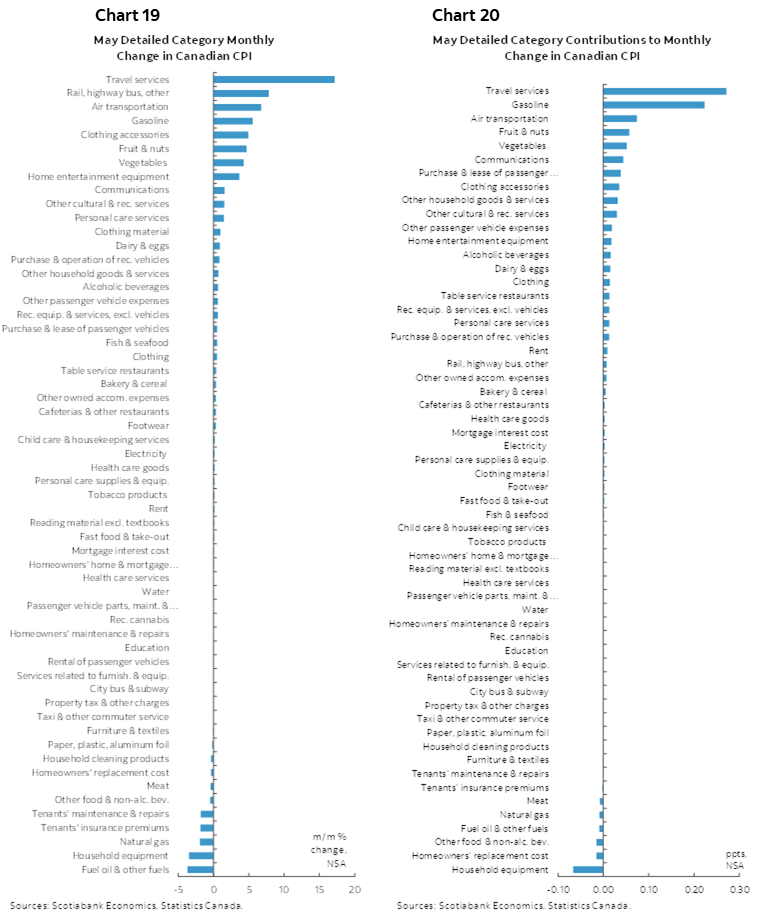
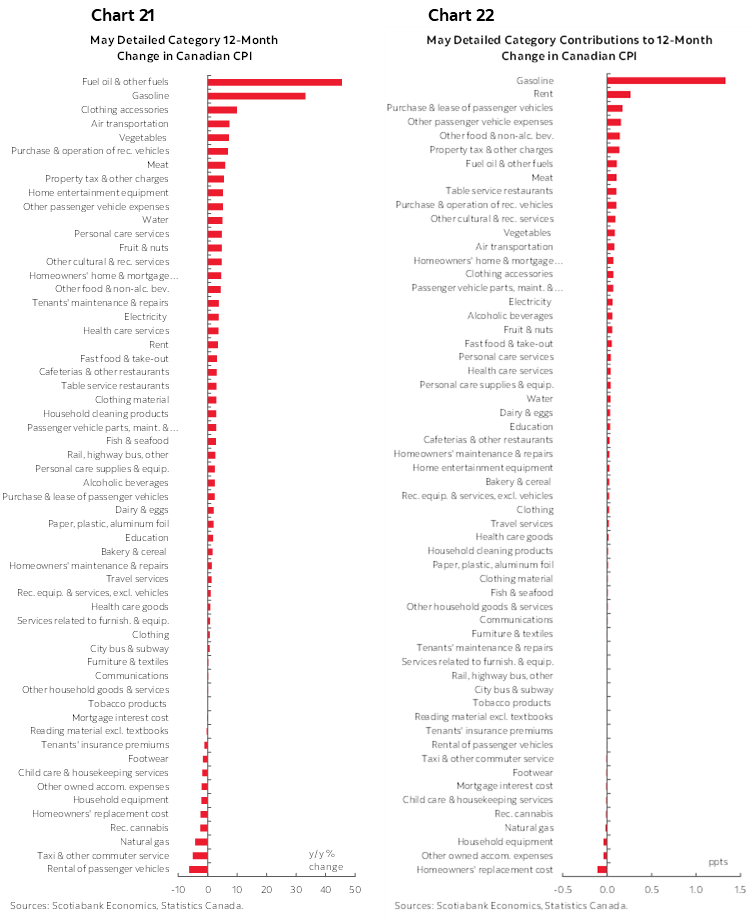
Charts 19–20 break out the basket in terms of individual m/m price changes and their weighted contributions to CPI inflation. Charts 21–22 do likewise for y/y measures.
Multiple other central banks are either hiking or talking about hiking—except the BoC. Yet Canada is the prime beneficiary of a commodity surge. The Bank of Canada has passively eased by allowing its inflation-adjusted policy rate to arguably go negative in relation to expected inflation. Inflation expectations are likely to move higher in the BoC’s July business and consumer surveys based upon samples already collected and they have been elevated across all time horizons.
OSFI’s easing of bank capital rules is a partial rate equivalence that adds to easier conditions.
Scotiabank Economics stands by its call for higher borrowing costs later this year. Unlike the Fed and Bank of England, the BoC’s nominal policy rate is at the bottom end of the neutral rate range. It’s time for taking out some insurance against an emerging inflation challenge. My fear is that the BoC will wait too late again and do so straight into the year-end 5-year review of its remit and the end of Governor Macklem’s term in 2027.
DISCLAIMER
This report has been prepared by Scotiabank Economics as a resource for the clients of Scotiabank. Opinions, estimates and projections contained herein are our own as of the date hereof and are subject to change without notice. The information and opinions contained herein have been compiled or arrived at from sources believed reliable but no representation or warranty, express or implied, is made as to their accuracy or completeness. Neither Scotiabank nor any of its officers, directors, partners, employees or affiliates accepts any liability whatsoever for any direct or consequential loss arising from any use of this report or its contents.
These reports are provided to you for informational purposes only. This report is not, and is not constructed as, an offer to sell or solicitation of any offer to buy any financial instrument, nor shall this report be construed as an opinion as to whether you should enter into any swap or trading strategy involving a swap or any other transaction. The information contained in this report is not intended to be, and does not constitute, a recommendation of a swap or trading strategy involving a swap within the meaning of U.S. Commodity Futures Trading Commission Regulation 23.434 and Appendix A thereto. This material is not intended to be individually tailored to your needs or characteristics and should not be viewed as a “call to action” or suggestion that you enter into a swap or trading strategy involving a swap or any other transaction. Scotiabank may engage in transactions in a manner inconsistent with the views discussed this report and may have positions, or be in the process of acquiring or disposing of positions, referred to in this report.
Scotiabank, its affiliates and any of their respective officers, directors and employees may from time to time take positions in currencies, act as managers, co-managers or underwriters of a public offering or act as principals or agents, deal in, own or act as market makers or advisors, brokers or commercial and/or investment bankers in relation to securities or related derivatives. As a result of these actions, Scotiabank may receive remuneration. All Scotiabank products and services are subject to the terms of applicable agreements and local regulations. Officers, directors and employees of Scotiabank and its affiliates may serve as directors of corporations.
Any securities discussed in this report may not be suitable for all investors. Scotiabank recommends that investors independently evaluate any issuer and security discussed in this report, and consult with any advisors they deem necessary prior to making any investment.
This report and all information, opinions and conclusions contained in it are protected by copyright. This information may not be reproduced without the prior express written consent of Scotiabank.
™ Trademark of The Bank of Nova Scotia. Used under license, where applicable.
Scotiabank, together with “Global Banking and Markets”, is a marketing name for the global corporate and investment banking and capital markets businesses of The Bank of Nova Scotia and certain of its affiliates in the countries where they operate, including; Scotiabank Europe plc; Scotiabank (Ireland) Designated Activity Company; Scotiabank Inverlat S.A., Institución de Banca Múltiple, Grupo Financiero Scotiabank Inverlat, Scotia Inverlat Casa de Bolsa, S.A. de C.V., Grupo Financiero Scotiabank Inverlat, Scotia Inverlat Derivados S.A. de C.V. – all members of the Scotiabank group and authorized users of the Scotiabank mark. The Bank of Nova Scotia is incorporated in Canada with limited liability and is authorised and regulated by the Office of the Superintendent of Financial Institutions Canada. The Bank of Nova Scotia is authorized by the UK Prudential Regulation Authority and is subject to regulation by the UK Financial Conduct Authority and limited regulation by the UK Prudential Regulation Authority. Details about the extent of The Bank of Nova Scotia's regulation by the UK Prudential Regulation Authority are available from us on request. Scotiabank Europe plc is authorized by the UK Prudential Regulation Authority and regulated by the UK Financial Conduct Authority and the UK Prudential Regulation Authority.
Scotiabank Inverlat, S.A., Scotia Inverlat Casa de Bolsa, S.A. de C.V, Grupo Financiero Scotiabank Inverlat, and Scotia Inverlat Derivados, S.A. de C.V., are each authorized and regulated by the Mexican financial authorities.
Not all products and services are offered in all jurisdictions. Services described are available in jurisdictions where permitted by law.