- Canadian short-term yields temporarily dipped, CAD depreciated...
- ...as Canadian CPI headlines appeared weaker...
- ...but new ‘core’ measures suggest stable above-target price pressures...
- ...and they are the ones that the BoC has been emphasizing
- Evaluating inflationary pressures remains a slow grind
- The BoC’s decision in March was already pre-set...
- ...as it will take months of data and developments to inform its conditional pause
- Strong retail sales volumes reinforce consumer resilience
- Canadian CPI, m/m % NSA // y/y %, January:
- Actual: 0.5 / 5.9
- Scotia: 0.7 / 6.1
- Consensus: 0.7 / 6.1
- Prior: -0.6 / 6.3
- Canadian trimmed mean // weighted median // average, y/y %, January:
- Actual: 5.1 / 5.0
- Prior: 5.3 / 5.2 (revised up from 5.3 / 5.0 / 5.15)
Markets clearly saw evidence of weaker inflation and responded by at first unwinding some of the rise in shorter-term yields that was occurring before the data and by driving the C$ to depreciate by about half a penny afterward. CAD retained this weaker bias after the dust settled, but on a morning of broad strength in the USD. Most of the initial rates response was unwound, however, as the two-year GoC yield now trades close to where it was before the data. To leave it at what markets emphasized in their initial response would be an incomplete take on the full suite of evidence in my view.
WHAT MARKETS SAW
Markets reacted the way they did based upon two main things. One is that m/m headline CPI at 0.5% without seasonal adjustment was a little softer than expected and that’s what instantly flashes on traders’ screens. That translated into a 0.26% m/m SA headline CPI increase which was close to my estimate of 0.3% so there isn’t as much surprise on the seasonally adjusted figure. Still, it’s a soft-ish reading but at 3.2% m/m SAAR it’s a definite bounceback from the 0% m/m SAAR reading in December.
Second is that year-over-year gauges of inflation decelerated. Headline CPI was at 5.9% (6.3% prior). Traditional core CPI (ex-food-and-energy) also eased back to 4.9% from 5.3% partly because the m/m seasonally adjusted reading was up by only 0.14% m/m (1.7% m/m SAAR, chart 1) which drops the 3-month moving average of this measure to 0.25% m/m SA (or 3.1% annualized). The weighted median (5% y/y from 5.2%) and trimmed mean (5.1% from 5.3%) CPI gauges also eased. It’s not wrong to look at these gauges, but doing so gives an incomplete picture of inflation at the margin that is less driven by year-ago base effects and by narrow components.

WHAT MARKETS SHOULD ALSO CONSIDER
The way I look at the figures was less dovish than what markets saw. First off, ignore year-over-year readings as they offering little if anything useful given how influenced they are by year-ago base effects. For instance, a year-ago saw Russia prepare to invade Ukraine and then do so which drove multiple commodity prices higher.
Secondly, trimmed mean and weighted median CPI measures of core inflation held firm at 3.7% m/m SAAR and 3.6% m/m SAAR respectively in January, thereby matching the December readings (chart 2). They are faster readings than in November when they both dipped toward 3%, but not by much and they are still cooler than early last year when the rates were running at double that and more. Nevertheless, such rates of core inflation at the margin are cooler but not cool. We can now calculate these estimates with Statcan providing index levels with the release for the first time.
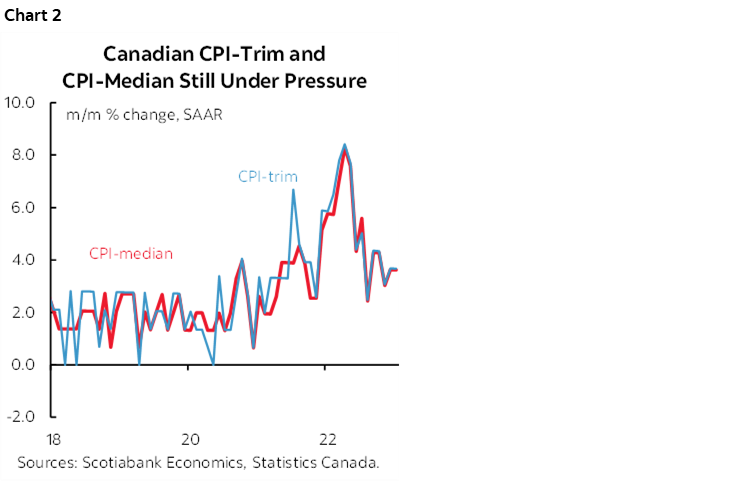
These measures matter because the BoC has placed emphasis upon the higher frequency trimmed mean and weighted median guides to inflation in its MPR. They have indeed cooled from earlier peaks, while nevertheless remaining well above the 2% inflation target.
Why did markets not see this evidence on m/m trimmed mean and weighted median CPI? Because despite the fanfare in advance that was all about publishing monthly index levels and higher frequency gauges of trimmed and median inflation for the first time instead of just year-over-year rates, Statcan omitted the index levels and higher frequency readings from their write-up and tables and financial media outlets simply went with that. Good one! Make a splash, and then promptly forget what you were doing.
Another reason for a less dovish interpretation is that revisions to the BoC’s preferred ‘core’ gauges added a touch more heat to prior months. Weighted median CPI was revised up by two-tenths to 5.2% y/y with trimmed mean CPI unchanged at 5.3% y/y. Prior months were revised up for both measures.
BoC IMPLICATIONS—SCANT TO NONE FOR NOW
Before turning to more details, quite frankly there are no BoC implications stemming from this report in my view. The BoC has made it clear they are on a conditional pause and that evaluating the condition will take more than a lousy 3–4 weeks and one or two inflation reports since they embraced it on January 25th. The March 8th statement should be short and sweet with no policy changes.
The bigger deal involves tracking progress on the drivers of inflation and actual inflation over a lengthier period. So far, there is no real evidence that Canada’s economy is opening up any disinflationary slack; in fact, it continues to look like the opposite case. The 2.9% q/q SAAR gain in hours worked that is tentatively being tracked for Q1 is a strong indication for GDP growth, given that GDP is defined as an identity by multiplying hours worked by labour productivity. If GDP growth continues to exceed estimates of potential GDP growth (the economy’s noninflationary speed limit) then the economy will continue to push further into excess aggregate demand conditions which is hardly compatible with sustainably lower inflation.
This morning’s retail sales volume gain of 1.3% m/m SA in December and the likely volume gain behind the preliminary nominal estimate of 0.7% m/m in January suggest that this part of consumer spending is resilient before even adding in spending on services.
The BoC had forecast 5.4% y/y for headline CPI in 2023Q1. If the rest of the quarter evolves in line with average monthly seasonality and the influences of shifting year-ago base effects then they could be spot-on. We’ll need to see if the rest of the quarter’s inflation data offers any twists beyond these two simple factors.
DETAILS
Services price inflation continues to move sideways at elevated rates in year-over-year terms while goods price inflation continues to ebb mostly due to food and energy (chart 3). Chart 4 shows the same measures in month-over-month seasonally unadjusted terms. Chart 5 shows that services inflation will continue to be partly influenced by wage growth.

The incredible strength of the job market continues to keep the pressure on the BoC’s chief concerns around services inflation, wages and productivity.
Chart 6 shows the breakdown of the month-over-month seasonally unadjusted price changes. Chart 7 does the same thing in weighted contribution terms.
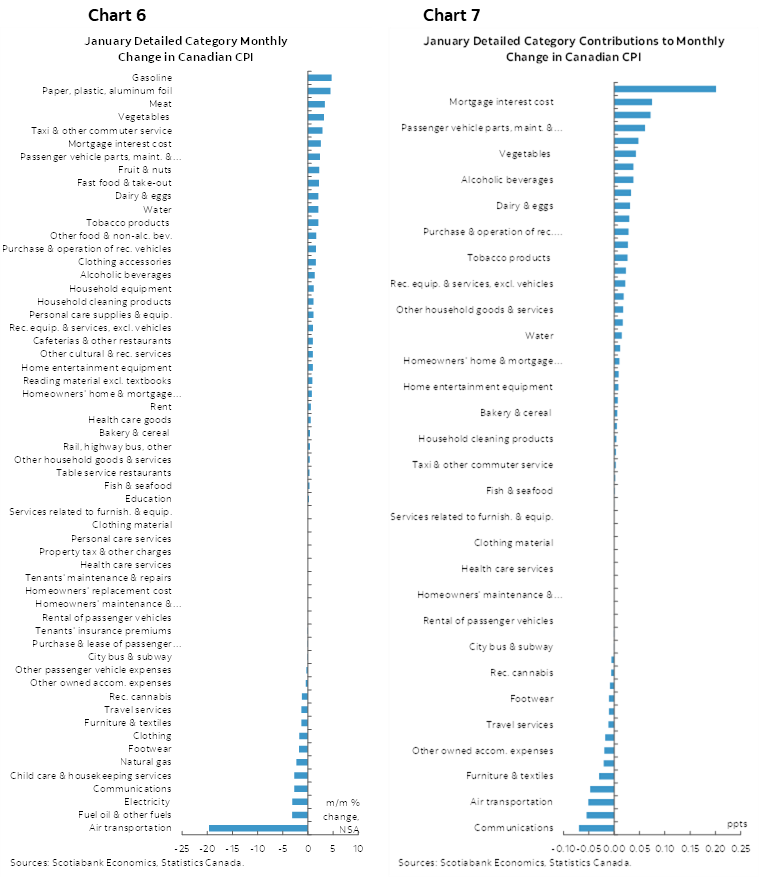
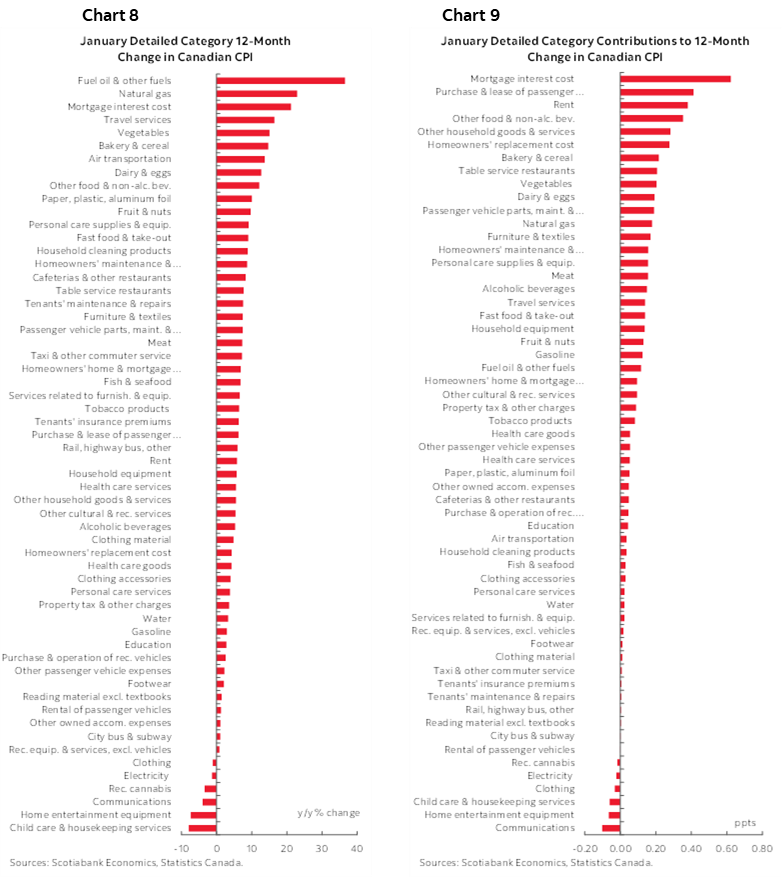
Chart 8 shows the breakdown of the year-over-year price changes. Chart 9 does the same thing in weighted contribution terms.
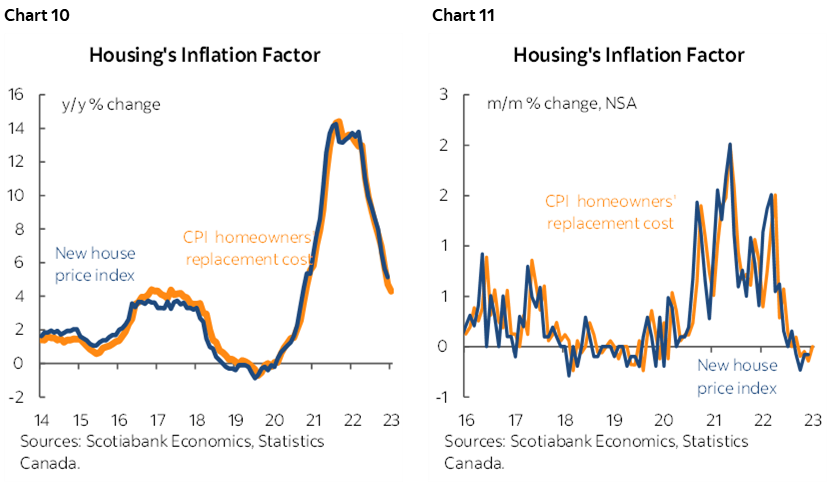
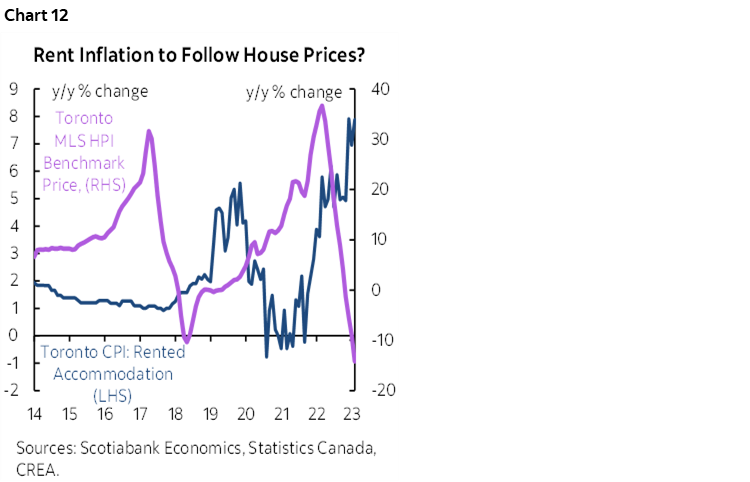
The way housing gets captured in CPI continues to ebb (charts 10, 11). Recall that Canada captures housing using the replacement cost of housing drawn from builder prices and not owners’ equivalent rent as in the US. Canada therefore has a vastly lower weight on housing in CPI.
As house prices continue to ease, rent inflation continues to soar by capturing folks who are hesitant to enter the owner-occupied market (chart 12).
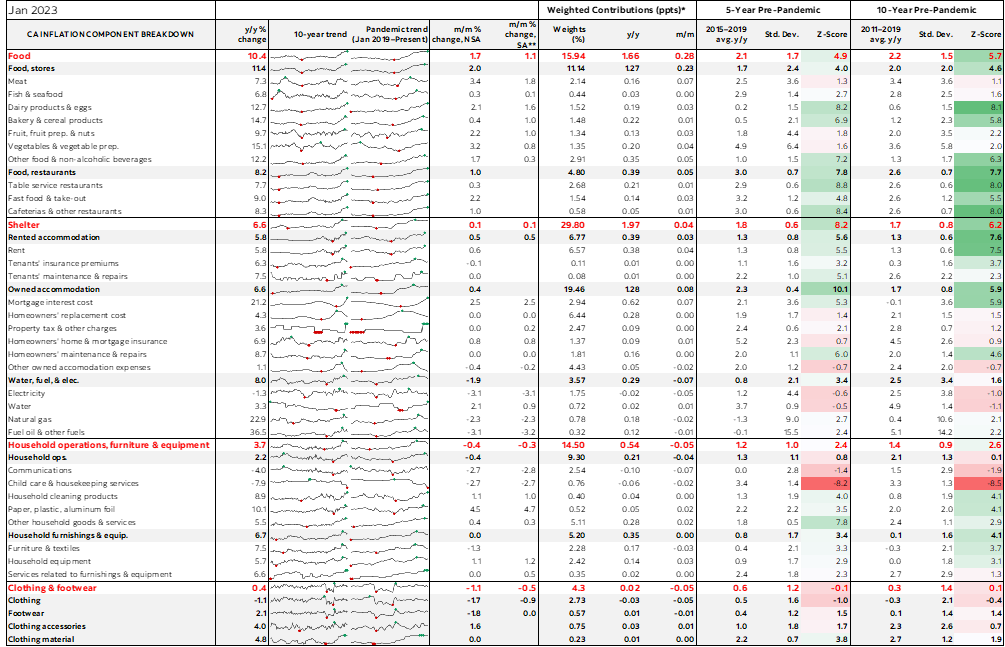
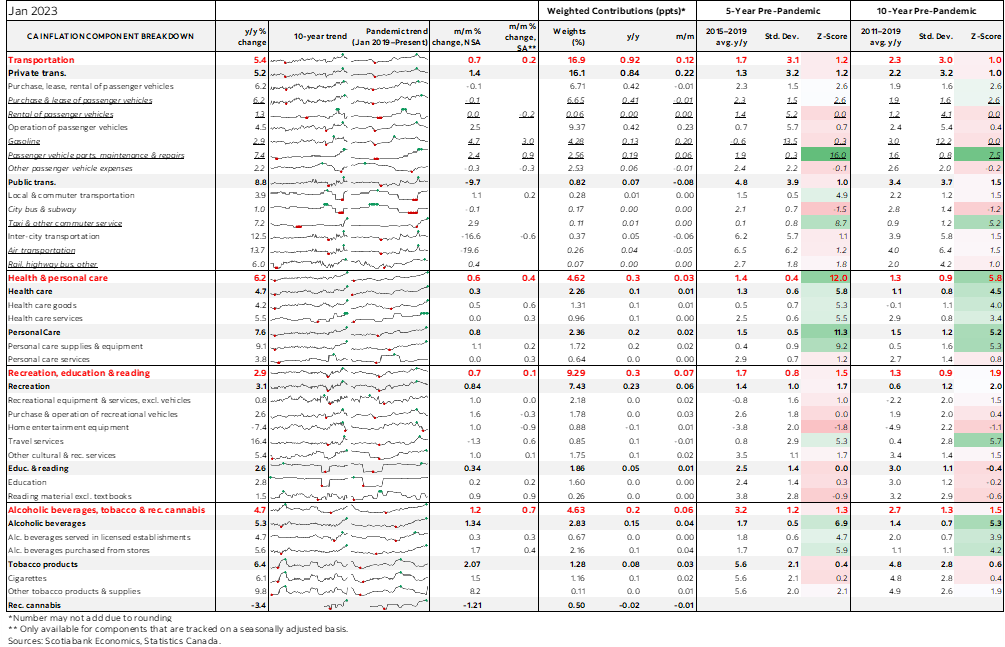
Please also see the attached table with a detailed breakdown of the CPI basket including micro-charts and z-score measures of dispersion between current inflation by component and historical averages.
DISCLAIMER
This report has been prepared by Scotiabank Economics as a resource for the clients of Scotiabank. Opinions, estimates and projections contained herein are our own as of the date hereof and are subject to change without notice. The information and opinions contained herein have been compiled or arrived at from sources believed reliable but no representation or warranty, express or implied, is made as to their accuracy or completeness. Neither Scotiabank nor any of its officers, directors, partners, employees or affiliates accepts any liability whatsoever for any direct or consequential loss arising from any use of this report or its contents.
These reports are provided to you for informational purposes only. This report is not, and is not constructed as, an offer to sell or solicitation of any offer to buy any financial instrument, nor shall this report be construed as an opinion as to whether you should enter into any swap or trading strategy involving a swap or any other transaction. The information contained in this report is not intended to be, and does not constitute, a recommendation of a swap or trading strategy involving a swap within the meaning of U.S. Commodity Futures Trading Commission Regulation 23.434 and Appendix A thereto. This material is not intended to be individually tailored to your needs or characteristics and should not be viewed as a “call to action” or suggestion that you enter into a swap or trading strategy involving a swap or any other transaction. Scotiabank may engage in transactions in a manner inconsistent with the views discussed this report and may have positions, or be in the process of acquiring or disposing of positions, referred to in this report.
Scotiabank, its affiliates and any of their respective officers, directors and employees may from time to time take positions in currencies, act as managers, co-managers or underwriters of a public offering or act as principals or agents, deal in, own or act as market makers or advisors, brokers or commercial and/or investment bankers in relation to securities or related derivatives. As a result of these actions, Scotiabank may receive remuneration. All Scotiabank products and services are subject to the terms of applicable agreements and local regulations. Officers, directors and employees of Scotiabank and its affiliates may serve as directors of corporations.
Any securities discussed in this report may not be suitable for all investors. Scotiabank recommends that investors independently evaluate any issuer and security discussed in this report, and consult with any advisors they deem necessary prior to making any investment.
This report and all information, opinions and conclusions contained in it are protected by copyright. This information may not be reproduced without the prior express written consent of Scotiabank.
™ Trademark of The Bank of Nova Scotia. Used under license, where applicable.
Scotiabank, together with “Global Banking and Markets”, is a marketing name for the global corporate and investment banking and capital markets businesses of The Bank of Nova Scotia and certain of its affiliates in the countries where they operate, including; Scotiabank Europe plc; Scotiabank (Ireland) Designated Activity Company; Scotiabank Inverlat S.A., Institución de Banca Múltiple, Grupo Financiero Scotiabank Inverlat, Scotia Inverlat Casa de Bolsa, S.A. de C.V., Grupo Financiero Scotiabank Inverlat, Scotia Inverlat Derivados S.A. de C.V. – all members of the Scotiabank group and authorized users of the Scotiabank mark. The Bank of Nova Scotia is incorporated in Canada with limited liability and is authorised and regulated by the Office of the Superintendent of Financial Institutions Canada. The Bank of Nova Scotia is authorized by the UK Prudential Regulation Authority and is subject to regulation by the UK Financial Conduct Authority and limited regulation by the UK Prudential Regulation Authority. Details about the extent of The Bank of Nova Scotia's regulation by the UK Prudential Regulation Authority are available from us on request. Scotiabank Europe plc is authorized by the UK Prudential Regulation Authority and regulated by the UK Financial Conduct Authority and the UK Prudential Regulation Authority.
Scotiabank Inverlat, S.A., Scotia Inverlat Casa de Bolsa, S.A. de C.V, Grupo Financiero Scotiabank Inverlat, and Scotia Inverlat Derivados, S.A. de C.V., are each authorized and regulated by the Mexican financial authorities.
Not all products and services are offered in all jurisdictions. Services described are available in jurisdictions where permitted by law.