- All 3 core inflation gauges accelerated…
- ...with still high breadth....
- …and remain far above the BoC’s 2% target
- Markets increased BoC hike pricing
- Why the BoC shouldn’t gamble on lagging effects…
- …and should keep on hiking...
- ...partly as unit labour costs are reminiscent of the Crow years
- Canadian CPI, m/m % // y/y %, seasonally unadjusted, July:
- Actual: 0.6 / 3.3
- Scotia: 0.3 / 3.0
- Consensus: 0.3 / 3.0
- Prior: 0.1 / 2.8
- Canadian core inflation, m/m SAAR % // y/y %, July:
- Trimmed mean: 4.2 / 3.6
- Weighted median: 4.2 / 3.7
- CPI ex-f&e: 4.2 / 3.4
Canadian inflation soared past estimates for the month of July. When combined with robust wage data and moribund productivity that add second-round drivers to inflation risk plus other reasons to expect inflation risk to remain pointed higher the outcome is such that the BoC needs to continue to raise its policy rate in my opinion. High for longer won’t cut it in a race against time through wage-setting exercises as inflation expectations remain above the BoC’s target. I’m of the ongoing view that politics and pressures aside, it needs to crush inflation risk and remain adherent to its principal mandate. It is at high risk to losing the fight.
MARKET REACTION & THE BOC
Canada’s two-year sovereign yield increased by about 4bps post data with a strong beat on US retail sales reinforcing the reaction to CPI. This initial reaction has been tempered with the 2-year yield still up by a cumulative 4bps on the day and 7bps relative to US 2s. The Canadian dollar initially appreciated by about a quarter-cent to the USD but is now back to where it was and holding firm to the dollar. Markets increased the probability of another hike by the BoC at its September 6th decision without making it a base case, but the volatile contracts are strongly leaning toward another quarter point hike over coming meetings. I would prefer that they front-load it by going in September. Additional data risk such as GDP on September 1st and other global developments may further inform policy risk.
DETAILS
All three core inflation measures accelerated in July. Misleading headlines point to a slight softening in year-over-year core inflation gauges and miss the point regarding the evidence on inflation at the margin particularly as the BoC for some time now has pivoted toward embracing the higher frequency trend gauges I’ve been emphasizing throughout the pandemic era.
Each of traditional core CPI (ex-food and energy), trimmed mean CPI and weighted median CPI were up by 4.2% m/m at a seasonally adjusted and annualized rate (SAAR) in July (chart 1). That’s up from the prior month’s average and so core inflationary pressures accelerated. The BoC targets 2% headline inflation over the medium-term but uses the core gauges as the operational guide toward achieving the headline target that can be distorted by a minority of drivers.
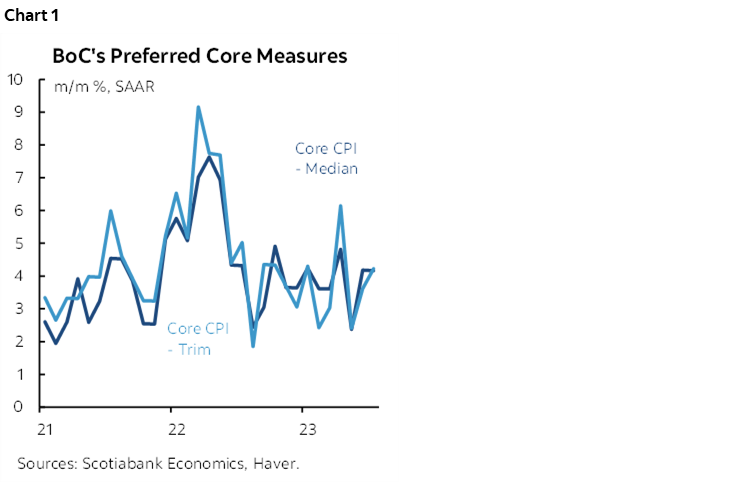
The 3-month moving average for trimmed mean and weighted median that incorporates revisions to both is running at about 3½% m/m SAAR, indicating high persistence of underlying inflationary pressures.
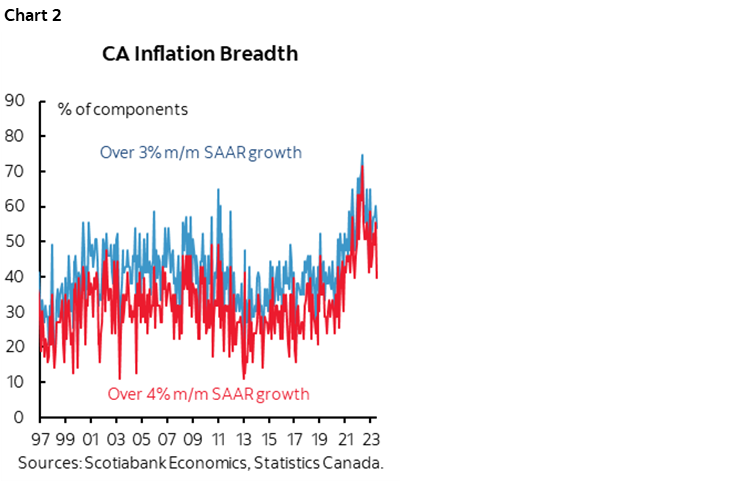
The breadth of price increases remains high. Chart 2 shows the fraction of the basket posting month-over-month seasonally adjusted and annualized gains of over 3% (54%) and over 4% (40%). There is less breadth of price pressures than previously but it is still unacceptably high.
Services inflation is being closely monitored by the BoC as it dominates the CPI basket and it sharply accelerated last month (chart 3). Core goods inflation decelerated and remains volatile (chart 4).
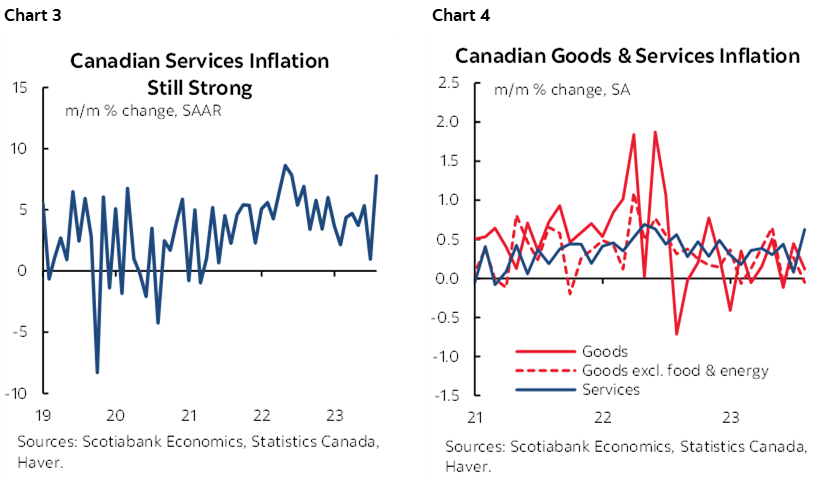
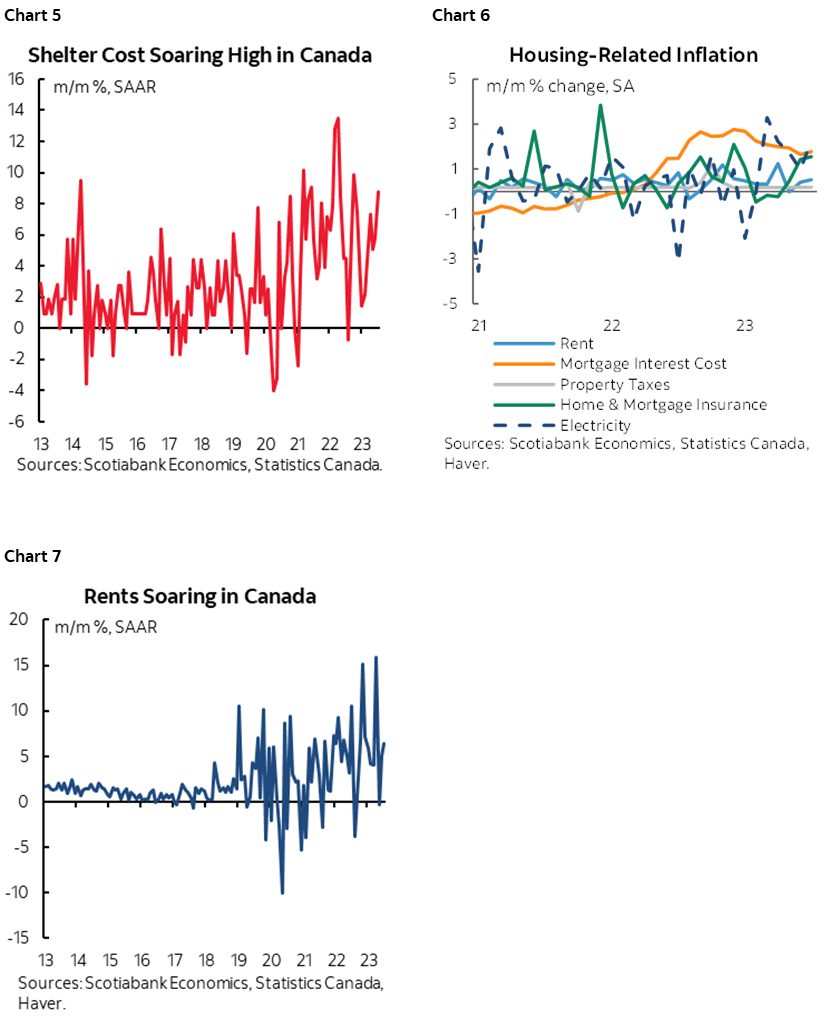
There was significant breadth to the jump in services inflation last month. Shelter was up 0.7% m/m SA nonannualized with gains led by rent, insurance premiums and electricity (charts 5,6 ,7). Alas, no one will win a Nobel Prize in Economics for observing that when you add a massive surge of immigration into a market with no supply, rents and house prices will push higher. Welcome to Duhonomics! The argument that immigration could invoke balanced effects on demand and supply side pressures on inflation that cancel each other out was never sensible and we’re getting the kind of persistent housing inflation I’ve warned about since last year when immigration numbers were skyrocketing.
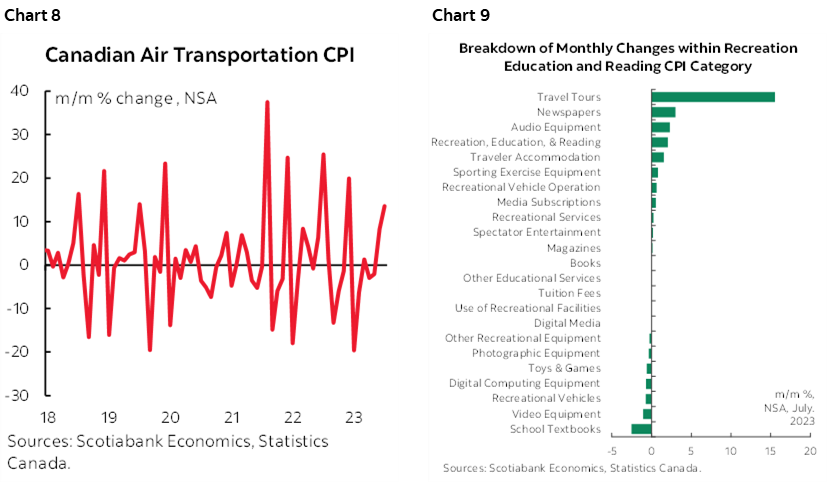
It wasn’t just shelter, however, as other service categories also jumped. Airfare jumped (chart 8). So did the recreation/education/reading category that was led by a strong increase in prices for packaged travel tours (chart 9). Bus/subway fares jumped 4.2% m/m higher. Immigration may be adding to domestic strains and pricing power in these sectors. Health care was up 0.3% and auto insurance increased by 0.5%. More drivers, more folks in the health care system.
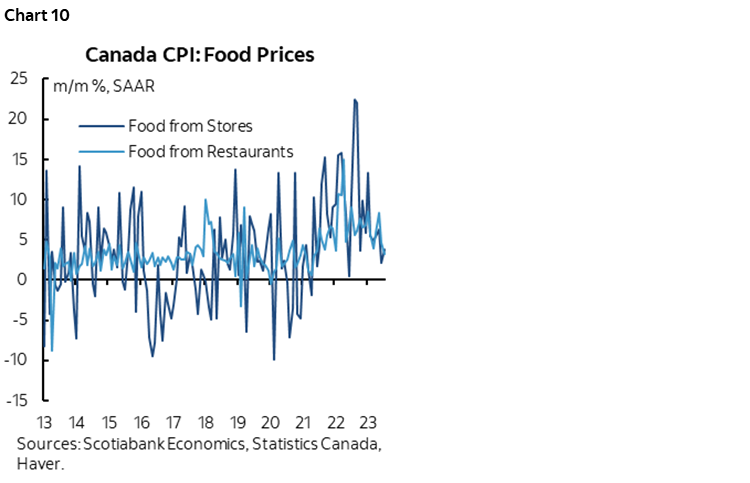
Food price inflation is persistent but trending lower both in terms of food bought at stores and from restaurants (chart 10).
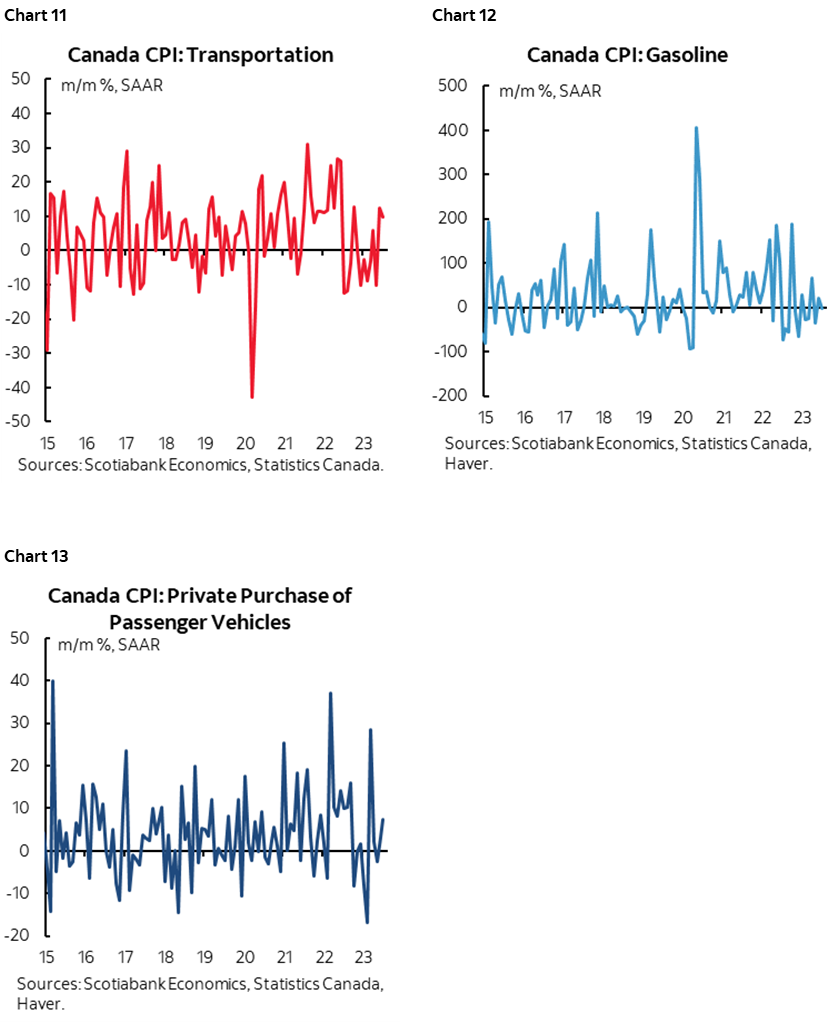
Overall transportation price inflation accelerated (chart 11). Gasoline prices were an irrelevant factor (chart 12). Vehicle prices picked up amid considerable persistence of pricing power (chart 13).
WHAT ABOUT THE LAGS?
I continue to think it’s a falsehood to state that the BoC should wait out the uncertain lagging effects of policy adjustments on inflation and the broader economy. There are three reasons for this.
1. The policy lags need to start when markets began pricing higher rates in the Fall of 2021 and when QE began to be shut down before that and not when the policy rate started to increase in March 2022. We’re almost two years into the tightening of market-based funding costs and should be seeing more evidence of damage now. The fact that we are not indicates that policy isn’t as tight as sometimes argued.
2. Second, there are mitigating effects on the rate hike cycle that are offsetting and that indicate policy needs to tighten further. The terms of trade, ongoing fiscal stimulus, poorly executed immigration policy, improving supply chains into a tightening cycle, strong corporate finances including high interest coverage and strengths in household finances for the majority of households in Canada are just a few such arguments.
3. The BoC is in a fight against time. It can’t afford to wait out the policy lags that may or may not do their work for them. We see that in the rush to secure high wage gains for years across the one-third of the economy that is unionized and going through collective bargaining exercises. This is going on across multiple markets but it’s arguably worse in Canada. I don’t fault them for seeking higher wages given all of the pressures upon household finances. I’m also, however, totally aware of the strong risk that second-round pressures on inflation will emanate from higher wage gains relative to poor labour productivity defined as the pandemic-era’s trend in output per hour worked. The combination is driving unit labour costs skyward and someone will pay for that, including consumers. If the BoC does not jolt such developments to a substantially greater degree then it risks losing control of wage- and expectations-setting exercises and never getting inflation durably down to its target.
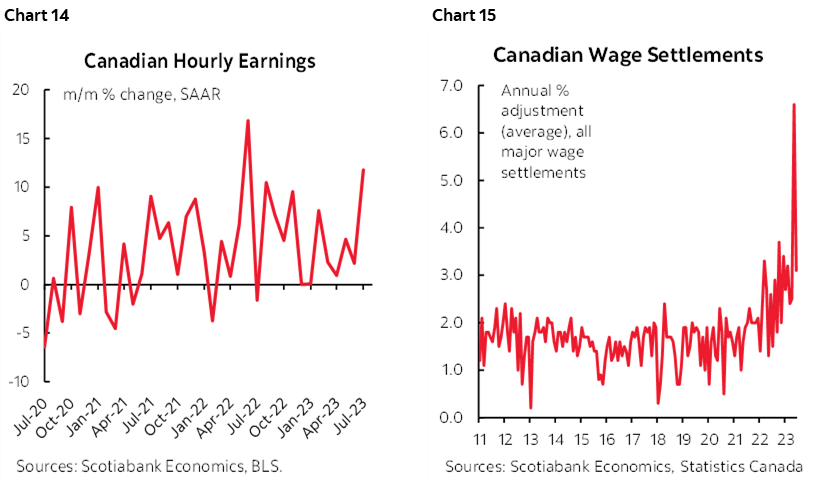
Now, there are those who will argue that wages don’t necessarily beget inflation and they point to mixed historical evidence. That historical dataset, however, is dominated by years and years of soft wage gains and certain related socioeconomic challenges. Today’s experiences are out of sample on three counts. One is the accelerating pace of wage gains with further gains ahead as recent agreements filter through and other sectors face high strike risk (eg. autos, Ontario teachers etc). Charts 14, 15.
Two is previously cited evidence from IMF research that countries with high unionization rates and beyond full employment conditions face the greatest risk of wage spillover effects from collective bargaining agreements into other parts of the labour market; Canada ticks the boxes on both of those criteria.
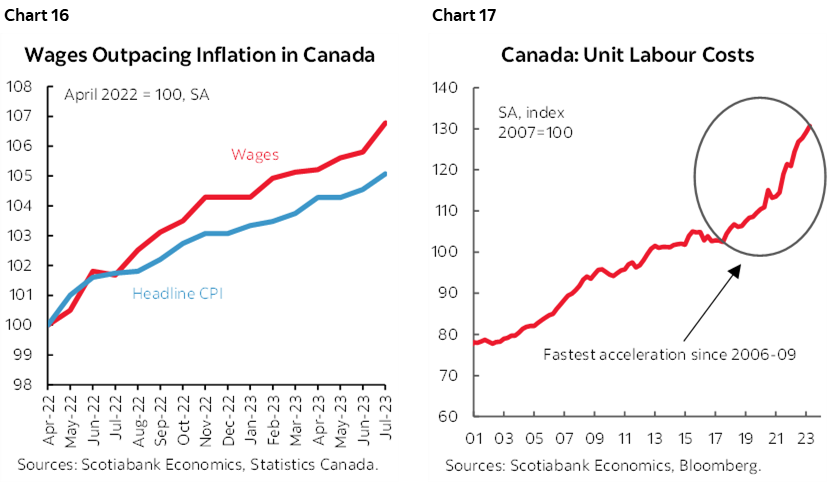
Third is that wage gains are exceeding inflation and outpacing moribund productivity growth by widening margins (charts 16, 17). The surge in unit labour costs (employment costs adjusted for productivity) is sharply out of sample. The last time we saw unit labour costs get so far out of hand as now was in the late 1980s. John Crow had to clean up the mess and we know how that ended.
If the BoC waits for the lagged effects, then it faces the high risk of losing as wages and expectations get out of hand.
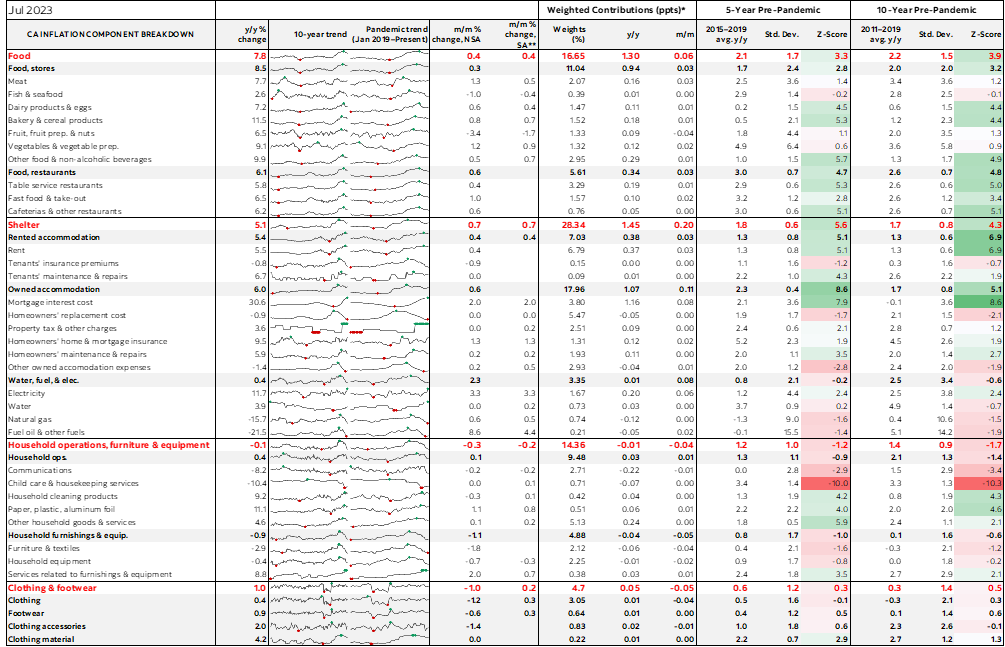
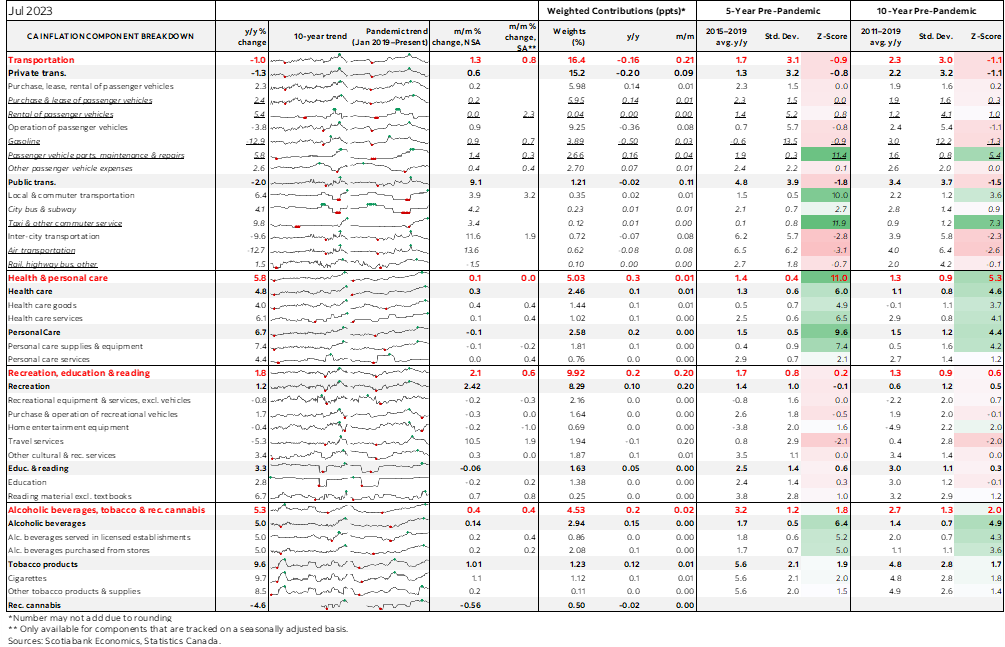
Charts 18–21 break down the price changes by component of the CPI basket in raw terms and after weighting their relative contributions to overall inflation in m/m and y/y terms.
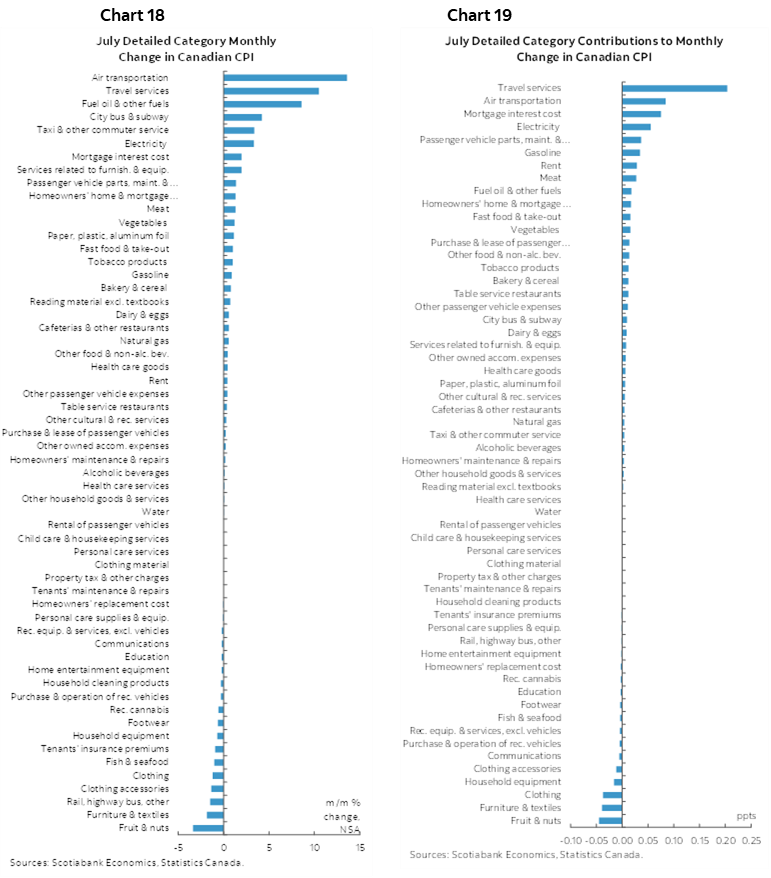
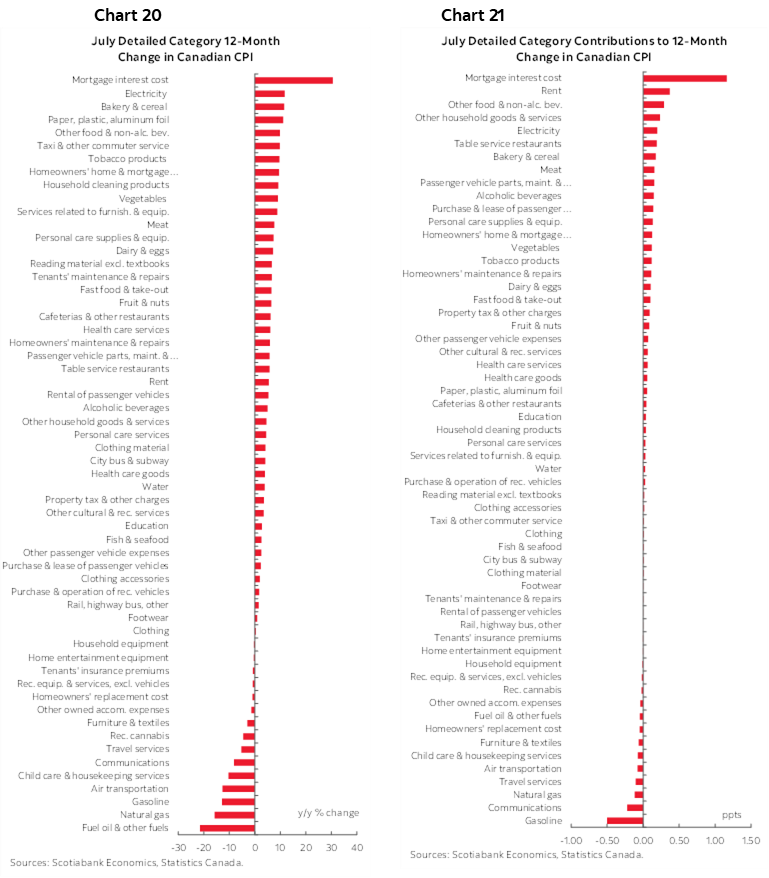
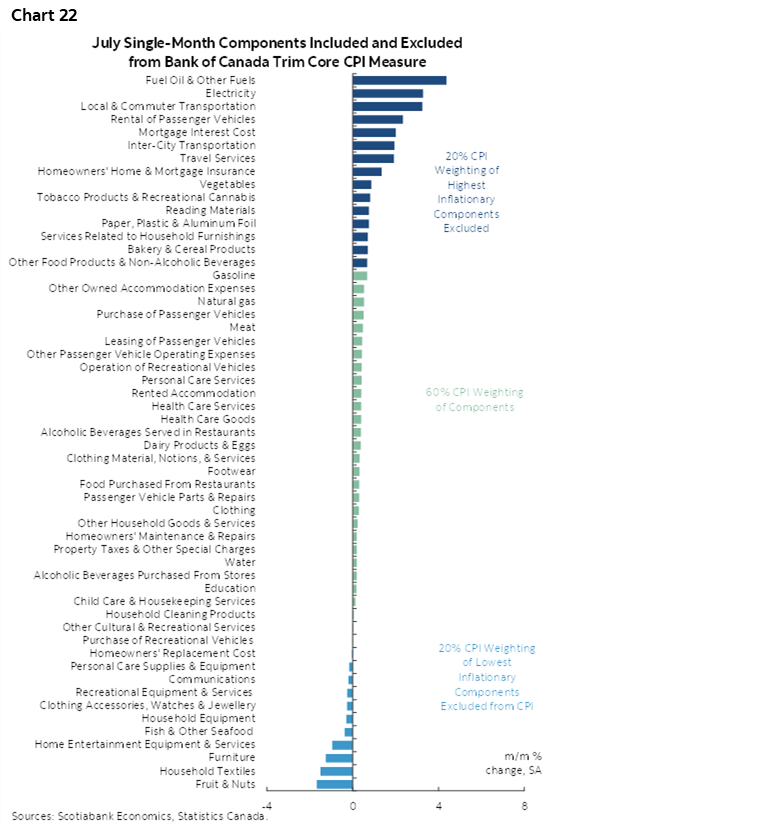
Chart 22 breaks down what’s in and what’s out of the trimmed mean CPI basket.
Please also see the table in the appendix for more details including micro charts and z-score measures of inflation relative to history.
DISCLAIMER
This report has been prepared by Scotiabank Economics as a resource for the clients of Scotiabank. Opinions, estimates and projections contained herein are our own as of the date hereof and are subject to change without notice. The information and opinions contained herein have been compiled or arrived at from sources believed reliable but no representation or warranty, express or implied, is made as to their accuracy or completeness. Neither Scotiabank nor any of its officers, directors, partners, employees or affiliates accepts any liability whatsoever for any direct or consequential loss arising from any use of this report or its contents.
These reports are provided to you for informational purposes only. This report is not, and is not constructed as, an offer to sell or solicitation of any offer to buy any financial instrument, nor shall this report be construed as an opinion as to whether you should enter into any swap or trading strategy involving a swap or any other transaction. The information contained in this report is not intended to be, and does not constitute, a recommendation of a swap or trading strategy involving a swap within the meaning of U.S. Commodity Futures Trading Commission Regulation 23.434 and Appendix A thereto. This material is not intended to be individually tailored to your needs or characteristics and should not be viewed as a “call to action” or suggestion that you enter into a swap or trading strategy involving a swap or any other transaction. Scotiabank may engage in transactions in a manner inconsistent with the views discussed this report and may have positions, or be in the process of acquiring or disposing of positions, referred to in this report.
Scotiabank, its affiliates and any of their respective officers, directors and employees may from time to time take positions in currencies, act as managers, co-managers or underwriters of a public offering or act as principals or agents, deal in, own or act as market makers or advisors, brokers or commercial and/or investment bankers in relation to securities or related derivatives. As a result of these actions, Scotiabank may receive remuneration. All Scotiabank products and services are subject to the terms of applicable agreements and local regulations. Officers, directors and employees of Scotiabank and its affiliates may serve as directors of corporations.
Any securities discussed in this report may not be suitable for all investors. Scotiabank recommends that investors independently evaluate any issuer and security discussed in this report, and consult with any advisors they deem necessary prior to making any investment.
This report and all information, opinions and conclusions contained in it are protected by copyright. This information may not be reproduced without the prior express written consent of Scotiabank.
™ Trademark of The Bank of Nova Scotia. Used under license, where applicable.
Scotiabank, together with “Global Banking and Markets”, is a marketing name for the global corporate and investment banking and capital markets businesses of The Bank of Nova Scotia and certain of its affiliates in the countries where they operate, including; Scotiabank Europe plc; Scotiabank (Ireland) Designated Activity Company; Scotiabank Inverlat S.A., Institución de Banca Múltiple, Grupo Financiero Scotiabank Inverlat, Scotia Inverlat Casa de Bolsa, S.A. de C.V., Grupo Financiero Scotiabank Inverlat, Scotia Inverlat Derivados S.A. de C.V. – all members of the Scotiabank group and authorized users of the Scotiabank mark. The Bank of Nova Scotia is incorporated in Canada with limited liability and is authorised and regulated by the Office of the Superintendent of Financial Institutions Canada. The Bank of Nova Scotia is authorized by the UK Prudential Regulation Authority and is subject to regulation by the UK Financial Conduct Authority and limited regulation by the UK Prudential Regulation Authority. Details about the extent of The Bank of Nova Scotia's regulation by the UK Prudential Regulation Authority are available from us on request. Scotiabank Europe plc is authorized by the UK Prudential Regulation Authority and regulated by the UK Financial Conduct Authority and the UK Prudential Regulation Authority.
Scotiabank Inverlat, S.A., Scotia Inverlat Casa de Bolsa, S.A. de C.V, Grupo Financiero Scotiabank Inverlat, and Scotia Inverlat Derivados, S.A. de C.V., are each authorized and regulated by the Mexican financial authorities.
Not all products and services are offered in all jurisdictions. Services described are available in jurisdictions where permitted by law.