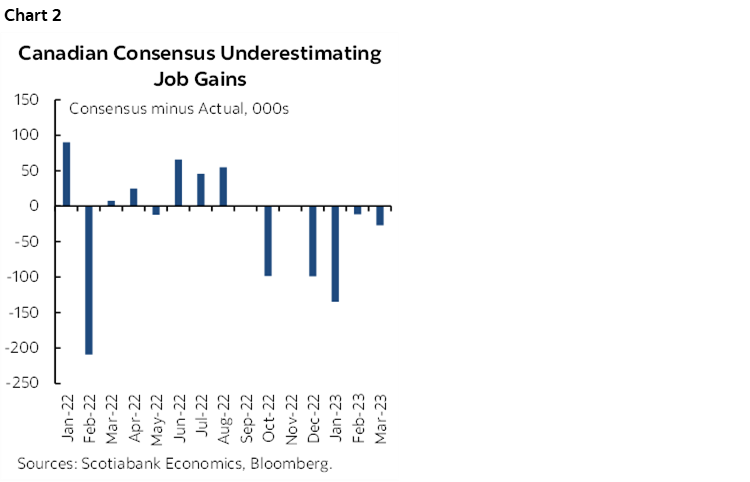
- Job growth has beaten consensus expectations for six months
- Against downside risks to employment...
- ...are drivers that are idiosyncratic to this cycle
- Hours worked reinforce expectations for strong Q1 GDP
- The BoC is not seeing the emergence of disinflationary spare capacity...
- ...which counsels against market pricing for rate cuts
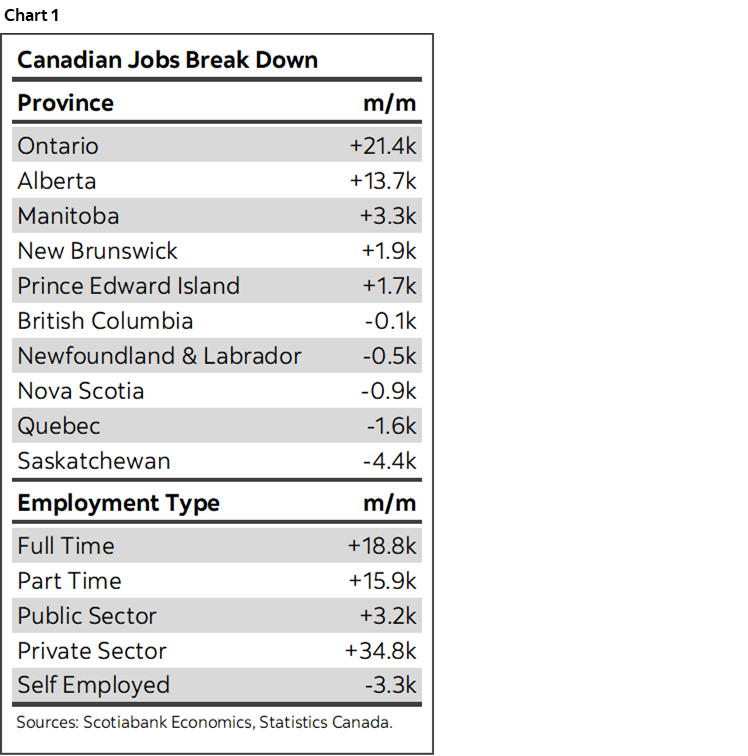
- Canadian Jobs m/m 000s SA / UR (%), SA, March:
- Actual: 34.7 / 5.0
- Scotia: 40 / 4.9
- Consensus: 7.5 / 5.1
- Prior: 21.8 / 5.0
Canada’s jobs juggernaut continues to roll onward with convincing momentum. There are definitely forward-looking risks to the outlook, but at least so far the Canadian job market and the Canadian economy remain highly resilient. This continues to counsel against expecting rate cuts anytime soon.
The table above plus chart 1 provide some high level summary statistics. Chart 2 shows that the pattern of consensus being too negative on job growth continues to persist throughout the past six months.
Why is this happening? And could strong hiring continue? I’ll repeat past arguments about the risks and ones that speak to why we need to be more open-minded toward the state of the Canadian job market in this hike cycle.
First is the case for downside risks to jobs that is primarily based upon three things:
- A common argument is that it’s early to evaluate rate hike effects since the BoC only began to hike in March of last year. That may be true but it is understating the period of higher borrowing costs and hence perhaps overstating the argument that it’s too early to expect weaker employment. The market started to put material upward pressure on the two-year GoC bond yield in October of 2021 in anticipation of BoC tightening. The five-year bond yield—a key driver of the popular five-year fixed mortgage rate—started to go up in March of 2021. Ergo, higher rates have been with us for at least a year-and-a-half and still no job losses. In fact, job gains have actually accelerated since October of last year.
- Another downside risk is Quantitative Tightening. The partial purpose of this is to reduce reserves that support lending by deposit-taking institutions across the US, Europe and Canada. The lagging effects of higher market-driven borrowing costs and a tightening global lending cycle probably still lie ahead to an uncertain degree.
- A third one is that government stimulus super accelerated earlier in the pandemic but has since stabilized in Canada. Spending is still far higher than pre-pandemic levels and incremental spending keeps getting added, but the rate of change has slowed and with that so may employment gains eventually.
What makes this cycle different as potential risk mitigants to the prior three points that could support job markets to a better degree than feared?
- Jobs don’t always crater when rates go up. Circumstances that are unique to each cycle have to be evaluated independently and I’ll do that in a moment. Before doing so, however, note that jobs did not decline when the BoC hiked by 125bps over late 2017–2018. Jobs didn’t fall until the pandemic hit. Clearly that was a much weaker hike cycle than today’s in nominal terms, but the real policy rate changes now versus back then offer a much more subdued picture toward the magnitude of policy tightening than just comparing changes in nominal rates this tightening cycle versus the prior cycle. Further, the next points illustrate that other things are also different this time around as potential offsets to at least some of the effects of more policy tightening.
- We’ve never had improving supply chains into a tightening cycle like we have had in Canada now. This gives the ability to produce more for clients who still have demand. To produce more at capacity constraints in the Canadian economy means sourcing more inputs. It’s possible that employers are more comfortable sourcing more labour than investing since it means more variable costs they can reduce if conditions sour, rather than fixed depreciation and interest charges. That supports labour.
- Canadian labour productivity blows. Sorry, but call it what it is. To get the same output from hiring 1 person in 2019 might require, say, hiring two today. Output per hour worked of the typical employee in Canada has suffered throughout the pandemic to among the worst extents internationally.
- Canada is benefiting from a surge of immigration to help fill these vacancies. We haven’t seen this effect in past tightening cycles and certainly not to this magnitude. This form of stimulus to the job market will also be stimulus to housing and related sectors.
- Public sector employment is holding firm at 430,000 more jobs than back in February 2020 after which the pandemic struck. About 183,000 of those added public sector workers have been civil servants. Very heavy government spending has buoyed this category that has accounted for about one out of every two jobs created in Canada since the pandemic struck. That’s not necessarily a plus in my view and given the next point.
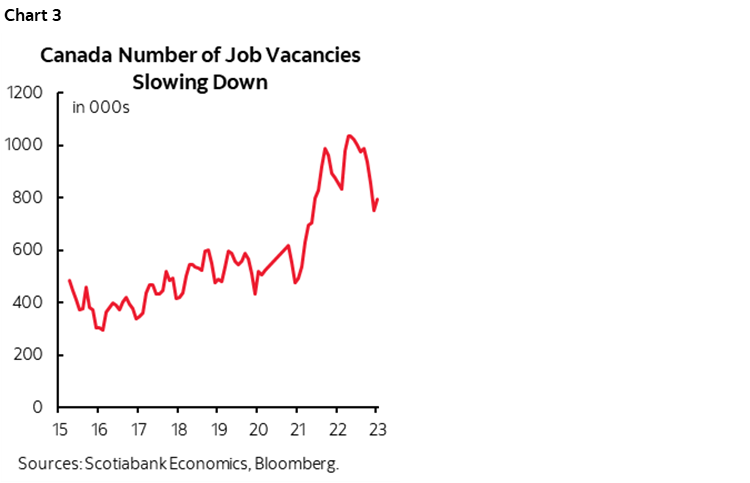
- There are still high vacancies in Canada’s job market. They have been declining for much of the past year, but they are still running at about 800k (chart 3). Companies previously struggled to find workers particularly in the private services sector while the goods sectors and governments were absorbing them and thereby crowding out activities at private service sector employers. This is changing in favour of private service sector employers that are finally able to fill vacancies and there could be 200–300k more vacancies to fill before we get back to ‘normal’ levels from before the pandemic. This is the rotation argument. This is an important point in that government spending that has bloated public sector payrolls has crowded out private sector hiring and constrained the ability to produce more at the affected companies in classic textbook fashion.
BoC IMPLICATIONS
These numbers should have minimal effect on what the Bank of Canada presents to us next Wednesday. The labour market remains resilient and the details reinforce expectations for much stronger GDP growth in Q1 than the BoC had forecast. A fly in the ointment was that wage growth cooled again but overall the numbers support a continuation of the conditional pause.
DETAILS
Jobs were up by 35k when almost half of consensus thought they would decline.
Services led the way with a gain of 76k while goods sector jobs fell by about 41k. Within goods, the drop was mostly in construction (-19k) and natural resources (-11k). A breakdown is offered in chart 4.
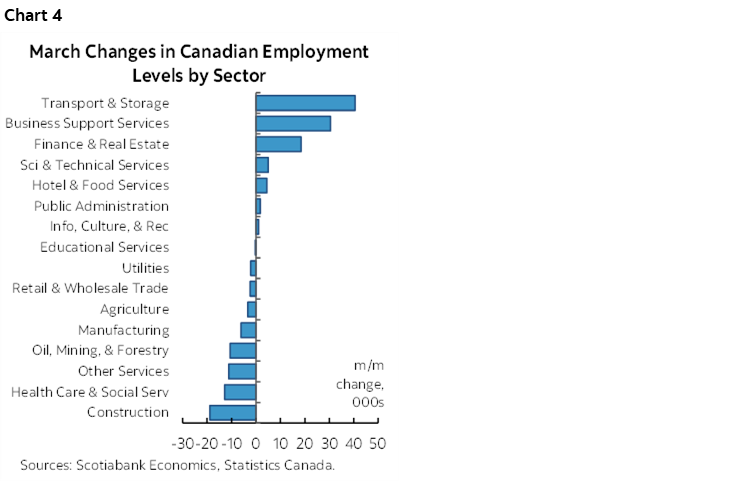
Within services, the gain was mostly in transportation and warehousing (41k), business, building and other support services (31k) and the Finance, Insurance and Real Estate/leasing sector (+19k). There was a smaller assist from the combined accommodation and food services plus info/culture/recreation proxies for vacation and leisure activities (+5.6k).
The unemployment rate held unchanged at 5% for a fourth straight month and this time that was because the rise in the labour force (+21k) was enough to neutralize most of the 35k rise in employment.
Hours worked are on a tear and that’s a good sign for GDP (chart 5). Hours were up by 5% q/q at a seasonally adjusted and annualized rate in Q1. Since GDP is an identity defined as hours times labour productivity with the latter defined as output per hour worked this says that GDP probably grew strongly barring a collapse in productivity. That folks were actually doing something with all those extra hours being piled on is indicated by activity readings we have for January and February.
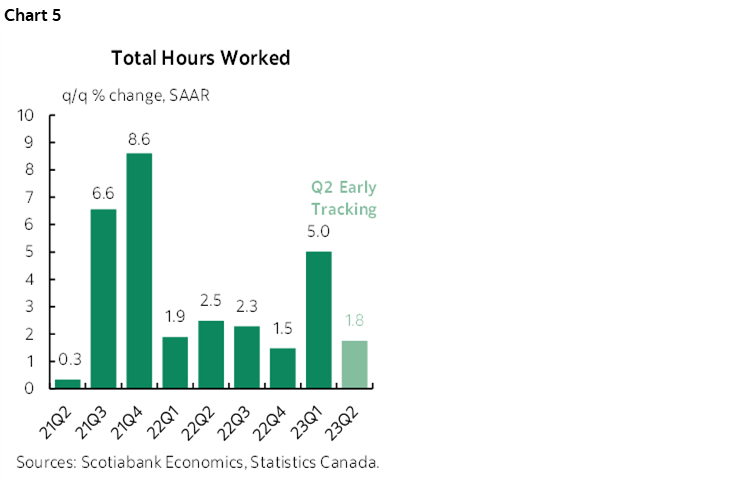
All totalled we’re likely looking at GDP growth of at least 3–4% q/q SAAR in Q1. The BoC had forecast growth of just 0.5% q/q annualized in Q1. It is looking at having to deliver a major upward forecast revision for near-term GDP growth. That will frustrate its hopes that disinflationary spare capacity may be emerging in the Canadian economy.
GDP might carry some momentum into Q2 as well. The way Q1 ended relative to the Q1 average for hours worked points to 1.8% q/q SAAR growth in hours baked in for Q2 before we even get any Q2 data.
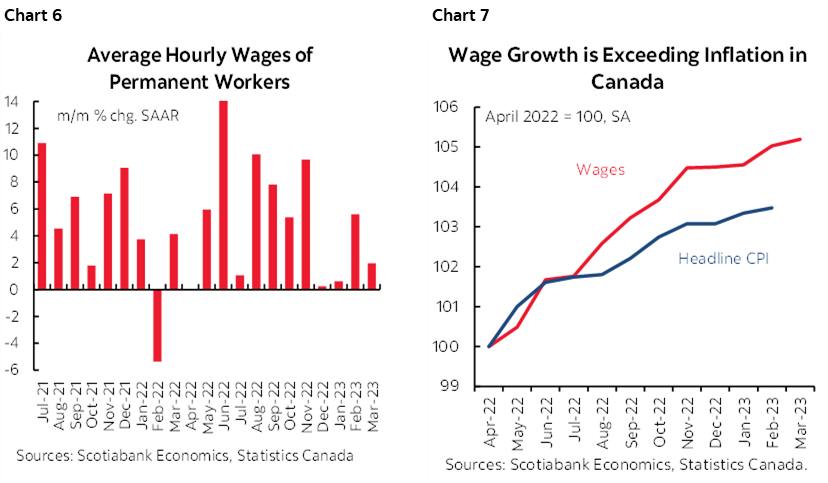
Finally, wages were the previously noted fly in the ointment. Month-over-month wage growth eased to about 2% in seasonally adjusted and annualized terms from almost 6% the prior month (chart 6). That’s still not bad, but is well off the pace that occurred through much of last year. Still, real wages are climbing (chart 7) and with more gains likely ahead.
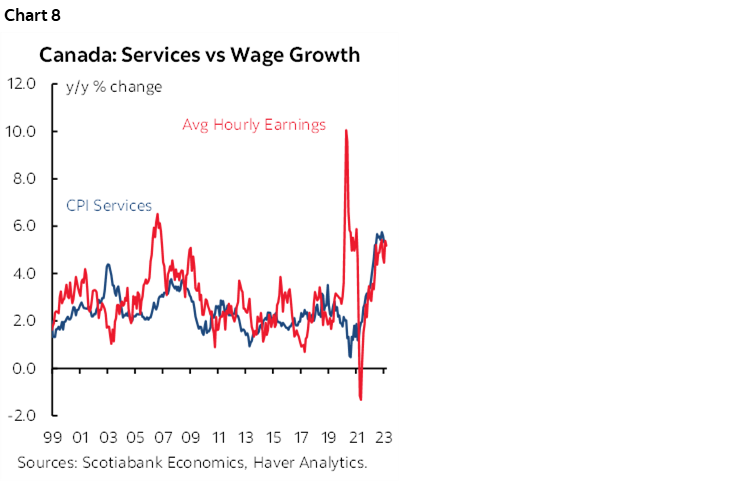
Any real wage gain in the context of awful labour productivity trends presents inflation risk in what remains a super-tight labour market. The connection to services inflation continues to require monitoring (chart 8).
DISCLAIMER
This report has been prepared by Scotiabank Economics as a resource for the clients of Scotiabank. Opinions, estimates and projections contained herein are our own as of the date hereof and are subject to change without notice. The information and opinions contained herein have been compiled or arrived at from sources believed reliable but no representation or warranty, express or implied, is made as to their accuracy or completeness. Neither Scotiabank nor any of its officers, directors, partners, employees or affiliates accepts any liability whatsoever for any direct or consequential loss arising from any use of this report or its contents.
These reports are provided to you for informational purposes only. This report is not, and is not constructed as, an offer to sell or solicitation of any offer to buy any financial instrument, nor shall this report be construed as an opinion as to whether you should enter into any swap or trading strategy involving a swap or any other transaction. The information contained in this report is not intended to be, and does not constitute, a recommendation of a swap or trading strategy involving a swap within the meaning of U.S. Commodity Futures Trading Commission Regulation 23.434 and Appendix A thereto. This material is not intended to be individually tailored to your needs or characteristics and should not be viewed as a “call to action” or suggestion that you enter into a swap or trading strategy involving a swap or any other transaction. Scotiabank may engage in transactions in a manner inconsistent with the views discussed this report and may have positions, or be in the process of acquiring or disposing of positions, referred to in this report.
Scotiabank, its affiliates and any of their respective officers, directors and employees may from time to time take positions in currencies, act as managers, co-managers or underwriters of a public offering or act as principals or agents, deal in, own or act as market makers or advisors, brokers or commercial and/or investment bankers in relation to securities or related derivatives. As a result of these actions, Scotiabank may receive remuneration. All Scotiabank products and services are subject to the terms of applicable agreements and local regulations. Officers, directors and employees of Scotiabank and its affiliates may serve as directors of corporations.
Any securities discussed in this report may not be suitable for all investors. Scotiabank recommends that investors independently evaluate any issuer and security discussed in this report, and consult with any advisors they deem necessary prior to making any investment.
This report and all information, opinions and conclusions contained in it are protected by copyright. This information may not be reproduced without the prior express written consent of Scotiabank.
™ Trademark of The Bank of Nova Scotia. Used under license, where applicable.
Scotiabank, together with “Global Banking and Markets”, is a marketing name for the global corporate and investment banking and capital markets businesses of The Bank of Nova Scotia and certain of its affiliates in the countries where they operate, including; Scotiabank Europe plc; Scotiabank (Ireland) Designated Activity Company; Scotiabank Inverlat S.A., Institución de Banca Múltiple, Grupo Financiero Scotiabank Inverlat, Scotia Inverlat Casa de Bolsa, S.A. de C.V., Grupo Financiero Scotiabank Inverlat, Scotia Inverlat Derivados S.A. de C.V. – all members of the Scotiabank group and authorized users of the Scotiabank mark. The Bank of Nova Scotia is incorporated in Canada with limited liability and is authorised and regulated by the Office of the Superintendent of Financial Institutions Canada. The Bank of Nova Scotia is authorized by the UK Prudential Regulation Authority and is subject to regulation by the UK Financial Conduct Authority and limited regulation by the UK Prudential Regulation Authority. Details about the extent of The Bank of Nova Scotia's regulation by the UK Prudential Regulation Authority are available from us on request. Scotiabank Europe plc is authorized by the UK Prudential Regulation Authority and regulated by the UK Financial Conduct Authority and the UK Prudential Regulation Authority.
Scotiabank Inverlat, S.A., Scotia Inverlat Casa de Bolsa, S.A. de C.V, Grupo Financiero Scotiabank Inverlat, and Scotia Inverlat Derivados, S.A. de C.V., are each authorized and regulated by the Mexican financial authorities.
Not all products and services are offered in all jurisdictions. Services described are available in jurisdictions where permitted by law.