COVID-19’s resurgence in North America and Europe arrives as cases are stable and industrial activity is ramping up in China; this implies more divergent paths for commodity prices going forward.
Industrial metals prices remain well-supported, though we anticipate more muted gains in the coming months.
A more modest demand outlook and ongoing adjustments to the supply glut built up earlier this year suggest a modest trajectory for crude prices in the near-term.
US dollar appreciation is weighing down precious metals prices.
VIRUS STABLE IN CHINA, RESURGENT IN NORTH AMERICA, EUROPE
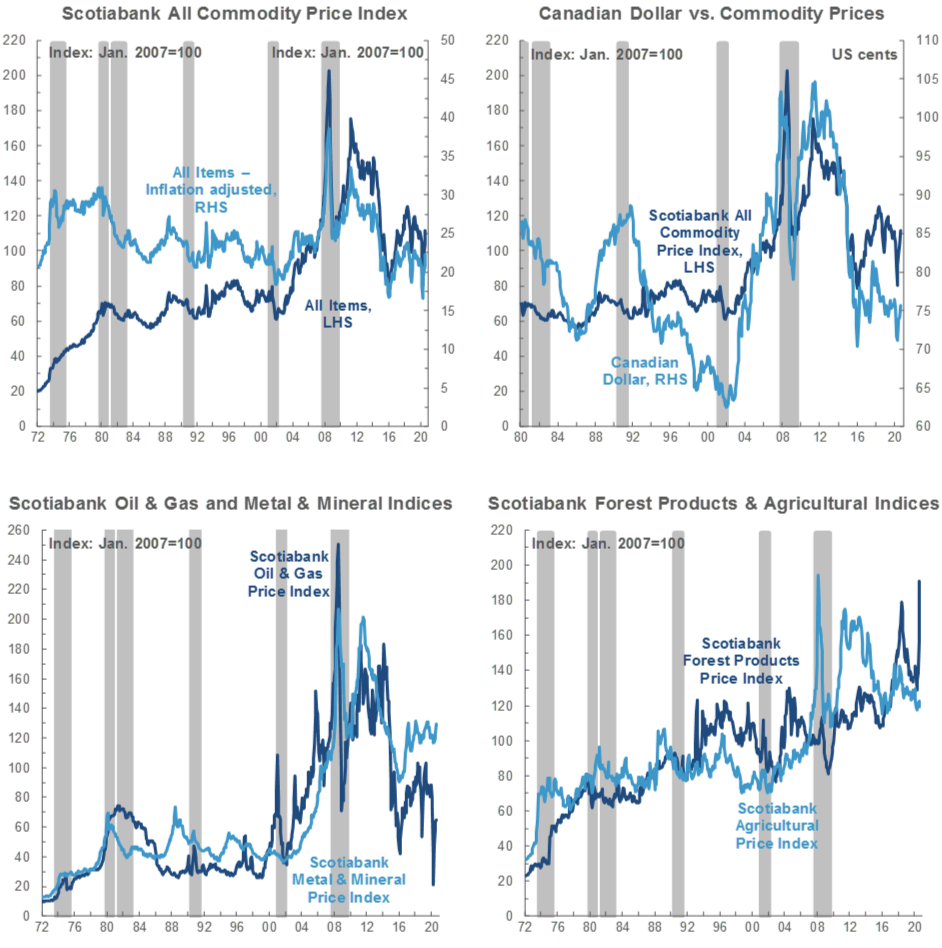
The world economy looks increasingly to be progressing along two tracks, with China’s buoyant post-COVID-19 lockdown rebound offering the best news for commodity pricing. The strength of demand in the world’s largest metals consumer continues to surprise on the upside, anchored by relatively early reopening, sustained by control of the virus’ spread, and bolstered by fiscal and monetary stimulus. In line with most forecasters, we anticipate that China will lead most nations’ growth this year, providing an offset to the drop in global activity as during the 2008–09 Global Financial Crisis (GFC) (chart 1).

By contrast, a second pandemic wave is incipient in North America and Europe. Many US states are reporting rising infection and positive test rates, and surges are prompting new restrictions in Canada’s largest provinces. Cases are also at or near all-time daily highs in France, the UK, and the Netherlands, which have reinstituted some containment measures. Clearly, continuation of this trend could undermine the gains made in the last several months, though we suspect that future lockdown measures will be less all-encompassing than those implemented during the first wave.
Against that backdrop, Sino-US trade and diplomatic tensions remain pertinent. Recall that uncertainty related to the spat between the world’s two largest economies weighed down industrial sector activity last year. With the US presidential election now in full swing, further brash and self-defeating political posturing can reasonably be expected for at least the next few weeks.
INDUSTRIAL METALS STILL CLIMBING, BUT DON’T EXPECT 2009 REPEAT
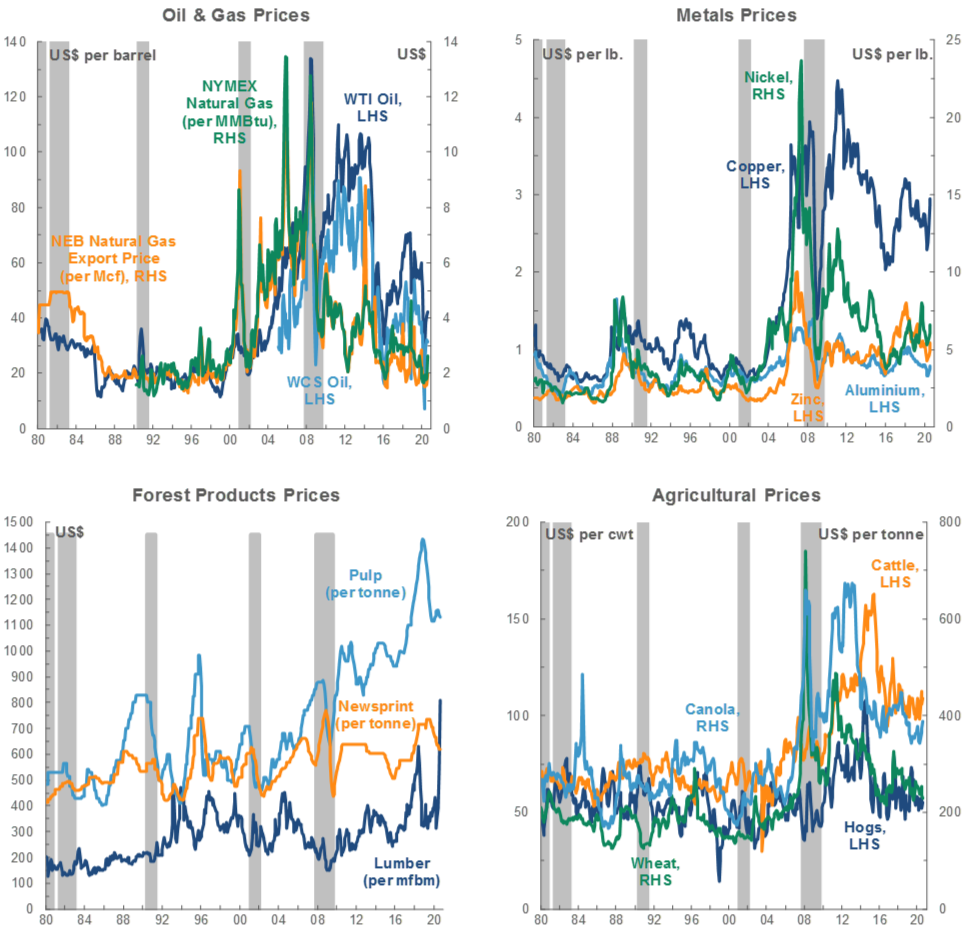
Copper’s remarkable rally—which persisted in early September but eased somewhat towards the end of the month—is invoking comparisons to the post-GFC boom. There are parallels, but we reiterate some key differences. One is the pandemic-led supply shock that coincided with the initial demand hit to keep the peak-to-trough price drop less than 30%—versus a decline of more than 60% in H2-2008. With a sustained South American output disruption now looking less likely given stable caseloads in key mining regions, there may be less room to run than in 2009 when supply responses were more lagged. Physical market tightness and China’s public spending plans should assist price momentum near-term, but we expect more modest gains for copper entering 2021 than in 2009–10.
Pricing for other base metals such as zinc and nickel continues to broadly mirror the expansion of the global economy. Liquidity infused by central banks and the slide in the US dollar earlier this year also lent pricing support.
Iron ore prices are hovering in the 115–120 USD/t range—more than 20 USD/t higher than in the months prior to the onset of the pandemic—but appear to be retreating. A core ingredient in steel production, the metal has also benefited from China’s industrial sector boom. Underlying the recent pullback is an increasing sense that supply may be catching up to demand. Brazilian iron ore production looks to be recovering nicely and inventories at Chinese ports have been trending gradually higher since mid-August. Top producer Vale also announced plans to step up output across its operations, reinforcing stronger-than-anticipated Q4 output guidance from other firms. We foresee further easing of prices entering 2021.
A BUSY MONTH FOR OIL MARKETS
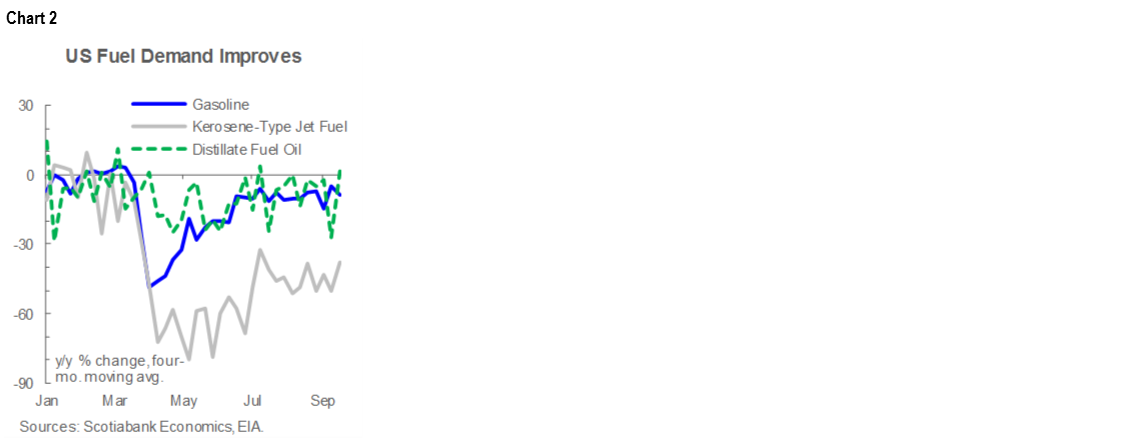
WTI retreated this month. The principal development came in the form of weaker-than-expected crude demand forecasts released by OPEC and the EIA, though markets looked to have already begun to price in virus-related fears. US production has also recovered from Hurricane Laura-related shutdowns that extended into early September. Combined, these effects pushed the US benchmark below 40 USD/bbl for much of the month, after it averaged about 42 USD/bbl in August. Further deterioration of the economic milieu—whether in North America or in Asia as the report anticipates—could clearly result in more price weakness, though we note that US fuel demand generally continued to improve this month (chart 2).
Following the September dip, OPEC+ maintained current production cut plans of 7.7 mn bpd through December, but stressed that members remain flexible to take additional measures should conditions dictate. That modestly lifted both Brent and WTI, but the durability of that boost remains to be seen. Earlier concerns that Saudi Arabia was attempting to flood the US crude market for now seem to have been allayed by the significant fallback in oil imports from the Kingdom.
The US refining industry is facing increasingly challenging conditions. NY Harbour and Gulf Coast crack spreads are well below seasonal averages, reflecting still-bloated product inventories. This continues to translate into low rates of refinery utilization, which may well trend lower near-term in light of the present supply glut and the potential for softer overall economic activity and fuel consumption.
Mirroring these challenges, WCS has fallen about 2 USD/bbl in recent weeks; that followed an earlier boost to the Western Canadian benchmark via Inter Pipeline’s shutdown of its Polaris conduit. Service has been partially restored, but the resulting reduction in the flow of diluent has resulted in at least one oil sands operation halting production until transportation capacity normalizes. This occurs as the Western Canada oil market continues its long rebalancing process. Lagged data for July showed an eight-year low for crude-by-rail shipments, a sign of the shift towards now-free space in pipelines that was prompted by weak pricing and plunging production, the latter of which is now recovering. Alberta crude inventories, bloated before the pandemic, have also fallen to levels not seen since early 2019.
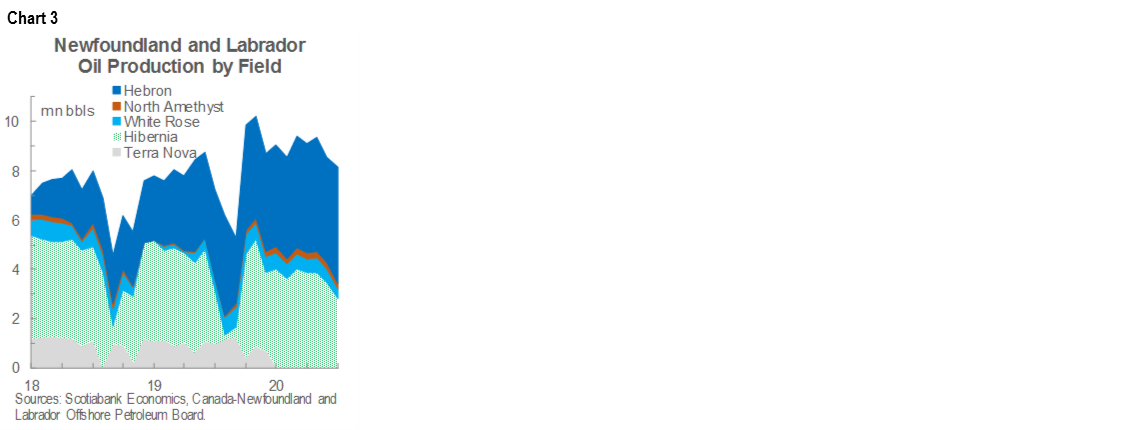
In Newfoundland and Labrador, a promising start to the year is increasingly giving way to new fears about the oil and gas sector. The West White Rose extension project, positioned as critical to the long-run viability of the existing White Rose offshore oil field, is under review by Husky, its proponent, and the provincial government rejected calls for direct public support. Meanwhile, operations at the Terra Nova field are still suspended with no restart date announced, eroding some of the gains associated with continued ramp-up of Hebron field output (chart 3, p.2).
SAFE HAVEN USD DRIVES PRECIOUS METALS LOWER
Bullion prices dropped below 1,900 USD/oz towards the end of September after spending much of August north of the 2,000 USD/oz mark. More recent selling pressure looks to reflect perceptions of relative rather than absolute risk in foreign exchange markets, which are bidding up the US dollar (chart 4, p.2). At first blush, American currency appreciation in the face of heightened domestic political risk and rising COVID-19 cases would seem counterintuitive, but the greenback is seen as a port in a storm of European infections. Medium-term yellow metal fundamentals remain constructive. In particular, the Federal Reserve’s stated tolerance for stronger inflation, though subject to implementation challenges, has the potential to weigh on US real rates.

Silver also fell back in the month, with a pronounced drop materializing in more recent weeks. Like gold, greenback appreciation has been the driving force behind the decline. Expectations of faltering construction and manufacturing activity in the Western world—the “white metal” is less dependent on Chinese consumption than its industrial counterparts—also look to be increasingly weighing on prices.
POLICY GROUND UNDER CANADIAN LUMBER AND ALUMINUM SHIFTS (AGAIN)
The government of British Columbia implemented new regulations to support the domestic lumber industry this month. New rules—initially intended to come into effect in July but delayed due to the pandemic—encourage within-province lumber production and processing by tightening conditions under which export permits can be granted. All else equal, they have the potential to push industry costs higher at a time when prices are sky-high, even after recently retreating from unsustainable levels. More modest domestic price gains might be expected to the extent that the policy does incent more production, which is still recovering from pandemic-induced cuts, though lumber shortages remain a Canada-wide issue. Against that backdrop, conflagrations in BC’s interior and the US West Coast are figuratively and literally adding fuel to the lumber supply crunch fire.
Canadian metals producers received good news when the Trump administration once again backed off threats to apply tariffs to imports of aluminum from the Great White North. The reversal apparently came in response to plans for retaliatory moves in political US battleground states, though to some extent, the threat was never credible given the US’s well-documented reliance on Canadian shipments to meet domestic consumption requirements.
TECHNICAL NOTE
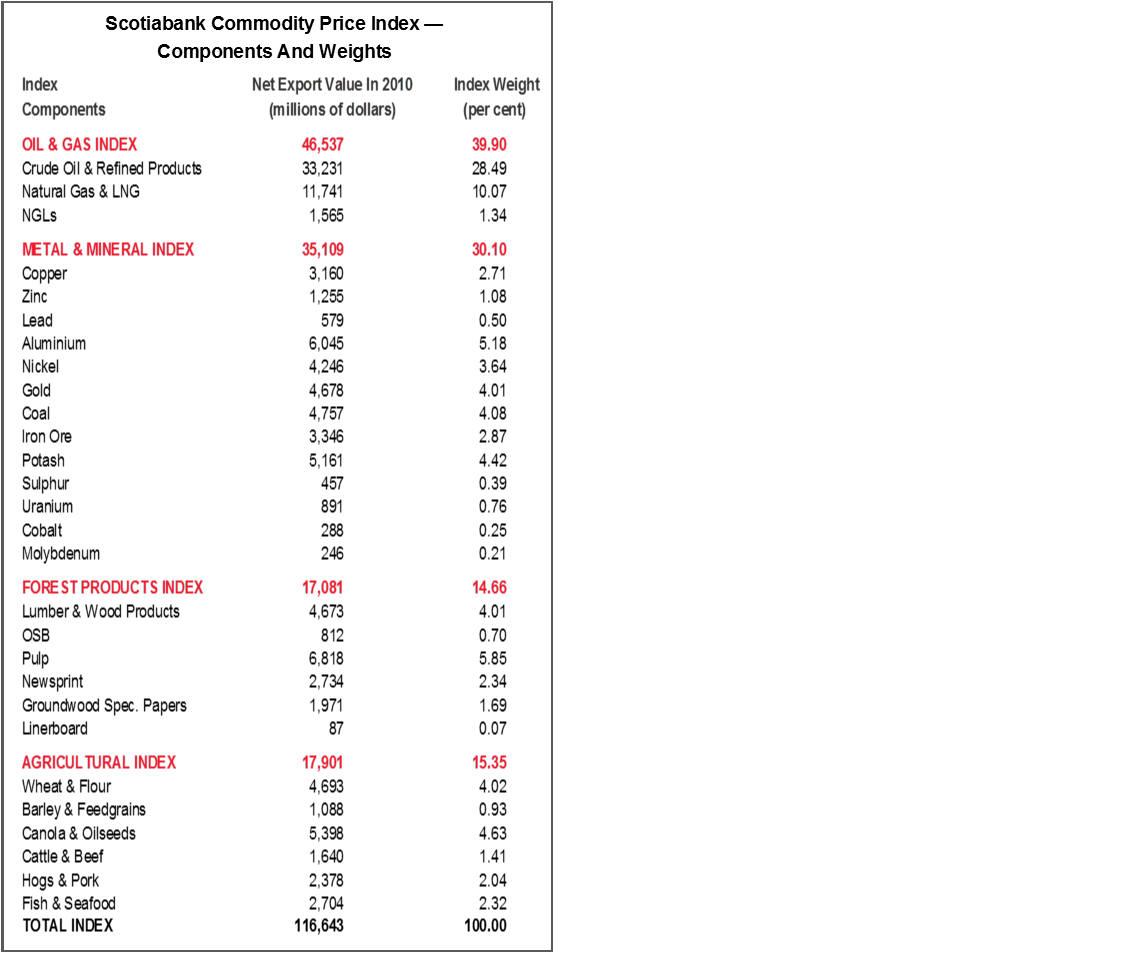
Scotiabank Commodity Price Index — Principal Canadian Exports
January 2007 = 100
This Index has been designed to track the spot or transactions prices paid in U.S. dollars for key Canadian commodities and resource-based manufactured goods in export markets. The weight of each component is based upon its net export value in 2010. Prior to January 2007, the weight of each component was based on its export value in 1995-97, except for crude oil & refined petroleum products, uncoated freesheet paper and linerboard, where net exports were used. Canada imports a significant quantity of these products, and use of their export value alone would have overstated the importance in Canada’s trade performance.
The following prices are included:
OIL & GAS
Crude Oil & Refined Petroleum Products (US$ per bbl) MSW light sweet crude oil at Edmonton (previously Edmonton Par crude) and Western Canadian Select heavy oil at Hardisty, Alberta; price differentials off WTI near-by futures from Bloomberg.
Natural Gas (US$ per mcf) Average export price quoted by the National Energy Board.
Natural Gas Liquids (NGLs – Propane, Butane, Ethane & Pentanes-Plus) (US$ per bbl), Propane at Edmonton & Sarnia.
METALS & MINERALS
Copper & Products (US$ per lb) LME official cash settlement price for grade A copper.
Zinc (US$ per lb) LME SHG cash settlement: prior to Sept 1990, U.S. producers’ price for high-grade zinc delivered.
Lead (US$ per lb) LME official cash settlement price; prior to Jan. 1991, U.S. producers’ price for common grade delivered.
Aluminium & Products (US$ per lb) since 1979, LME official cash settlement price.
Nickel (US$ per lb) since 1980, LME official cash settlement price.
Gold (US$ per oz) ‘LBMA Gold Price PM’ as of March 20, 2015.
Potash (US$ per tonne) Standard potassium chloride, spot price, FOB Vancouver.
Sulphur (US$ per tonne) Solid, spot price, FOB Vancouver.
Metallurgical Coal (US$ per tonne) Contract price for premium-grade hard coking coal, FOB Vancouver.
Iron Ore (US cents per dmtu) Spot price fines 62% Fe, CFR Qingdao, China; prior to Jan 2011, term-contract price for concentrates 66% Fe from Labrador/Quebec to Northern Europe (FOB Sept-Iles).
Uranium (US$ per lb) U3O8 near-by-futures from Bloomberg.
Molybdenum (US$ per lb) since March 1992, MW dealer oxide.
Cobalt (US$ per lb) MW dealer price.
FOREST PRODUCTS
Lumber & Wood Products, Western Spruce-Pine-Fir 2x4 No.2 & Btr (US$ per mfbm) FOB mill.
Oriented Strandboard (US$ per thousand sq. ft.), U.S. North Central region, 7/16 inch.
Pulp, Bleached Northern Softwood Kraft (US$ per tonne) Transactions price, delivery USA.
Newsprint (US$ per tonne) Average transactions price, 45 grams, delivery Eastern USA.
Groundwood Specialty Papers (US$ per ton) Supercalendered-A paper, 35 lb., delivery USA.
Linerboard (US$ per ton), delivery Eastern USA with zone discounts.
AGRICULTURE
Wheat & Flour (US$ per tonne), DNS No 1 14% protein Duluth, Minn; prior to April 2011 No.1 CWRS, 13.5% protein at St. Lawrence.
Barley (US$ per tonne), Manitoba Agriculture and Food No. 1 Canadian western barley aggregate spot price; historical data No. 1 at Lethbridge, Alberta.
Canola & Oilseeds (US$ per tonne) No.1 Canada, in store Vancouver.
Cattle & Beef (US$ per cwt) Steers over 1,051 pounds at Toronto; from Jan 1993, Ontario average.
Hogs & Pork (US$ per cwt) 100 Index Hogs at Toronto; from Jan 1993, Ontario average.
Fish & Seafood (US$ per lb) West Coast silver coho salmon; Atlantic lobster prices; prior to 1986 cod fillets & blocks.
DISCLAIMER
This report has been prepared by Scotiabank Economics as a resource for the clients of Scotiabank. Opinions, estimates and projections contained herein are our own as of the date hereof and are subject to change without notice. The information and opinions contained herein have been compiled or arrived at from sources believed reliable but no representation or warranty, express or implied, is made as to their accuracy or completeness. Neither Scotiabank nor any of its officers, directors, partners, employees or affiliates accepts any liability whatsoever for any direct or consequential loss arising from any use of this report or its contents.
These reports are provided to you for informational purposes only. This report is not, and is not constructed as, an offer to sell or solicitation of any offer to buy any financial instrument, nor shall this report be construed as an opinion as to whether you should enter into any swap or trading strategy involving a swap or any other transaction. The information contained in this report is not intended to be, and does not constitute, a recommendation of a swap or trading strategy involving a swap within the meaning of U.S. Commodity Futures Trading Commission Regulation 23.434 and Appendix A thereto. This material is not intended to be individually tailored to your needs or characteristics and should not be viewed as a “call to action” or suggestion that you enter into a swap or trading strategy involving a swap or any other transaction. Scotiabank may engage in transactions in a manner inconsistent with the views discussed this report and may have positions, or be in the process of acquiring or disposing of positions, referred to in this report.
Scotiabank, its affiliates and any of their respective officers, directors and employees may from time to time take positions in currencies, act as managers, co-managers or underwriters of a public offering or act as principals or agents, deal in, own or act as market makers or advisors, brokers or commercial and/or investment bankers in relation to securities or related derivatives. As a result of these actions, Scotiabank may receive remuneration. All Scotiabank products and services are subject to the terms of applicable agreements and local regulations. Officers, directors and employees of Scotiabank and its affiliates may serve as directors of corporations.
Any securities discussed in this report may not be suitable for all investors. Scotiabank recommends that investors independently evaluate any issuer and security discussed in this report, and consult with any advisors they deem necessary prior to making any investment.
This report and all information, opinions and conclusions contained in it are protected by copyright. This information may not be reproduced without the prior express written consent of Scotiabank.
™ Trademark of The Bank of Nova Scotia. Used under license, where applicable.
Scotiabank, together with “Global Banking and Markets”, is a marketing name for the global corporate and investment banking and capital markets businesses of The Bank of Nova Scotia and certain of its affiliates in the countries where they operate, including, Scotiabanc Inc.; Citadel Hill Advisors L.L.C.; The Bank of Nova Scotia Trust Company of New York; Scotiabank Europe plc; Scotiabank (Ireland) Limited; Scotiabank Inverlat S.A., Institución de Banca Múltiple, Scotia Inverlat Casa de Bolsa S.A. de C.V., Scotia Inverlat Derivados S.A. de C.V. – all members of the Scotiabank group and authorized users of the Scotiabank mark. The Bank of Nova Scotia is incorporated in Canada with limited liability and is authorised and regulated by the Office of the Superintendent of Financial Institutions Canada. The Bank of Nova Scotia is authorised by the UK Prudential Regulation Authority and is subject to regulation by the UK Financial Conduct Authority and limited regulation by the UK Prudential Regulation Authority. Details about the extent of The Bank of Nova Scotia's regulation by the UK Prudential Regulation Authority are available from us on request. Scotiabank Europe plc is authorised by the UK Prudential Regulation Authority and regulated by the UK Financial Conduct Authority and the UK Prudential Regulation Authority.
Scotiabank Inverlat, S.A., Scotia Inverlat Casa de Bolsa, S.A. de C.V., and Scotia Derivados, S.A. de C.V., are each authorized and regulated by the Mexican financial authorities.
Not all products and services are offered in all jurisdictions. Services described are available in jurisdictions where permitted by law.