SUMMARY
- Incoming data continue to indicate that a strong economic rebound is progressing around the globe; we still expect inflation to ease towards its target rate as the year progresses.
- Hawkish Federal Reserve communications negatively impacted prices for many commodities this month.
- The steep climb across major crude benchmarks persisted in June as fundamentals strengthened; OPEC+ and Iran nuclear deal talks continue to hang over the market.
- Key industrial metals witnessed more moderate price gains in June than in May—copper values fell—but fundamental demand-supply drivers remain in place.
ECONOMIC BACKDROP: FED TONE SHIFTS
Incoming data continue to indicate that a strong economic rebound is progressing around the globe. Statistics released in some nations for the period of the third wave suggest that momentum stalled in April and May; rising vaccination rates—particularly in Canada—bode well for a rebound, and reopening is underway in many jurisdictions. We still anticipate global growth north of 6% in 2021—that would represent the strongest expansion since at least 1980.
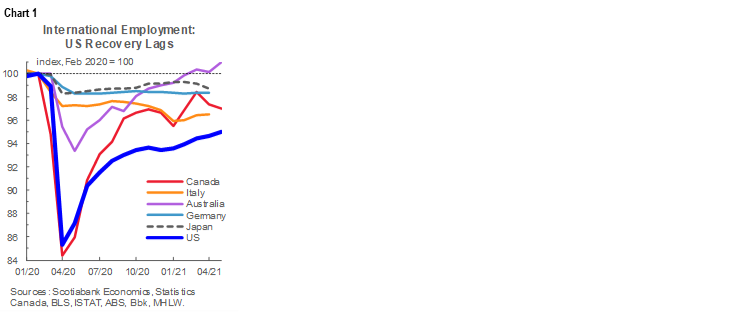
Canadian and US data for May showed the strongest inflation rate since the early 2000s; we still expect the supply side of the economy to rise enough in the coming months to ease the pace of price appreciation towards its target. Accordingly, we still believe that the Bank of Canada will lift its policy rate in Q3-2022 and that the Federal Reserve will likely begin tapering in January 2022 before raising interest rates in Q2-2023. In the interim, however, price surges via product shortages are possible. Relative US labour market weakness (chart 1) argues for extended monetary stimulus, though improvement on this front is likely.
Nonetheless, market participants clearly responded to inflationary signals and to the change in the tone of US Federal Reserve communications this month. That impacted prices of many commodities in our coverage universe.
GOLD PRICE TUMBLES AT MONTH’S END
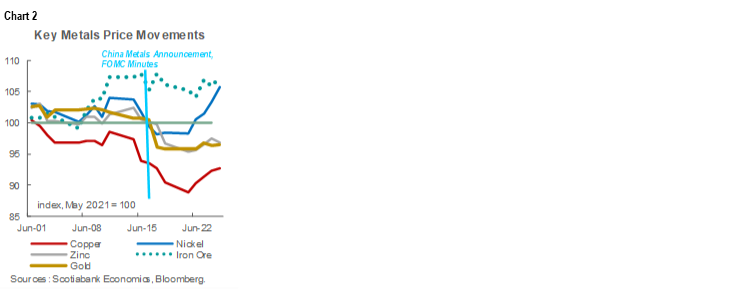
Bullion was one casualty of hawkish Federal Reserve communications this month (chart 2, p.2). One trading day after the latest FOMC minutes were released, gold prices fell by more than 80 USD/oz—the steepest one-day plunge since August of last year. The yellow metal’s high level over the last year has been anchored by the US central bank’s guidance that it would tolerate above-target inflation and keep rates low for the next several years. Neither policy plank was abandoned in the June FOMC minutes, but stronger inflation and growth projections and a tilt towards earlier rate hikes by some committee participants evidently had some gold buyers rethinking their expectations for US real rates.
CRUDE’S BEST MONTH SINCE BEFORE THE PANDEMIC
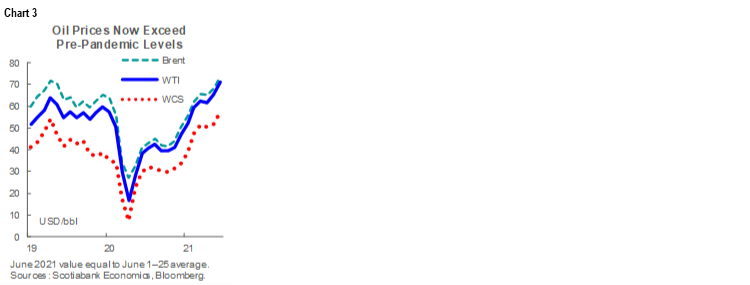
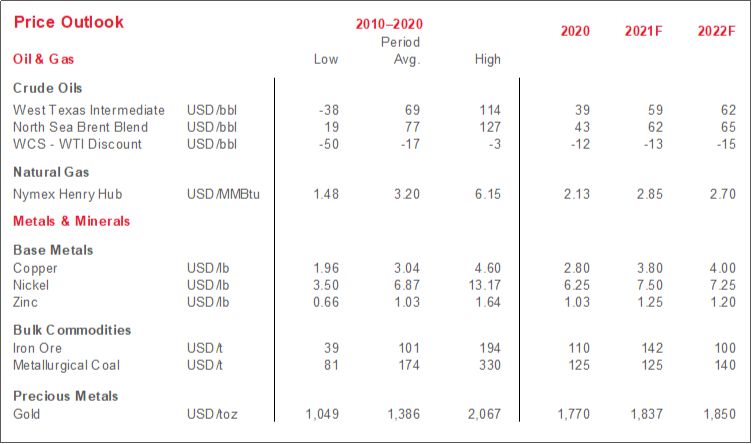
The steep climb across major crude benchmarks persisted in June as fundamentals continued to strengthen. At the time of writing, WTI and Brent were both at their highest levels since late 2018 (chart 3), having breached the 70 USD/bbl mark and averaging roughly 50% higher to date this year than for all of 2020. In the US, refinery activity continued to rise last month, as did fuel consumption—including beleaguered jet fuel as reopening progressed and with travel activity’s recovery underway. The supply side of the market is also contributing to tightness, with crude stocks in the week of June 18th at their lowest level since March 2020 and output still well below pre-pandemic levels.
In the near-term, crude values will no doubt respond to developments on two fronts. The first is the tenor of Iranian nuclear accord talks, agreement on which could bring significant new crude supply online. An apparent pause in discussions this month was followed by a spike in crude values; nuclear talk news drove similar volatility earlier this year. The second is the outcome of this week’s OPEC+ talks. The bloc’s production discipline to date has lent significant support to crude values; early indications are that its members will vote to ease quotas in respect of the stronger oil price environment.
WCS has followed the light benchmarks’ leads, approaching the 60 USD/bbl mark this month. Against that backdrop, and with an assist from the late-2020 end of the provincial government’s curtailment program that restricted production, output and drilling are up substantially in Alberta to date this year. A positive Minnesota Court of Appeals ruling on the Line 3 pipeline—critical to Western Canadian egress capacity in the medium-term—likely clears the way for the project to be completed late this year.
INDUSTRIAL METALS PRICES PAUSE, REMAIN WELL-SUPPORTED
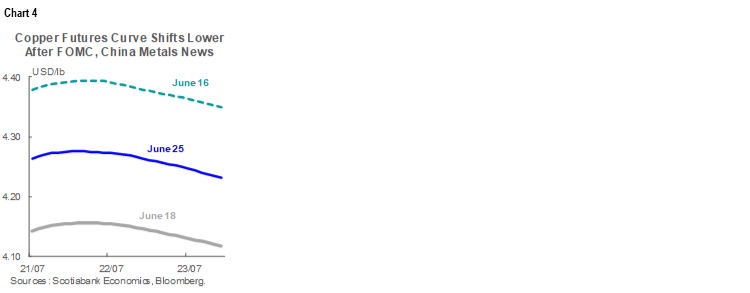
Two forces drove the price of copper’s fall from the record levels achieved in May. The first was the hawkish FOMC minutes, which bid up the US dollar and put downward pressure on values of all greenback-priced products. The second was Beijing’s announcement that it would auction off some of its strategic reserves of key base metals in an effort to cool the torrid pace of recent price gains. That hit copper—perhaps the biggest beneficiary of improving risk appetite since the peak lockdown period—hard, but drops were witnessed across industrial and agricultural commodities. The red metal’s forward curve shifted lower mid-month (chart 4). Still, copper prices remain very high relative to historical averages, and should stay supported by the global recovery this year and by battery demand plus limited output growth in the longer run.
Recent momentum in nickel and zinc prices also stalled in the second half of June. Values for both metals declined following the June 16th Federal Reserve communication, but have since rallied. Nickel in particular has seen strong gains over the past week on strong demand signals and some speculative activity.
Though affected by many of the same factors as the other industrial metals, iron ore values continued to climb in June. Reports of record Chinese steel output lifted prices for iron ore—an important ingredient in steel production. Suspension of major mines—two in Brazil following a local evacuation order and one in China in response to flooding—may further tighten the market. As we near 2022, we expect a ramp-up in Latin American iron ore output and diminishing speculative activity to help narrow the gap between supply and demand and push prices down towards the 100 USD/t mark.
TECHNICAL NOTE
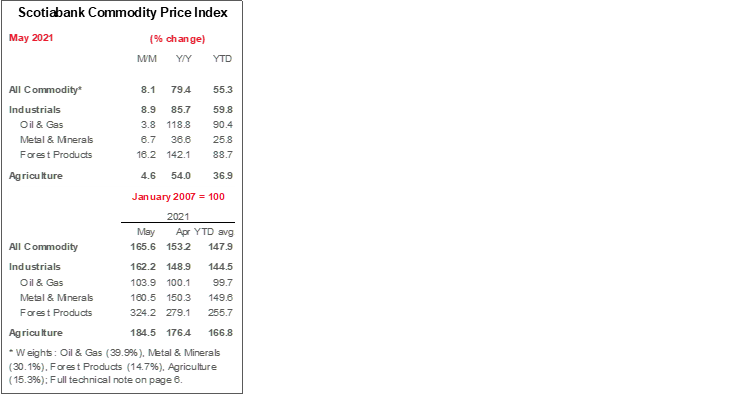
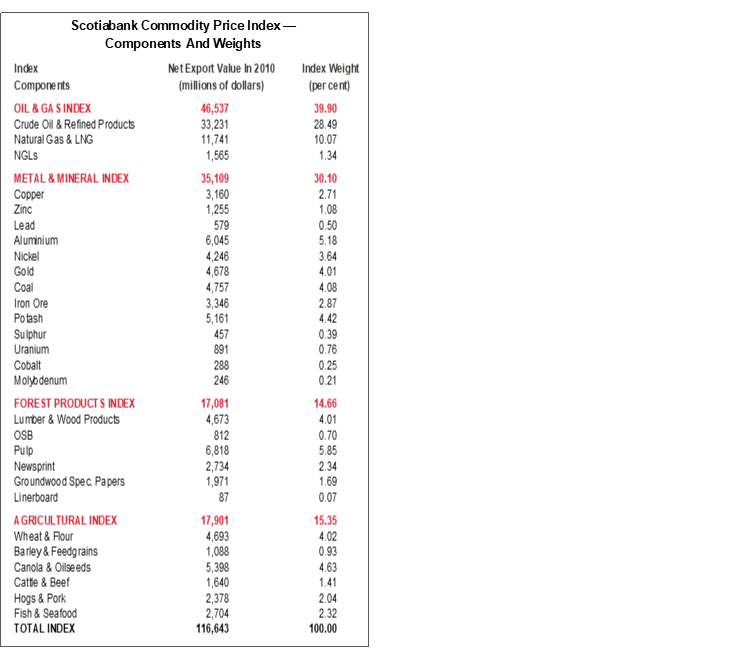
Scotiabank Commodity Price Index — Principal Canadian Exports
January 2007 = 100
This Index has been designed to track the spot or transactions prices paid in U.S. dollars for key Canadian commodities and resource-based manufactured goods in export markets. The weight of each component is based upon its net export value in 2010. Prior to January 2007, the weight of each component was based on its export value in 1995-97, except for crude oil & refined petroleum products, uncoated freesheet paper and linerboard, where net exports were used. Canada imports a significant quantity of these products, and use of their export value alone would have overstated the importance in Canada’s trade performance.
The following prices are included:
OIL & GAS
Crude Oil & Refined Petroleum Products (US$ per bbl) MSW light sweet crude oil at Edmonton (previously Edmonton Par crude) and Western Canadian Select heavy oil at Hardisty, Alberta; price differentials off WTI near-by futures from Bloomberg.
Natural Gas (US$ per mcf) Average export price quoted by the National Energy Board.
Natural Gas Liquids (NGLs – Propane, Butane, Ethane & Pentanes-Plus) (US$ per bbl), Propane at Edmonton & Sarnia.
METALS & MINERALS
Copper & Products (US$ per lb) LME official cash settlement price for grade A copper.
Zinc (US$ per lb) LME SHG cash settlement: prior to Sept 1990, U.S. producers’ price for high-grade zinc delivered.
Lead (US$ per lb) LME official cash settlement price; prior to Jan. 1991, U.S. producers’ price for common grade delivered.
Aluminium & Products (US$ per lb) since 1979, LME official cash settlement price.
Nickel (US$ per lb) since 1980, LME official cash settlement price.
Gold (US$ per oz) ‘LBMA Gold Price PM’ as of March 20, 2015.
Potash (US$ per tonne) Standard potassium chloride, spot price, FOB Vancouver.
Sulphur (US$ per tonne) Solid, spot price, FOB Vancouver.
Metallurgical Coal (US$ per tonne) Contract price for premium-grade hard coking coal, FOB Vancouver.
Iron Ore (US cents per dmtu) Spot price fines 62% Fe, CFR Qingdao, China; prior to Jan 2011, term-contract price for concentrates 66% Fe from Labrador/Quebec to Northern Europe (FOB Sept-Iles).
Uranium (US$ per lb) U3O8 near-by-futures from Bloomberg.
Molybdenum (US$ per lb) since March 1992, MW dealer oxide.
Cobalt (US$ per lb) MW dealer price.
FOREST PRODUCTS
Lumber & Wood Products, Western Spruce-Pine-Fir 2x4 No.2 & Btr (US$ per mfbm) FOB mill.
Oriented Strandboard (US$ per thousand sq. ft.), U.S. North Central region, 7/16 inch.
Pulp, Bleached Northern Softwood Kraft (US$ per tonne) Transactions price, delivery USA.
Newsprint (US$ per tonne) Average transactions price, 45 grams, delivery Eastern USA.
Groundwood Specialty Papers (US$ per ton) Supercalendered-A paper, 35 lb., delivery USA.
Linerboard (US$ per ton), delivery Eastern USA with zone discounts.
AGRICULTURE
Wheat & Flour (US$ per tonne), DNS No 1 14% protein Duluth, Minn; prior to April 2011 No.1 CWRS, 13.5% protein at St. Lawrence.
Barley (US$ per tonne), Manitoba Agriculture and Food No. 1 Canadian western barley aggregate spot price; historical data No. 1 at Lethbridge, Alberta.
Canola & Oilseeds (US$ per tonne) No.1 Canada, in store Vancouver.
Cattle & Beef (US$ per cwt) Steers over 1,051 pounds at Toronto; from Jan 1993, Ontario average.
Hogs & Pork (US$ per cwt) 100 Index Hogs at Toronto; from Jan 1993, Ontario average.
Fish & Seafood (US$ per lb) West Coast silver coho salmon; Atlantic lobster prices; prior to 1986 cod fillets & blocks.
DISCLAIMER
This report has been prepared by Scotiabank Economics as a resource for the clients of Scotiabank. Opinions, estimates and projections contained herein are our own as of the date hereof and are subject to change without notice. The information and opinions contained herein have been compiled or arrived at from sources believed reliable but no representation or warranty, express or implied, is made as to their accuracy or completeness. Neither Scotiabank nor any of its officers, directors, partners, employees or affiliates accepts any liability whatsoever for any direct or consequential loss arising from any use of this report or its contents.
These reports are provided to you for informational purposes only. This report is not, and is not constructed as, an offer to sell or solicitation of any offer to buy any financial instrument, nor shall this report be construed as an opinion as to whether you should enter into any swap or trading strategy involving a swap or any other transaction. The information contained in this report is not intended to be, and does not constitute, a recommendation of a swap or trading strategy involving a swap within the meaning of U.S. Commodity Futures Trading Commission Regulation 23.434 and Appendix A thereto. This material is not intended to be individually tailored to your needs or characteristics and should not be viewed as a “call to action” or suggestion that you enter into a swap or trading strategy involving a swap or any other transaction. Scotiabank may engage in transactions in a manner inconsistent with the views discussed this report and may have positions, or be in the process of acquiring or disposing of positions, referred to in this report.
Scotiabank, its affiliates and any of their respective officers, directors and employees may from time to time take positions in currencies, act as managers, co-managers or underwriters of a public offering or act as principals or agents, deal in, own or act as market makers or advisors, brokers or commercial and/or investment bankers in relation to securities or related derivatives. As a result of these actions, Scotiabank may receive remuneration. All Scotiabank products and services are subject to the terms of applicable agreements and local regulations. Officers, directors and employees of Scotiabank and its affiliates may serve as directors of corporations.
Any securities discussed in this report may not be suitable for all investors. Scotiabank recommends that investors independently evaluate any issuer and security discussed in this report, and consult with any advisors they deem necessary prior to making any investment.
This report and all information, opinions and conclusions contained in it are protected by copyright. This information may not be reproduced without the prior express written consent of Scotiabank.
™ Trademark of The Bank of Nova Scotia. Used under license, where applicable.
Scotiabank, together with “Global Banking and Markets”, is a marketing name for the global corporate and investment banking and capital markets businesses of The Bank of Nova Scotia and certain of its affiliates in the countries where they operate, including; Scotiabank Europe plc; Scotiabank (Ireland) Designated Activity Company; Scotiabank Inverlat S.A., Institución de Banca Múltiple, Grupo Financiero Scotiabank Inverlat, Scotia Inverlat Casa de Bolsa, S.A. de C.V., Grupo Financiero Scotiabank Inverlat, Scotia Inverlat Derivados S.A. de C.V. – all members of the Scotiabank group and authorized users of the Scotiabank mark. The Bank of Nova Scotia is incorporated in Canada with limited liability and is authorised and regulated by the Office of the Superintendent of Financial Institutions Canada. The Bank of Nova Scotia is authorized by the UK Prudential Regulation Authority and is subject to regulation by the UK Financial Conduct Authority and limited regulation by the UK Prudential Regulation Authority. Details about the extent of The Bank of Nova Scotia's regulation by the UK Prudential Regulation Authority are available from us on request. Scotiabank Europe plc is authorized by the UK Prudential Regulation Authority and regulated by the UK Financial Conduct Authority and the UK Prudential Regulation Authority.
Scotiabank Inverlat, S.A., Scotia Inverlat Casa de Bolsa, S.A. de C.V, Grupo Financiero Scotiabank Inverlat, and Scotia Inverlat Derivados, S.A. de C.V., are each authorized and regulated by the Mexican financial authorities.
Not all products and services are offered in all jurisdictions. Services described are available in jurisdictions where permitted by law.