Broadly speaking, commodity prices have continued to gain despite COVID-19 flare-ups and paused reopening plans in some jurisdictions.
Healthy price appreciation is persisting for industrial metals in particular amid rallying manufacturing and construction activity and regional supply concerns.
Crude oil markets continue on their long rebalancing process.
GLOBAL RECOVERY PROGRESSING
Global economic activity is still broadly improving from the depths reached amid early-year lockdowns (chart 1), despite a rise in COVID-19 cases and paused plans to further ease restrictions in a number of jurisdictions. That remains a factor lending support for most commodity prices. From a growth rate perspective, our forecast trajectories for most jurisdictions most closely resemble the classic “V-shaped” recovery pattern. However, the rebound is expected to be a gradual one in which recuperation of H1-2020 losses takes up to two years for many countries.

Although we do not anticipate that the rapid spread of the virus in the US will undermine the global economy’s overall trajectory, it has influenced risk sentiment and further failure to get it under control could change our view. Putting on hold of some reopening plans may also result in some incremental mark-downs to growth in some countries.
Sino-US trade and diplomatic tensions remain high. Last week, both countries closed overseas consulates. Uncertainty generated by an extended spat between the world’s two largest economies significantly held back growth and weighed on commodity pricing last year. Now rearing its ugly head once again in 2020, it threatens an already delicate recovery from COVID-19.
METALS: GOLD AND COPPER CONTINUE TO CLIMB IN TANDEM
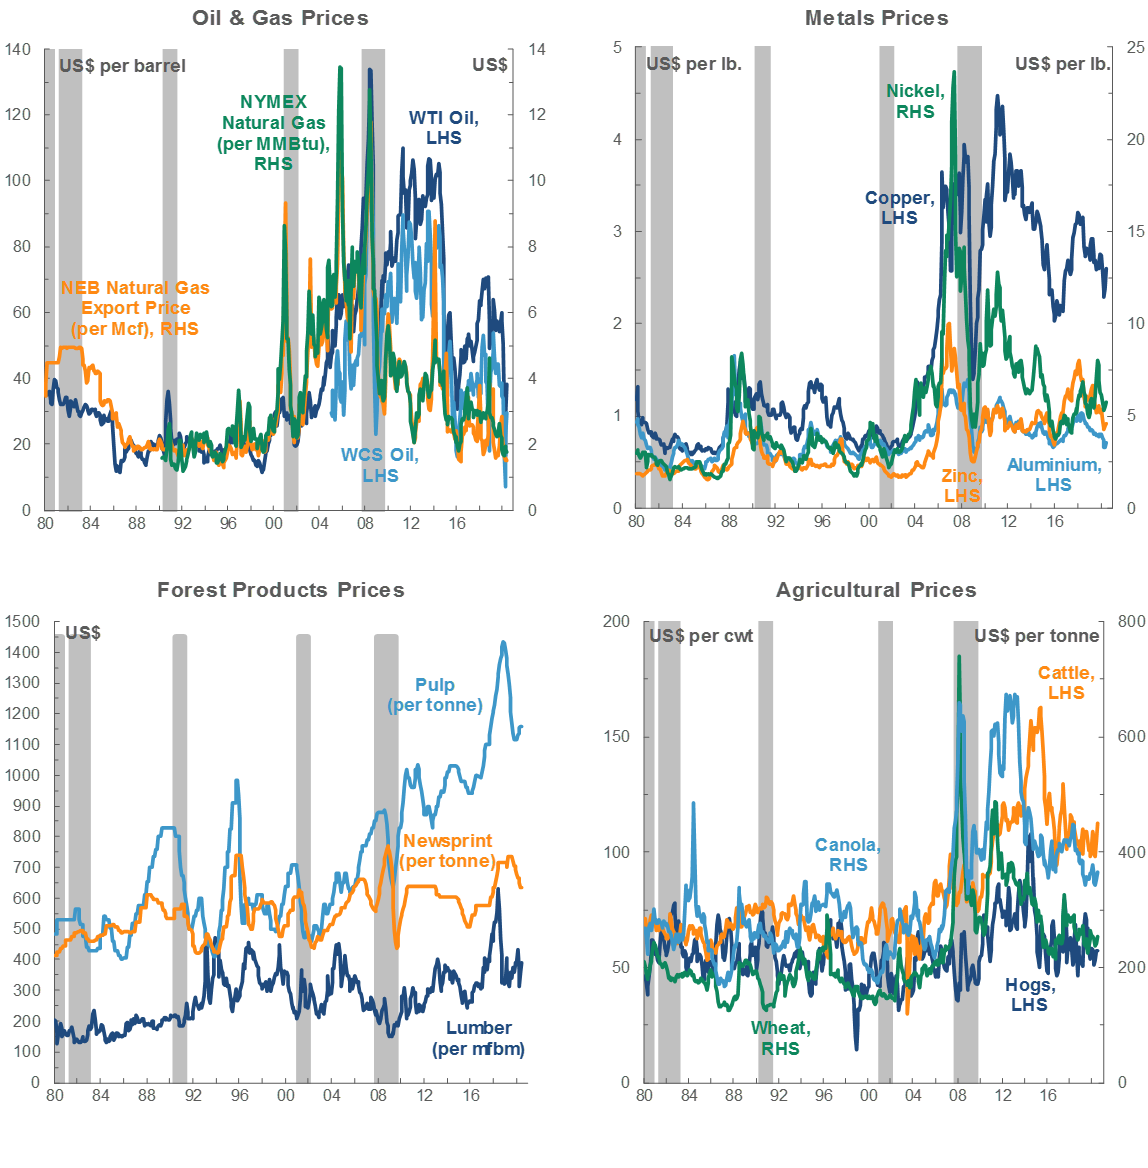
The dual rise in gold and copper prices has been a peculiar feature of the commodities landscape this year. The value of one metal tends to move higher as the other dips. Typically, gold is sought out as a safe haven asset during turbulent economic times, while the “Dr. Copper” moniker reflects perceptions of the red metal as a bellwether of global construction and manufacturing activity.
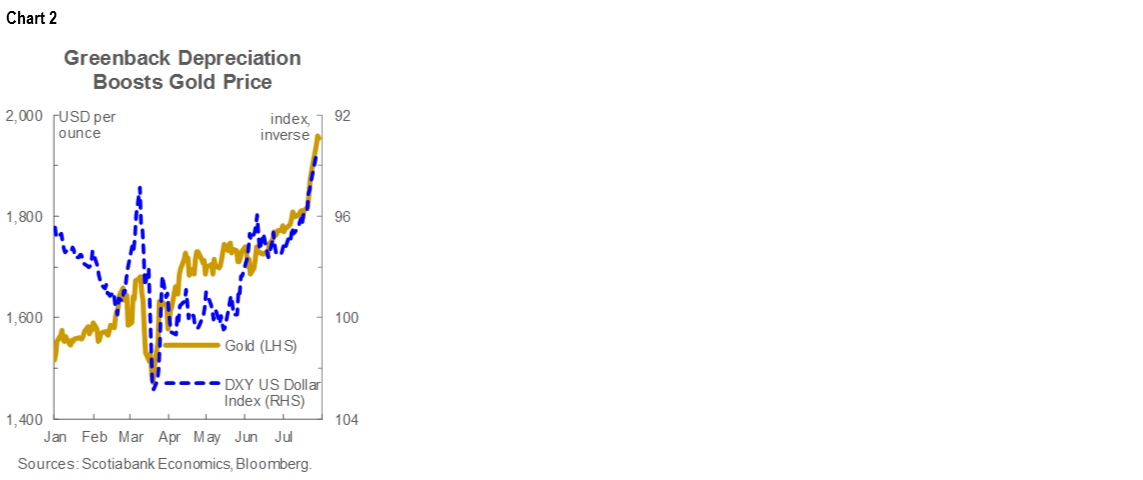
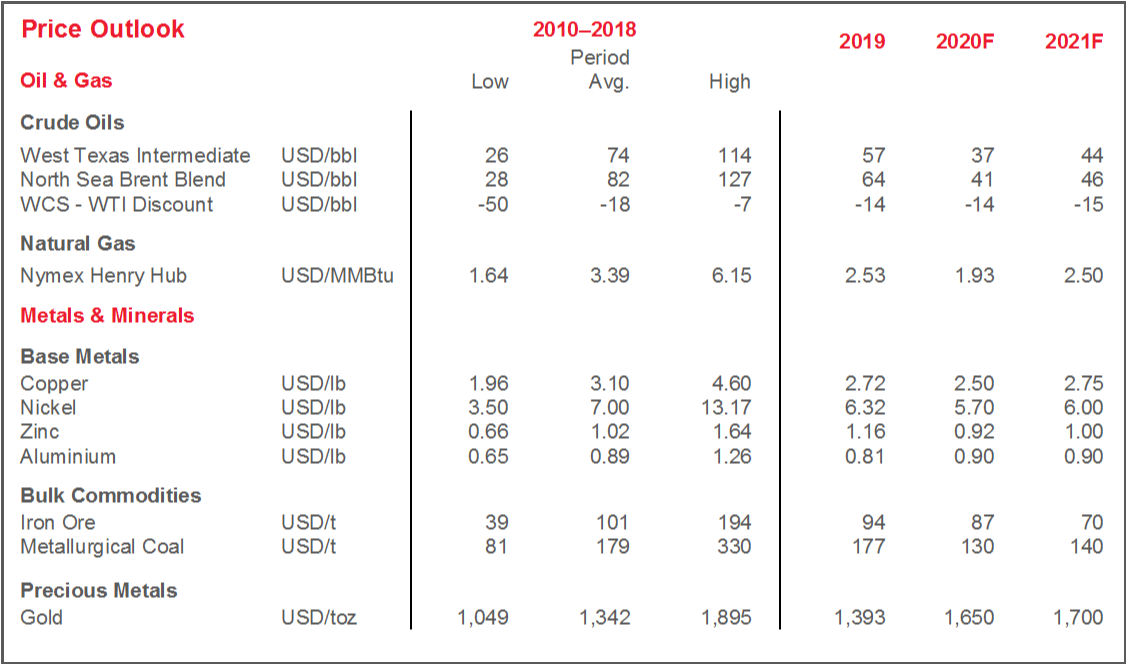
An uncertain—albeit improving—economic environment has broadly boosted bullion prices. Investors flocked to the yellow metal in 2019 during the Sino-US trade war, lifting its price significantly higher, and have continued to do so this year amid the most uncertain economic environment since the Great Depression. Gold’s more recent jump above USD 1,900/oz mirrors substantial depreciation of the US dollar (chart 2). We argue that this reflects a shift away from the safe harbour offered by the greenback rather than the inflation pickup that some dread. Still, the drivers of recent bullion price growth should remain in place in the coming months.
Hovering near 3.00 USD/t, copper is up more than 35% since its March nadir, having blown through pre-pandemic price levels in the process (chart 3). Two fundamental factors explain these jumps. Just as early lockdowns in China—responsible for about half of global copper consumption—hammered industrial activity and demand, so too have a better-than-expected rebound and a sizeable stimulus package bolstered the red metal’s climb. Meanwhile, the persistent spread of COVID-19 in key producers Chile and Peru has engendered acute supply concerns, putting more upward pressure on prices. With both factors likely to persist into the next few months, we have revised our near-term copper forecasts upward.
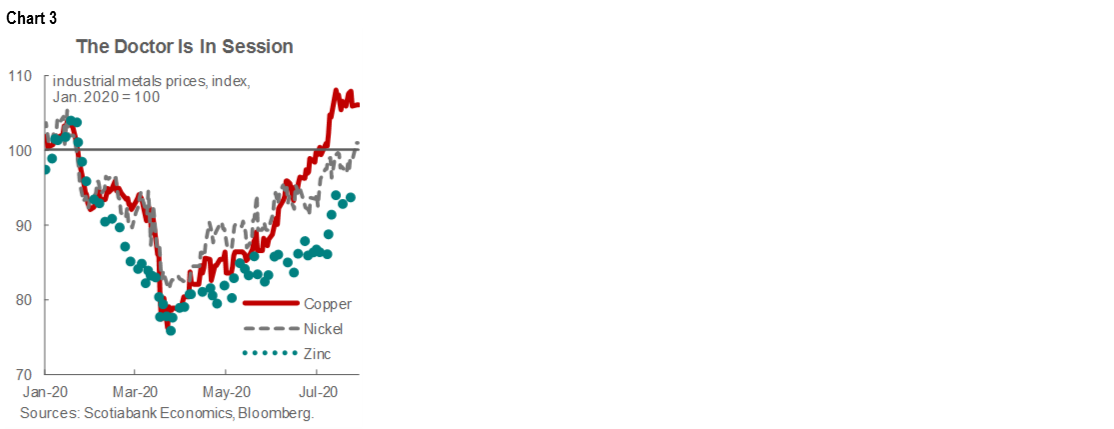
Other industrial metals prices have also trended higher, but their outlooks are less sanguine. Iron ore continues to benefit from robust Chinese steel production, weak inventories at Chinese ports, and uncertainty about supply given that COVID-19 is running rampant in Brazil’s principal mining region. However, anxiety on the latter item may ease with output guidance thus far intact. Nickel has also climbed, but unlike copper, its market began 2020 in a surplus position; Indonesia’s nickel pig iron export ban will likely support strong production for the next few years. Zinc prices, while out of their pandemic doldrums, will have to grapple with the arrival of new production capacity initiated before the pandemic as well as particularly weak demand related to the metal’s use in the transportation and auto sectors.
FIRST SIGNS OF OIL PRODUCTION INCREASES BEGIN TO EMERGE
Crude markets are continuing the long process of rebalancing. Bolstered by WTI prices in the USD 35–40/bbl range for the last two months, American drillers have begun to notch production higher (chart 4). That, in turn, is beginning to slowly eat into the massive crude inventory balance built up during the simultaneous demand and supply shocks experienced early this year. Further increases in COVID-19 cases and any related restrictions in the US continue to present downside risk.
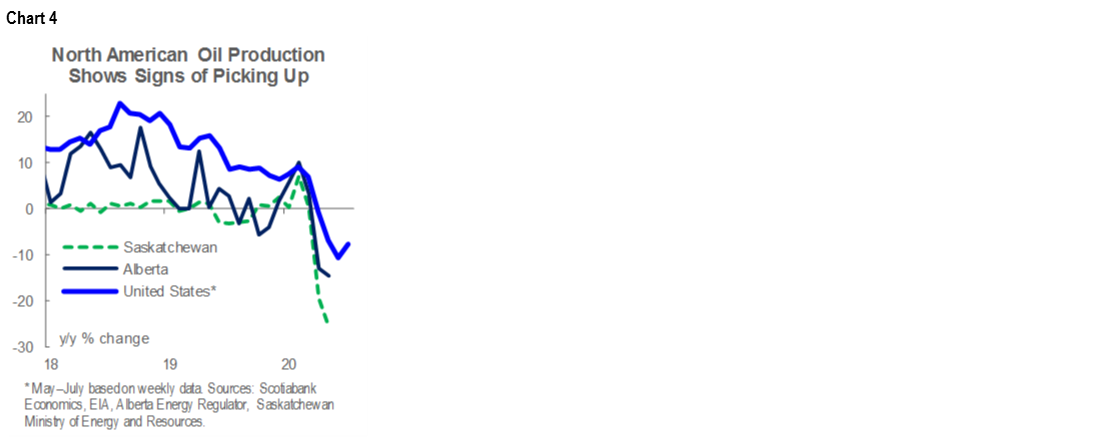
Alberta crude production declines may also be easing, and we anticipate a narrower-than-previously projected WCS-WTI differential over the next several years. A strong production pullback following the COVID-19 oil price crash has left excess capacity on export pipelines, an acute deficit of which hamstrung Western oil producers for the last few years. Heavy oil availability has also likey been limited due to OPEC+ and Venezuelan supply reductions. The spread is now hovering nearer 10 USD/bbl, but we foresee a more sustainable average spread of in the 15 USD/bbl range over the next few years. Longer-run, prospects for Western producers were bolstered this month by the Supreme Court of Canada’s dismissal of an appeal of the TransMountain Expansion pipeline, which effectively ends a years-long legal battle.
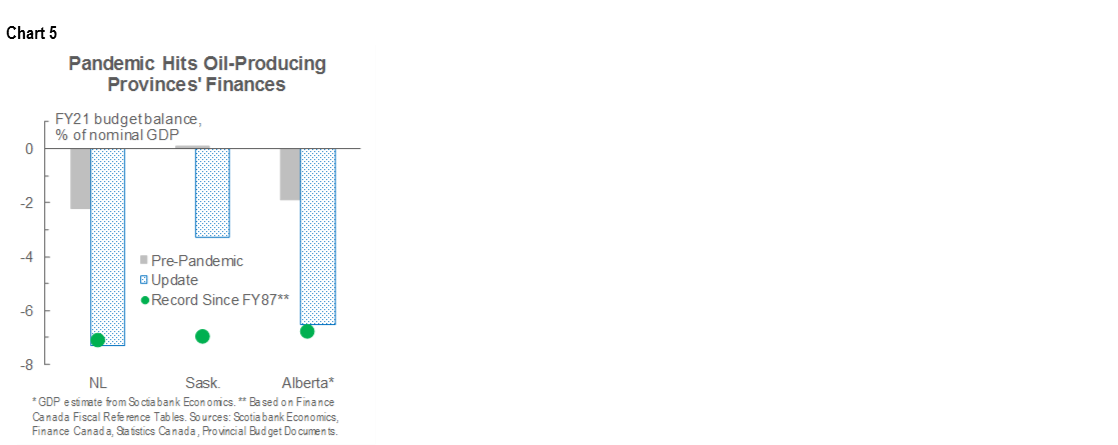
Newfoundland and Labrador’s economic and fiscal update released last Friday offered a reminder of the challenges that lie ahead for oil and gas-intensive jurisdictions. As we highlighted in our note, the province appears on pace to avoid an historic real output contraction in part because of climbing production at the long lead-time Hebron offshore oil field; however, it faces a near-record nominal fiscal deficit this year. As in Saskatchewan, The Rock will likely grapple with long-run financial sustainability concerns and the need to support a hard-hit, resource-based economy. Alberta is expected to publish an official financial update in August, but the provincial government has already indicated that this year`s fiscal shortfall will be at least CAD 20 bn (6–7% of nominal GDP, according to our latest forecasts) (chart 5).

TECHNICAL NOTE
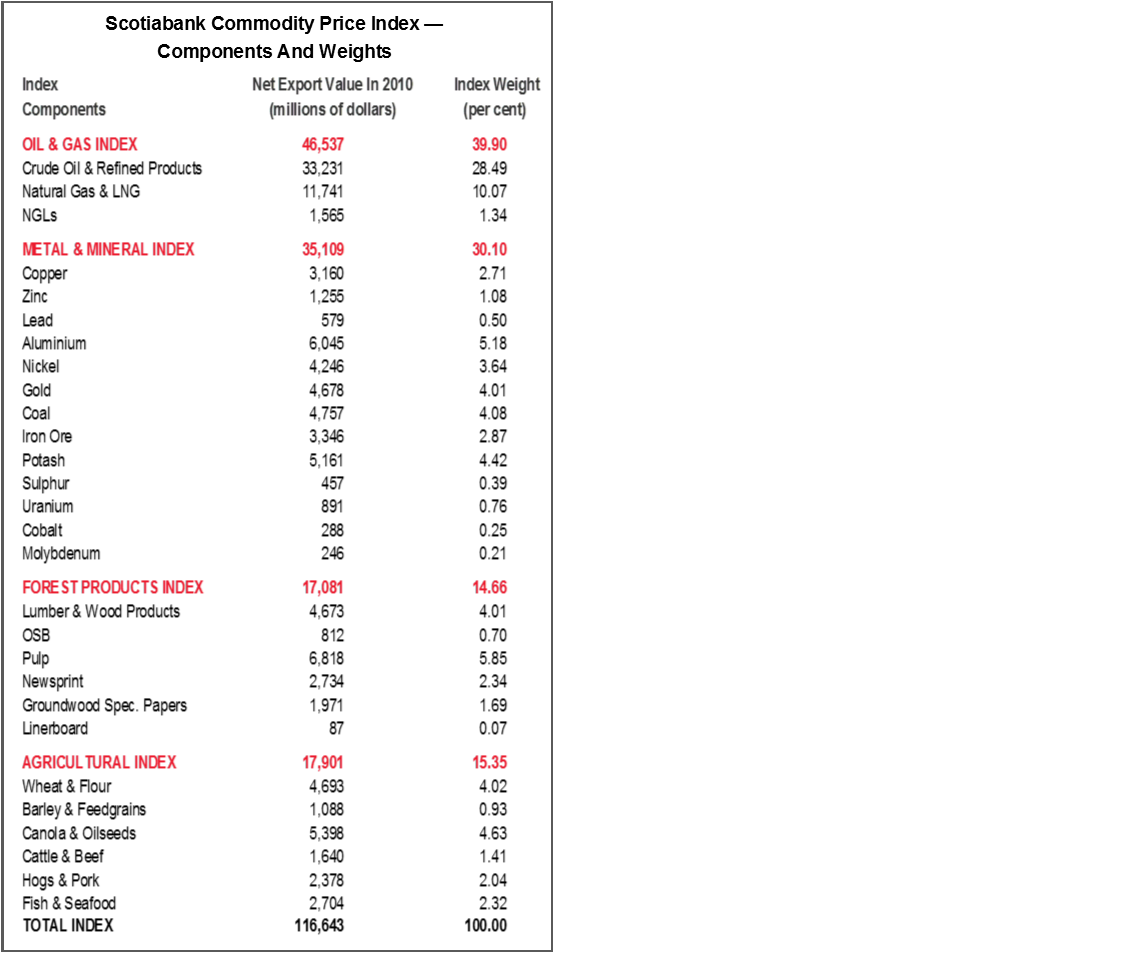
Scotiabank Commodity Price Index — Principal Canadian Exports
January 2007 = 100
This Index has been designed to track the spot or transactions prices paid in U.S. dollars for key Canadian commodities and resource-based manufactured goods in export markets. The weight of each component is based upon its net export value in 2010. Prior to January 2007, the weight of each component was based on its export value in 1995-97, except for crude oil & refined petroleum products, uncoated freesheet paper and linerboard, where net exports were used. Canada imports a significant quantity of these products, and use of their export value alone would have overstated the importance in Canada’s trade performance.
The following prices are included:
OIL & GAS
Crude Oil & Refined Petroleum Products (US$ per bbl) MSW light sweet crude oil at Edmonton (previously Edmonton Par crude) and Western Canadian Select heavy oil at Hardisty, Alberta; price differentials off WTI near-by futures from Bloomberg.
Natural Gas (US$ per mcf) Average export price quoted by the National Energy Board.
Natural Gas Liquids (NGLs – Propane, Butane, Ethane & Pentanes-Plus) (US$ per bbl), Propane at Edmonton & Sarnia.
METALS & MINERALS
Copper & Products (US$ per lb) LME official cash settlement price for grade A copper.
Zinc (US$ per lb) LME SHG cash settlement: prior to Sept 1990, U.S. producers’ price for high-grade zinc delivered.
Lead (US$ per lb) LME official cash settlement price; prior to Jan. 1991, U.S. producers’ price for common grade delivered.
Aluminium & Products (US$ per lb) since 1979, LME official cash settlement price.
Nickel (US$ per lb) since 1980, LME official cash settlement price.
Gold (US$ per oz) ‘LBMA Gold Price PM’ as of March 20, 2015.
Potash (US$ per tonne) Standard potassium chloride, spot price, FOB Vancouver.
Sulphur (US$ per tonne) Solid, spot price, FOB Vancouver.
Metallurgical Coal (US$ per tonne) Contract price for premium-grade hard coking coal, FOB Vancouver.
Iron Ore (US cents per dmtu) Spot price fines 62% Fe, CFR Qingdao, China; prior to Jan 2011, term-contract price for concentrates 66% Fe from Labrador/Quebec to Northern Europe (FOB Sept-Iles).
Uranium (US$ per lb) U3O8 near-by-futures from Bloomberg.
Molybdenum (US$ per lb) since March 1992, MW dealer oxide.
Cobalt (US$ per lb) MW dealer price.
FOREST PRODUCTS
Lumber & Wood Products, Western Spruce-Pine-Fir 2x4 No.2 & Btr (US$ per mfbm) FOB mill.
Oriented Strandboard (US$ per thousand sq. ft.), U.S. North Central region, 7/16 inch.
Pulp, Bleached Northern Softwood Kraft (US$ per tonne) Transactions price, delivery USA.
Newsprint (US$ per tonne) Average transactions price, 45 grams, delivery Eastern USA.
Groundwood Specialty Papers (US$ per ton) Supercalendered-A paper, 35 lb., delivery USA.
Linerboard (US$ per ton), delivery Eastern USA with zone discounts.
AGRICULTURE
Wheat & Flour (US$ per tonne), DNS No 1 14% protein Duluth, Minn; prior to April 2011 No.1 CWRS, 13.5% protein at St. Lawrence.
Barley (US$ per tonne), Manitoba Agriculture and Food No. 1 Canadian western barley aggregate spot price; historical data No. 1 at Lethbridge, Alberta.
Canola & Oilseeds (US$ per tonne) No.1 Canada, in store Vancouver.
Cattle & Beef (US$ per cwt) Steers over 1,051 pounds at Toronto; from Jan 1993, Ontario average.
Hogs & Pork (US$ per cwt) 100 Index Hogs at Toronto; from Jan 1993, Ontario average.
Fish & Seafood (US$ per lb) West Coast silver coho salmon; Atlantic lobster prices; prior to 1986 cod fillets & blocks.
DISCLAIMER
This report has been prepared by Scotiabank Economics as a resource for the clients of Scotiabank. Opinions, estimates and projections contained herein are our own as of the date hereof and are subject to change without notice. The information and opinions contained herein have been compiled or arrived at from sources believed reliable but no representation or warranty, express or implied, is made as to their accuracy or completeness. Neither Scotiabank nor any of its officers, directors, partners, employees or affiliates accepts any liability whatsoever for any direct or consequential loss arising from any use of this report or its contents.
These reports are provided to you for informational purposes only. This report is not, and is not constructed as, an offer to sell or solicitation of any offer to buy any financial instrument, nor shall this report be construed as an opinion as to whether you should enter into any swap or trading strategy involving a swap or any other transaction. The information contained in this report is not intended to be, and does not constitute, a recommendation of a swap or trading strategy involving a swap within the meaning of U.S. Commodity Futures Trading Commission Regulation 23.434 and Appendix A thereto. This material is not intended to be individually tailored to your needs or characteristics and should not be viewed as a “call to action” or suggestion that you enter into a swap or trading strategy involving a swap or any other transaction. Scotiabank may engage in transactions in a manner inconsistent with the views discussed this report and may have positions, or be in the process of acquiring or disposing of positions, referred to in this report.
Scotiabank, its affiliates and any of their respective officers, directors and employees may from time to time take positions in currencies, act as managers, co-managers or underwriters of a public offering or act as principals or agents, deal in, own or act as market makers or advisors, brokers or commercial and/or investment bankers in relation to securities or related derivatives. As a result of these actions, Scotiabank may receive remuneration. All Scotiabank products and services are subject to the terms of applicable agreements and local regulations. Officers, directors and employees of Scotiabank and its affiliates may serve as directors of corporations.
Any securities discussed in this report may not be suitable for all investors. Scotiabank recommends that investors independently evaluate any issuer and security discussed in this report, and consult with any advisors they deem necessary prior to making any investment.
This report and all information, opinions and conclusions contained in it are protected by copyright. This information may not be reproduced without the prior express written consent of Scotiabank.
™ Trademark of The Bank of Nova Scotia. Used under license, where applicable.
Scotiabank, together with “Global Banking and Markets”, is a marketing name for the global corporate and investment banking and capital markets businesses of The Bank of Nova Scotia and certain of its affiliates in the countries where they operate, including, Scotiabanc Inc.; Citadel Hill Advisors L.L.C.; The Bank of Nova Scotia Trust Company of New York; Scotiabank Europe plc; Scotiabank (Ireland) Limited; Scotiabank Inverlat S.A., Institución de Banca Múltiple, Scotia Inverlat Casa de Bolsa S.A. de C.V., Scotia Inverlat Derivados S.A. de C.V. – all members of the Scotiabank group and authorized users of the Scotiabank mark. The Bank of Nova Scotia is incorporated in Canada with limited liability and is authorised and regulated by the Office of the Superintendent of Financial Institutions Canada. The Bank of Nova Scotia is authorised by the UK Prudential Regulation Authority and is subject to regulation by the UK Financial Conduct Authority and limited regulation by the UK Prudential Regulation Authority. Details about the extent of The Bank of Nova Scotia's regulation by the UK Prudential Regulation Authority are available from us on request. Scotiabank Europe plc is authorised by the UK Prudential Regulation Authority and regulated by the UK Financial Conduct Authority and the UK Prudential Regulation Authority.
Scotiabank Inverlat, S.A., Scotia Inverlat Casa de Bolsa, S.A. de C.V., and Scotia Derivados, S.A. de C.V., are each authorized and regulated by the Mexican financial authorities.
Not all products and services are offered in all jurisdictions. Services described are available in jurisdictions where permitted by law.