SUMMARY
- Rising COVID-19 Delta variant infections led to financial market volatility this month, but we have raised our forecast for global economic growth and that bodes well for further commodity pricing gains.
- Crude values experienced a brief mid-month dip but remain well-supported and we have increased our price projections.
- We have also revised our industrial metals price outlook higher—most commodities have seen strong year-to-date gains and we still expect limited medium-term supply growth to support copper values.
- Gold prices held steady in July after last month’s hawkish Federal Reserve communications drove declines in June.
- Lumber values have fallen by roughly 70% from the peak established early this year, but housing activity remains constructive for prices.
GLOBAL ECONOMY: INCREMENTAL UPWARD REVISIONS
We raised our forecast for global growth this month. We now anticipate that the global economy will expand by 6.3% in 2021—which would represent the fastest gain since at least 1980 (chart 1)—and 4.5% in 2022. Broadly speaking, data released around the globe continue to suggest that a strong—if sectorally uneven—rebound is underway, and indicators like Purchasing Managers’ Indices still point to expectations of strong growth within the global business sector.

Rising COVID-19 Delta variant infections could present public health challenges and led to broad financial market volatility in July, but we do not anticipate the kind of economic disruption witnessed during prior waves. The apparent benefits of aggressive inoculation efforts—thus far, Delta infections have disproportionately hit the unvaccinated population—anchor our belief in this respect. We do assume a very small variant-related slowdown in Canada in the fall, but one that will be more than offset by stronger growth before and after that.
Inflation continues to come in stronger than the rates targeted by central banks, and the outlook on this front is still uncertain, but we are confident in our view that the pace of recent price gains will prove transitory. Accordingly, we still anticipate that the Bank of Canada will only begin hiking rates in mid-2022, with the US to follow in 2023.
OIL: VARIANT SPREAD SCARES MARKETS, BUT OUTLOOK IMPROVED
Crude values experienced a brief mid-month dip but were otherwise fairly steady; thus far, the July average for Brent is the highest since late 2018 while the monthly mean for WTI is the best since 2014. Initial market reaction to OPEC+’s agreement to boost supply beginning in August left both light oil benchmarks below 70 USD/bbl early last week. Anxiety about Delta-variant-induced demand weakness—particularly in major importers China and India, which recently reported softer data—also hangs over markets, and there were reports of investors unwinding long positions in July.
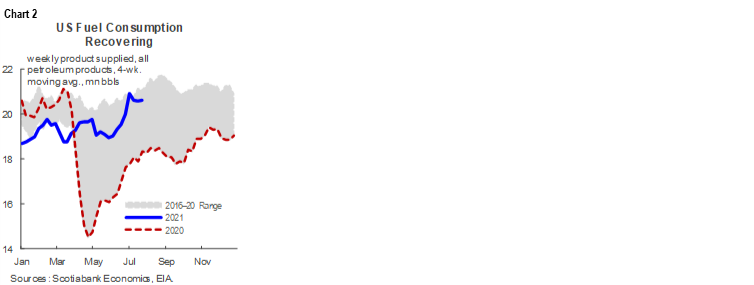
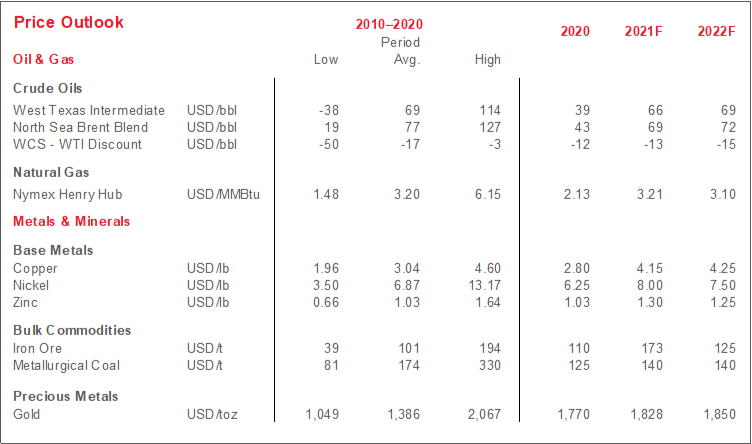
Yet, the fundamentals remain supportive and we have revised our outlook for Brent and WTI higher despite near-term risks. In the US, fuel demand is recovering (chart 2) as travel activity rises. OECD crude stocks are at the bottom of their five-year range, and the EIA reported a 4.1 mn barrel draw in inventories in the week to July 23, 2021. That left US crude stocks at their lowest level since January 2020. In the medium-term, a new US-Iran nuclear deal would bring new barrels online and contribute to looser market balances. However, we also anticipate that US shale producers will maintain capital discipline and there are limited numbers of major oil projects in the pipeline. All told, we expect WTI to average 66 USD/bbl this year and 69 USD/bbl next year; for Brent, we forecast 69 USD/bbl and 72 USD/bbl in 2021 and 2022, respectively.
WCS is benefiting from the same demand-side factors as its light benchmark cousins, but we suspect that its discount to WTI will widen over the next year. Alberta oil production has returned to 2019 levels and, as of May 2021, was up a hefty 16% y/y in that month (chart 3), encouraged by pricing gains and assisted by the end of the provincial government’s curtailment policy as of late last year. We expect this trend to continue as the year progresses, with some additional pressure on the light-heavy discount if OPEC+ production increases improve heavy oil availability in the US Gulf Coast—the primary destination of marginal Canadian barrels. The Line 3 pipeline—construction of which is progressing well—should provide new egress capacity and a partial offset to these forces when it comes online later this year.

INDUSTRIAL METALS: SUPERCYCLE CONTINUES
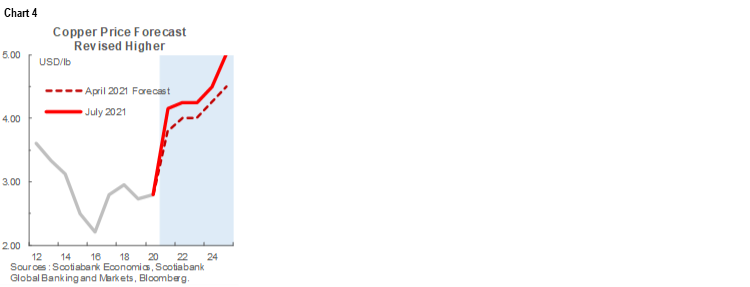
Copper prices eased in July relative to the prior month, but remain near the all-time highs established earlier this year; we still expect values for the red metal to be very well-supported in the next several years (chart 4). Despite the latest demand-side fears related to the Delta variant, a strong global economic recovery—anchored by significant stimulus and construction activity—should continue to put upward pressure on values for the bellwether red metal. Recent flooding in China—responsible for about half of global consumption—has also raised the possibility of strong infrastructure rebuild-related copper consumption. On the supply side, we expect Latin American mine disruptions to ease as vaccination rates rise, but limited major project activity should contribute to medium-term market tightness.
Prices for 62% iron ore have likewise fallen from all-time highs during the recent decline in risk sentiment, but have still hovered at historically elevated levels above 200 USD/t. Steel production—a process for which iron ore is a key ingredient—remained strong in the first half of this year, and Australian and Latin American supply constraints remain in place. Stronger-than-previously anticipated year-to-date prices provide a strong handoff for iron ore for the rest of this year. However, we still expect that values for the metal are unsustainably high and should cool over time as output from key producers ramps up.
We have upgraded our 2021 price forecasts for other key industrial metals nickel and zinc in part due to the strength of year-to-date demand, but supply-side expectations still look less supportive. Our projections continue to assume that supply growth will keep the global zinc market in a surplus position for the next several years. Meanwhile, nickel producers will likely have to grapple with the loosening impact of rising Indonesian nickel pig iron output and new technology that allows for greater production of nickel matte for use in batteries. Still, the use of these metals and copper in various green energy applications implies solid demand over the medium-term.
BULLION PRICES HOLD STEADY
Gold prices had a relatively stable month following June’s hawkish US monetary policy communications. Bullion values continued to hover near the 1,800 USD/oz mark throughout much of July and were little changed in the immediate aftermath of yesterday’s Federal Reserve statement, which came in largely as expected. We anticipate that values for the yellow metal will remain rangebound for the next two years amid still-uncertain economic conditions and accommodative monetary policy.
LUMBER PRICES CONTINUE TO CORRECT
After setting record highs earlier this year, lumber prices have plunged to a range more in line with recent historical averages (chart 5). Declines look to be linked to output growth and inventory replenishment—weakness in which drove the prior price surge—while buying appears to have been supplanted by efforts to unwind product purchased earlier at higher prices. All else equal, the outlook for renovation spending is less sanguine with reopening proceeding and transfers to households set to wind down in Canada and the US. Yet, new construction activity should remain supportive for North American lumber prices—our latest forecast continues to assume that US housing starts will hit post-GFC highs in the coming year. Early data suggest that forest fires raging in BC and the Pacific Northwest have generated some modest upward price pressure as well.


TECHNICAL NOTE
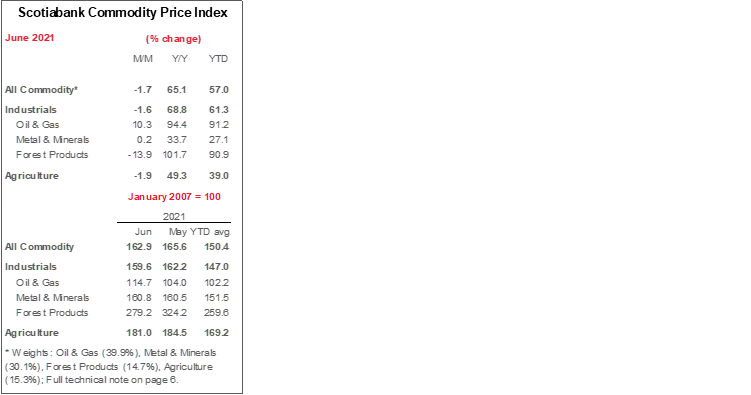
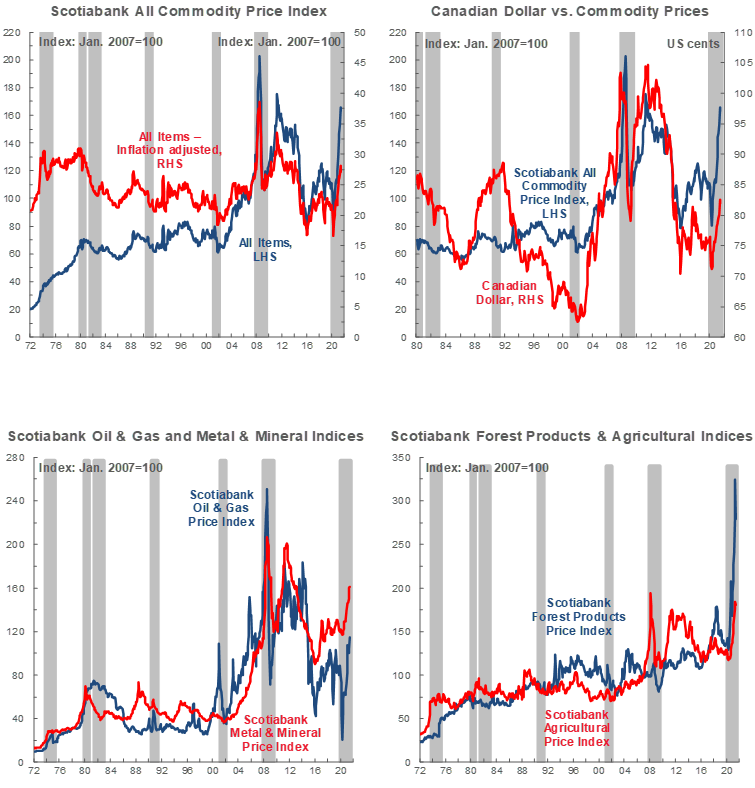
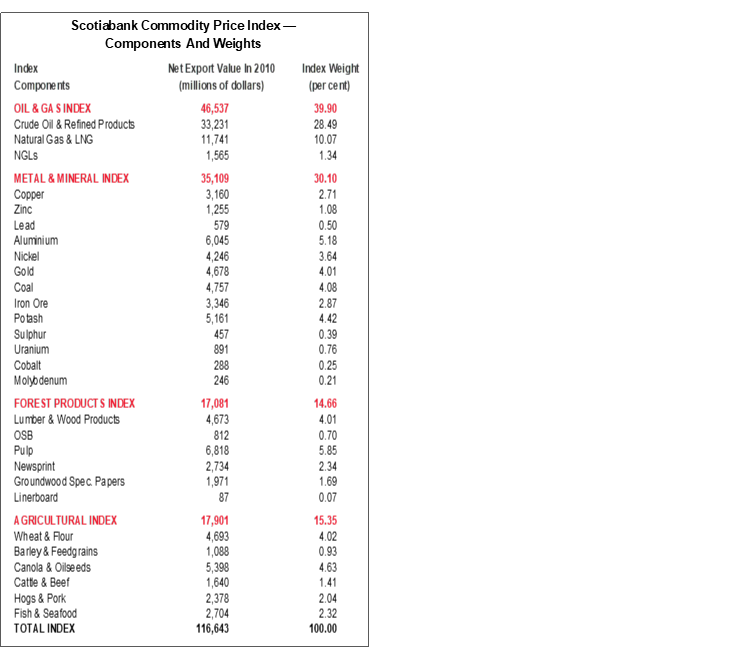
Scotiabank Commodity Price Index — Principal Canadian Exports
January 2007 = 100
This Index has been designed to track the spot or transactions prices paid in U.S. dollars for key Canadian commodities and resource-based manufactured goods in export markets. The weight of each component is based upon its net export value in 2010. Prior to January 2007, the weight of each component was based on its export value in 1995-97, except for crude oil & refined petroleum products, uncoated freesheet paper and linerboard, where net exports were used. Canada imports a significant quantity of these products, and use of their export value alone would have overstated the importance in Canada’s trade performance.
The following prices are included:
OIL & GAS
Crude Oil & Refined Petroleum Products (US$ per bbl) MSW light sweet crude oil at Edmonton (previously Edmonton Par crude) and Western Canadian Select heavy oil at Hardisty, Alberta; price differentials off WTI near-by futures from Bloomberg.
Natural Gas (US$ per mcf) Average export price quoted by the National Energy Board.
Natural Gas Liquids (NGLs – Propane, Butane, Ethane & Pentanes-Plus) (US$ per bbl), Propane at Edmonton & Sarnia.
METALS & MINERALS
Copper & Products (US$ per lb) LME official cash settlement price for grade A copper.
Zinc (US$ per lb) LME SHG cash settlement: prior to Sept 1990, U.S. producers’ price for high-grade zinc delivered.
Lead (US$ per lb) LME official cash settlement price; prior to Jan. 1991, U.S. producers’ price for common grade delivered.
Aluminium & Products (US$ per lb) since 1979, LME official cash settlement price.
Nickel (US$ per lb) since 1980, LME official cash settlement price.
Gold (US$ per oz) ‘LBMA Gold Price PM’ as of March 20, 2015.
Potash (US$ per tonne) Standard potassium chloride, spot price, FOB Vancouver.
Sulphur (US$ per tonne) Solid, spot price, FOB Vancouver.
Metallurgical Coal (US$ per tonne) Contract price for premium-grade hard coking coal, FOB Vancouver.
Iron Ore (US cents per dmtu) Spot price fines 62% Fe, CFR Qingdao, China; prior to Jan 2011, term-contract price for concentrates 66% Fe from Labrador/Quebec to Northern Europe (FOB Sept-Iles).
Uranium (US$ per lb) U3O8 near-by-futures from Bloomberg.
Molybdenum (US$ per lb) since March 1992, MW dealer oxide.
Cobalt (US$ per lb) MW dealer price.
FOREST PRODUCTS
Lumber & Wood Products, Western Spruce-Pine-Fir 2x4 No.2 & Btr (US$ per mfbm) FOB mill.
Oriented Strandboard (US$ per thousand sq. ft.), U.S. North Central region, 7/16 inch.
Pulp, Bleached Northern Softwood Kraft (US$ per tonne) Transactions price, delivery USA.
Newsprint (US$ per tonne) Average transactions price, 45 grams, delivery Eastern USA.
Groundwood Specialty Papers (US$ per ton) Supercalendered-A paper, 35 lb., delivery USA.
Linerboard (US$ per ton), delivery Eastern USA with zone discounts.
AGRICULTURE
Wheat & Flour (US$ per tonne), DNS No 1 14% protein Duluth, Minn; prior to April 2011 No.1 CWRS, 13.5% protein at St. Lawrence.
Barley (US$ per tonne), Manitoba Agriculture and Food No. 1 Canadian western barley aggregate spot price; historical data No. 1 at Lethbridge, Alberta.
Canola & Oilseeds (US$ per tonne) No.1 Canada, in store Vancouver.
Cattle & Beef (US$ per cwt) Steers over 1,051 pounds at Toronto; from Jan 1993, Ontario average.
Hogs & Pork (US$ per cwt) 100 Index Hogs at Toronto; from Jan 1993, Ontario average.
Fish & Seafood (US$ per lb) West Coast silver coho salmon; Atlantic lobster prices; prior to 1986 cod fillets & blocks.
DISCLAIMER
This report has been prepared by Scotiabank Economics as a resource for the clients of Scotiabank. Opinions, estimates and projections contained herein are our own as of the date hereof and are subject to change without notice. The information and opinions contained herein have been compiled or arrived at from sources believed reliable but no representation or warranty, express or implied, is made as to their accuracy or completeness. Neither Scotiabank nor any of its officers, directors, partners, employees or affiliates accepts any liability whatsoever for any direct or consequential loss arising from any use of this report or its contents.
These reports are provided to you for informational purposes only. This report is not, and is not constructed as, an offer to sell or solicitation of any offer to buy any financial instrument, nor shall this report be construed as an opinion as to whether you should enter into any swap or trading strategy involving a swap or any other transaction. The information contained in this report is not intended to be, and does not constitute, a recommendation of a swap or trading strategy involving a swap within the meaning of U.S. Commodity Futures Trading Commission Regulation 23.434 and Appendix A thereto. This material is not intended to be individually tailored to your needs or characteristics and should not be viewed as a “call to action” or suggestion that you enter into a swap or trading strategy involving a swap or any other transaction. Scotiabank may engage in transactions in a manner inconsistent with the views discussed this report and may have positions, or be in the process of acquiring or disposing of positions, referred to in this report.
Scotiabank, its affiliates and any of their respective officers, directors and employees may from time to time take positions in currencies, act as managers, co-managers or underwriters of a public offering or act as principals or agents, deal in, own or act as market makers or advisors, brokers or commercial and/or investment bankers in relation to securities or related derivatives. As a result of these actions, Scotiabank may receive remuneration. All Scotiabank products and services are subject to the terms of applicable agreements and local regulations. Officers, directors and employees of Scotiabank and its affiliates may serve as directors of corporations.
Any securities discussed in this report may not be suitable for all investors. Scotiabank recommends that investors independently evaluate any issuer and security discussed in this report, and consult with any advisors they deem necessary prior to making any investment.
This report and all information, opinions and conclusions contained in it are protected by copyright. This information may not be reproduced without the prior express written consent of Scotiabank.
™ Trademark of The Bank of Nova Scotia. Used under license, where applicable.
Scotiabank, together with “Global Banking and Markets”, is a marketing name for the global corporate and investment banking and capital markets businesses of The Bank of Nova Scotia and certain of its affiliates in the countries where they operate, including; Scotiabank Europe plc; Scotiabank (Ireland) Designated Activity Company; Scotiabank Inverlat S.A., Institución de Banca Múltiple, Grupo Financiero Scotiabank Inverlat, Scotia Inverlat Casa de Bolsa, S.A. de C.V., Grupo Financiero Scotiabank Inverlat, Scotia Inverlat Derivados S.A. de C.V. – all members of the Scotiabank group and authorized users of the Scotiabank mark. The Bank of Nova Scotia is incorporated in Canada with limited liability and is authorised and regulated by the Office of the Superintendent of Financial Institutions Canada. The Bank of Nova Scotia is authorized by the UK Prudential Regulation Authority and is subject to regulation by the UK Financial Conduct Authority and limited regulation by the UK Prudential Regulation Authority. Details about the extent of The Bank of Nova Scotia's regulation by the UK Prudential Regulation Authority are available from us on request. Scotiabank Europe plc is authorized by the UK Prudential Regulation Authority and regulated by the UK Financial Conduct Authority and the UK Prudential Regulation Authority.
Scotiabank Inverlat, S.A., Scotia Inverlat Casa de Bolsa, S.A. de C.V, Grupo Financiero Scotiabank Inverlat, and Scotia Inverlat Derivados, S.A. de C.V., are each authorized and regulated by the Mexican financial authorities.
Not all products and services are offered in all jurisdictions. Services described are available in jurisdictions where permitted by law.