SUMMARY
The near-term economic outlook has weakened due to new restrictions in response to the COVID-19 pandemic’s second wave, but that has not yet filtered into commodity pricing.
There is potential for recent oil price momentum to ease in the current quarter given a softer demand outlook and OPEC+ uncertainty.
The Keystone XL (KXL) pipeline’s demise is clearly negative for local employment and investment activity, but should not on its own alter long-run supply-demand balances or pricing for Western Canadian oil.
Industrial metals prices continue to reach new heights, boosted by country-specific demand-supply pressures.
Lumber prices remain elevated, supported by robust US homebuilding.
GLOBAL ECONOMY: SMOOTH SAILING TO FOLLOW CHOPPY WATERS
The trajectory of COVID-19 remains the principal risk to the global economy as well as to commodity pricing; on this front, the outlook has become more bearish. Exponential growth in COVID-19 cases has prompted stricter containment measures across much of the world, and we have therefore revised our economic forecasts lower for the first quarter of 2021. Rising infections and hospitalizations appear to be related to pandemic fatigue, holiday period travel, and perhaps the evolution of more contagious virus strains.
We anticipate better outcomes beyond the first quarter of this year. This reflects expectations that more widespread vaccination and eventual curve-flattening result in economies reopening, boosting growth beyond what we had pencilled in as of our previous forecast. We are also encouraged by US President Biden’s announcement of new fiscal stimulus measures, which we expect to ramp up as this year progresses.
PIPELINE’S DEMISE OVERSHADOWS IMPROVED OIL AND GAS OUTLOOK
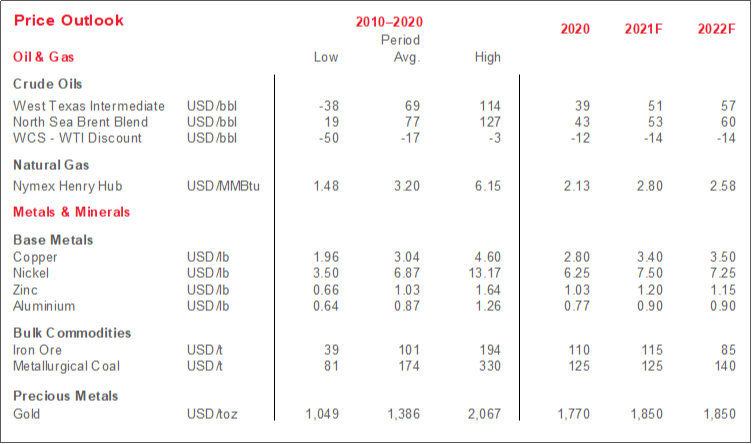
Our updated Scotiabank Economics-Global Banking and Markets oil price outlook mirrors changes to the global economic backdrop. We’ve raised our 2021 Brent and WTI forecasts by 2–3 USD/bbl (table, p.4), largely due to earlier-than-expected vaccine rollout that lifted prices coming into this year. We assume some near-term softness that reflects an uncertain demand outlook—we expect WTI to average about 46 USD/bbl in Q1-2021 versus the 52–53 USD/bbl range of the last two weeks. Given recent price gains, we also suspect that OPEC+ quota compliance will be tested in the coming months, which could add to already very oversupplied global market balances. We foresee crude price gains and an erosion of that glut beginning in H2-2021 as vaccination becomes widespread.
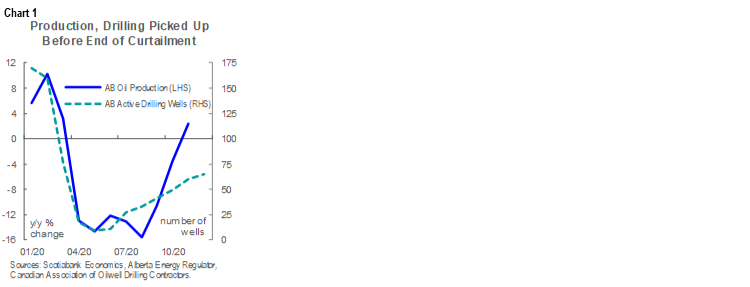
We anticipate an incrementally wider WCS discount to WTI in the first half of this year largely because Alberta oil production is rising. The provincial government has ended its curtailment program as of the end of 2020, but the province’s crude output had already registered a y/y increase in November as producers responded to recent price gains (chart 1, p.1). The WCS-WTI differential should tighten later this year as turnaround season begins, Enbridge’s Line 3 adds egress capacity, and US Gulf Coast Refinery activity continues to recover from unseasonably low levels. Pricing for Western Canadian barrels also benefited last year from limited heavy oil availability in the USGC, an effect we expect to wane over the medium-term as OPEC+ production picks up.
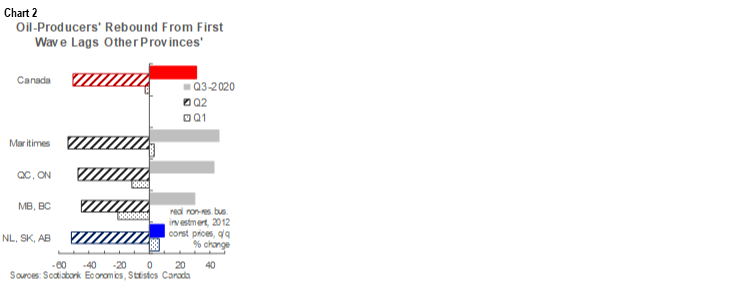
KXL’s cancellation—signalled during the US presidential election campaign—is clearly negative for employment and investment activity in Alberta and the three US states it would have crossed. The Alberta government estimated that KXL would create 2,000 construction jobs, add CAD 2.4 bn to Canadian GDP, and generate CAD 30 bn in taxation and royalty revenues over its lifetime. The end of the project looks likely to reinforce the lagging investment recovery among Canada’s oil-producing provinces (chart 2). KXL’s demise also has the potential to discourage investment that would have sought to increase capacity in light of the longer-run opportunities of having the three pipelines.
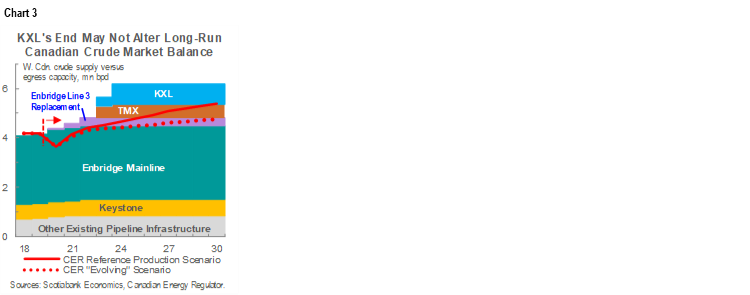
The project’s impact on long-run oil market balances and pricing is less clear. The principal benefit of pipelines is that they increase the capacity for Western Canadian crude to be transported to its primary marginal consumers—refineries in the US Gulf Coast. Before the pandemic, we argued that only two of the three major pipeline projects (KXL, Line 3, Trans Mountain Extension (TMX)) were needed to align supply and demand of crude volumes by the end of this decade. More recent oil output projections from the Canadian Energy Regulator appear to confirm that view (chart 3)—both in the “evolving” scenario that incorporates more aggressive global decarbonization, and in the more optimistic reference production case.
INDUSTRIAL METALS RISE FURTHER INTO THE STRATOSPHERE
Copper’s torrid ascent continues, and has prompted a significant increase to our price deck. The red metal rose as high as 3.70 USD/lb this month—the highest level since 2011—still anchored by a buoyant economic recovery in China—the world’s largest consumer. Diminished industrial activity related to the Lunar New Year holiday and any additional COVID-19 outbreaks may hold back further gains in the immediate near-term. Still, we expect copper prices to average 3.40 USD/lb this year—40 cents higher than our prior forecasts—and climb steadily to 3.60 USD/lb by 2023 as a stimulus-led global rebound reinforces steady Chinese demand. Beyond 2023, we expect limited capacity expansion and hefty demand via the forthcoming decarbonization shift to make copper a hot commodity.
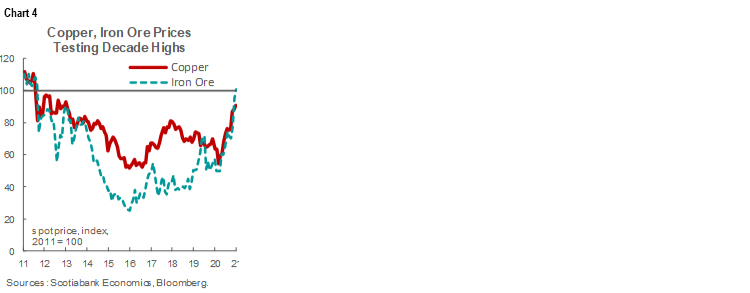
Voracious Chinese demand and ongoing supply constraints have also led us to raise our forecasts for iron ore prices—likewise at their highest levels since 2011 (chart 4). Steel output—for which iron ore is a key input—in the People’s Republic continues to climb; combined with only modest increases in iron ore production—notably in Brazil—this makes for very tight conditions. We anticipate that tightness will abate as output notches higher and there is some ongoing speculative activity in the market that we expect to dwindle. Still, we foresee an average iron ore price of 115 USD/t in 2021—35% higher than as of our last quarterly forecast update.
Following a year characterized by significant volatility, gold prices appear to be steadying. Bullion closed as low as 1,474 USD/oz (in late March) and as high as 2,067 USD/oz (in early August) in 2020. Second wave restrictions do not look to have had a significant effect on pricing thus far, and we anticipate much more stability this year with US Federal Reserve policy locked in and consumption likely to rise gradually as the global recovery eventually takes hold. Nonetheless, the 1,850 USD/oz annual average we have penciled in for 2021–22 would be among the highest in recorded history, a fact which reflects rock-bottom interest rates and a still-uncertain economic backdrop.
PANDEMIC-RELATED PREFERENCES SUPPORT FOREST PRODUCT VALUES
Lumber prices remain elevated. The Random Lengths North American Framing Lumber Composite Index has lost some ground since it breached 950 USD/Mfbm last fall, but is still hovering about 500 USD (over 50%) higher than year-earlier levels. For the year 2021, we anticipate an average WSPF price near 550 USD/Mfbm—near last year’s record high annual mean.
We expect robust US homebuilding to continue to drive demand for lumber. The 1.669 mn (saar) American housing starts reported last month were the most in any month since 2006, and completed the strongest year since 2006—underscoring the housing market’s resilience in the face of a severe economic downturn. This year, we anticipate even stronger residential construction activity (chart 5), anchored by rock-bottom mortgage rates. The pandemic also appears to have engendered a stronger preference for larger, self-contained single-family homes—a trend we’ve also observed in Canada—whose construction is more lumber-intensive than that of multi-unit dwellings. Supply responses to that demand will likely be limited given ongoing British Columbia cutting restrictions and if second-wave lockdowns reduce labour availability.

Pulp prices are also very well-supported. After hovering in the 200–300 USD/Msf range for much of 2020, the OSB price in the North Central region has averaged more than 600 USD/Msf in each of the last six months, testing record highs. Prices for Kraft pulp—used in tissue paper and packaging materials—are also historically elevated. The material is in high demand amid a pandemic-induced shift to e-commerce.
TECHNICAL NOTE
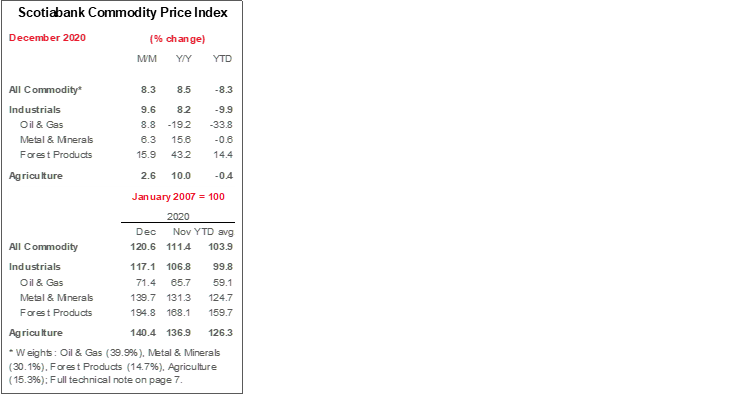
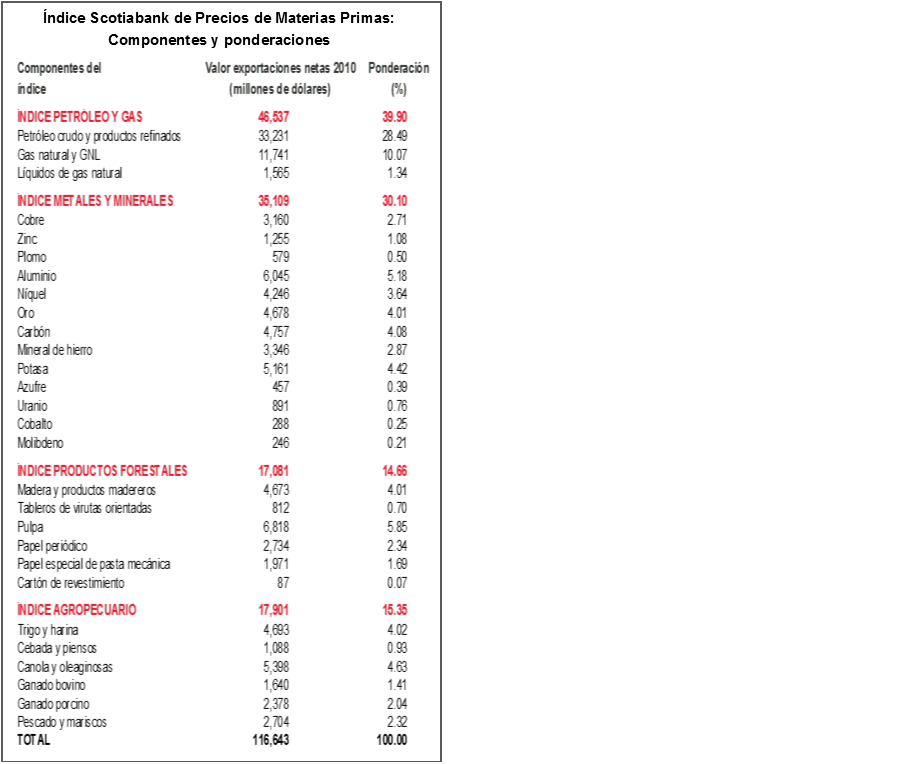
Scotiabank Commodity Price Index — Principal Canadian Exports
January 2007 = 100
This Index has been designed to track the spot or transactions prices paid in U.S. dollars for key Canadian commodities and resource-based manufactured goods in export markets. The weight of each component is based upon its net export value in 2010. Prior to January 2007, the weight of each component was based on its export value in 1995-97, except for crude oil & refined petroleum products, uncoated freesheet paper and linerboard, where net exports were used. Canada imports a significant quantity of these products, and use of their export value alone would have overstated the importance in Canada’s trade performance.
The following prices are included:
OIL & GAS
Crude Oil & Refined Petroleum Products (US$ per bbl) MSW light sweet crude oil at Edmonton (previously Edmonton Par crude) and Western Canadian Select heavy oil at Hardisty, Alberta; price differentials off WTI near-by futures from Bloomberg.
Natural Gas (US$ per mcf) Average export price quoted by the National Energy Board.
Natural Gas Liquids (NGLs – Propane, Butane, Ethane & Pentanes-Plus) (US$ per bbl), Propane at Edmonton & Sarnia.
METALS & MINERALS
Copper & Products (US$ per lb) LME official cash settlement price for grade A copper.
Zinc (US$ per lb) LME SHG cash settlement: prior to Sept 1990, U.S. producers’ price for high-grade zinc delivered.
Lead (US$ per lb) LME official cash settlement price; prior to Jan. 1991, U.S. producers’ price for common grade delivered.
Aluminium & Products (US$ per lb) since 1979, LME official cash settlement price.
Nickel (US$ per lb) since 1980, LME official cash settlement price.
Gold (US$ per oz) ‘LBMA Gold Price PM’ as of March 20, 2015.
Potash (US$ per tonne) Standard potassium chloride, spot price, FOB Vancouver.
Sulphur (US$ per tonne) Solid, spot price, FOB Vancouver.
Metallurgical Coal (US$ per tonne) Contract price for premium-grade hard coking coal, FOB Vancouver.
Iron Ore (US cents per dmtu) Spot price fines 62% Fe, CFR Qingdao, China; prior to Jan 2011, term-contract price for concentrates 66% Fe from Labrador/Quebec to Northern Europe (FOB Sept-Iles).
Uranium (US$ per lb) U3O8 near-by-futures from Bloomberg.
Molybdenum (US$ per lb) since March 1992, MW dealer oxide.
Cobalt (US$ per lb) MW dealer price.
FOREST PRODUCTS
Lumber & Wood Products, Western Spruce-Pine-Fir 2x4 No.2 & Btr (US$ per mfbm) FOB mill.
Oriented Strandboard (US$ per thousand sq. ft.), U.S. North Central region, 7/16 inch.
Pulp, Bleached Northern Softwood Kraft (US$ per tonne) Transactions price, delivery USA.
Newsprint (US$ per tonne) Average transactions price, 45 grams, delivery Eastern USA.
Groundwood Specialty Papers (US$ per ton) Supercalendered-A paper, 35 lb., delivery USA.
Linerboard (US$ per ton), delivery Eastern USA with zone discounts.
AGRICULTURE
Wheat & Flour (US$ per tonne), DNS No 1 14% protein Duluth, Minn; prior to April 2011 No.1 CWRS, 13.5% protein at St. Lawrence.
Barley (US$ per tonne), Manitoba Agriculture and Food No. 1 Canadian western barley aggregate spot price; historical data No. 1 at Lethbridge, Alberta.
Canola & Oilseeds (US$ per tonne) No.1 Canada, in store Vancouver.
Cattle & Beef (US$ per cwt) Steers over 1,051 pounds at Toronto; from Jan 1993, Ontario average.
Hogs & Pork (US$ per cwt) 100 Index Hogs at Toronto; from Jan 1993, Ontario average.
Fish & Seafood (US$ per lb) West Coast silver coho salmon; Atlantic lobster prices; prior to 1986 cod fillets & blocks.
DISCLAIMER
This report has been prepared by Scotiabank Economics as a resource for the clients of Scotiabank. Opinions, estimates and projections contained herein are our own as of the date hereof and are subject to change without notice. The information and opinions contained herein have been compiled or arrived at from sources believed reliable but no representation or warranty, express or implied, is made as to their accuracy or completeness. Neither Scotiabank nor any of its officers, directors, partners, employees or affiliates accepts any liability whatsoever for any direct or consequential loss arising from any use of this report or its contents.
These reports are provided to you for informational purposes only. This report is not, and is not constructed as, an offer to sell or solicitation of any offer to buy any financial instrument, nor shall this report be construed as an opinion as to whether you should enter into any swap or trading strategy involving a swap or any other transaction. The information contained in this report is not intended to be, and does not constitute, a recommendation of a swap or trading strategy involving a swap within the meaning of U.S. Commodity Futures Trading Commission Regulation 23.434 and Appendix A thereto. This material is not intended to be individually tailored to your needs or characteristics and should not be viewed as a “call to action” or suggestion that you enter into a swap or trading strategy involving a swap or any other transaction. Scotiabank may engage in transactions in a manner inconsistent with the views discussed this report and may have positions, or be in the process of acquiring or disposing of positions, referred to in this report.
Scotiabank, its affiliates and any of their respective officers, directors and employees may from time to time take positions in currencies, act as managers, co-managers or underwriters of a public offering or act as principals or agents, deal in, own or act as market makers or advisors, brokers or commercial and/or investment bankers in relation to securities or related derivatives. As a result of these actions, Scotiabank may receive remuneration. All Scotiabank products and services are subject to the terms of applicable agreements and local regulations. Officers, directors and employees of Scotiabank and its affiliates may serve as directors of corporations.
Any securities discussed in this report may not be suitable for all investors. Scotiabank recommends that investors independently evaluate any issuer and security discussed in this report, and consult with any advisors they deem necessary prior to making any investment.
This report and all information, opinions and conclusions contained in it are protected by copyright. This information may not be reproduced without the prior express written consent of Scotiabank.
™ Trademark of The Bank of Nova Scotia. Used under license, where applicable.
Scotiabank, together with “Global Banking and Markets”, is a marketing name for the global corporate and investment banking and capital markets businesses of The Bank of Nova Scotia and certain of its affiliates in the countries where they operate, including; Scotiabank Europe plc; Scotiabank (Ireland) Designated Activity Company; Scotiabank Inverlat S.A., Institución de Banca Múltiple, Grupo Financiero Scotiabank Inverlat, Scotia Inverlat Casa de Bolsa, S.A. de C.V., Grupo Financiero Scotiabank Inverlat, Scotia Inverlat Derivados S.A. de C.V. – all members of the Scotiabank group and authorized users of the Scotiabank mark. The Bank of Nova Scotia is incorporated in Canada with limited liability and is authorised and regulated by the Office of the Superintendent of Financial Institutions Canada. The Bank of Nova Scotia is authorized by the UK Prudential Regulation Authority and is subject to regulation by the UK Financial Conduct Authority and limited regulation by the UK Prudential Regulation Authority. Details about the extent of The Bank of Nova Scotia's regulation by the UK Prudential Regulation Authority are available from us on request. Scotiabank Europe plc is authorized by the UK Prudential Regulation Authority and regulated by the UK Financial Conduct Authority and the UK Prudential Regulation Authority.
Scotiabank Inverlat, S.A., Scotia Inverlat Casa de Bolsa, S.A. de C.V, Grupo Financiero Scotiabank Inverlat, and Scotia Inverlat Derivados, S.A. de C.V., are each authorized and regulated by the Mexican financial authorities.
Not all products and services are offered in all jurisdictions. Services described are available in jurisdictions where permitted by law.