SUMMARY
Good news on the COVID-19 vaccine front and apparent progress in US fiscal stimulus negotiations continue to engender optimism about the strength of the global recovery and lift commodity prices.
Our revised global economic outlook assumes more muted growth next quarter in light of surging virus infections around the world, with better prospects thereafter as immunization becomes more widespread.
Base metals prices continue to reach new heights—lifted by Chinese industrial activity and supply concerns in Latin America—a striking turnaround from early-year troughs in the peak lockdown period.
Benefiting from good vaccine news and US stimulus hopes, WTI reached its highest level since before the Saudi-Russian price war began; WCS is trending higher, while its discount to WTI is widening.
GLOBAL OUTLOOK—NEAR-TERM PAIN, 2021 GAIN
The ongoing surge in COVID-19 cases in North America and Europe is clearly a blow to the global outlook and ultimately to demand for most commodities. Containment measures remain less all-encompassing than those imposed during the first wave, but have still prompted a downward revision to our growth forecasts for Q4-2020 and Q1-2021.
On the other hand, we have upgraded our economic forecasts beyond Q1-2021 on the basis of accelerated vaccine approval and rollout. Financial markets appear to be placing greater weight on this good news, and risk sentiment continues to broadly improve. Our latest projections also assume some US fiscal support next year based on bipartisan guidance. On this front and on the timing for widespread inoculation, there is some potential for gains beyond what we have assumed.
Mutation of the COVID-19 virus presents a new risk. Further testing and data collection will determine what newly discovered strands mean for vaccine efficacy and containment efforts; at the time of writing, related restrictions had led to some risk-off mood and softness in prices for some commodities.
MORE METALS PRICE MOMENTUM BUILDING TO CLOSE OUT THE YEAR
It has been an extraordinary year for copper, and the promise of a US fiscal stimulus package has sent the red metal’s price even higher (chart 1). A climb above 3.60 USD/lb put it at the highest level since early 2013, on pace for an annual gain of almost 2%—a result that would have been unthinkable at the peak lockdown period in April when it sat just above 2 USD/lb. Considered a bellwether of global economic activity given its heavy use in the industrial sector, copper continues to benefit from sentiment that the global economy is turning a corner. Yet regional factors remain the principal drivers of the metal’s rise. These include a robust recovery in China—the world’s largest metals consumer—and supply disruption fears in Chile and Peru—key mining jurisdictions.
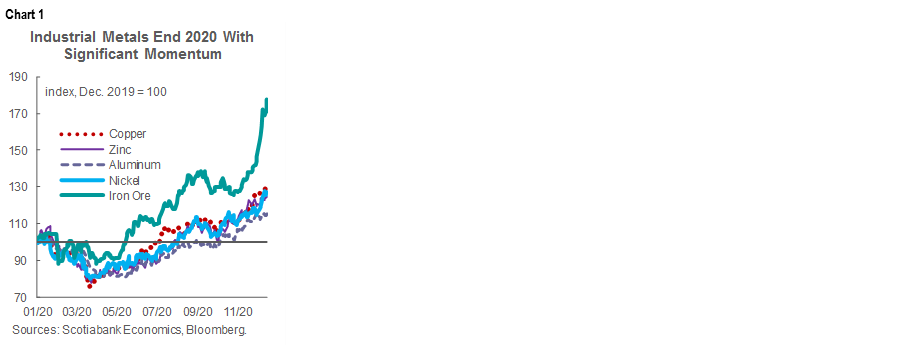
Other base metals remain well-supported. Thus far in December, zinc, nickel, and aluminum prices are all averaging more than 4% higher than in the prior month, and are all up over 40% versus the lows reached in April.
Iron ore prices are trading at their highest levels since 2011. A key ingredient in steelmaking, the metal continues to rise as impressive industrial sector readings come out of the Middle Kingdom. This month, particularly steep gains relate fundamentally to lower output guidance from mining giant Vale, which the market anticipates will contribute to further demand-supply tightness. Over the last several months, price growth has helped mitigate key iron ore producer Australia’s losses from Chinese import bans on farm products and thermal coal. Against that backdrop, China has turned to other markets to meet its iron ore needs—often at greater cost—Canada’s Teck Resources recently reported higher sales to China at higher prices than Australia was getting for its product.
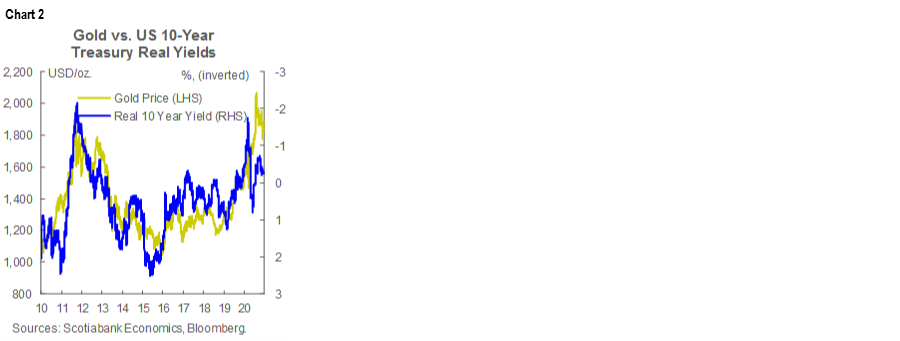
Since closing just above 1,760 USD/oz to end November, bullion hovered near 1,850 USD for much of December. Expectations that US monetary policy will remain accommodative for the next several years—the Federal Reserve reiterated guidance to this effect last week—continues to support the yellow metal. Recent softness in the US dollar has likely offered a further boost, and gold price movements continue to roughly mirror US real rates (chart 2). Bullion also jumped late last week when stimulus negotiations looked to have hit a stumbling block.
OIL TESTING NEW HEIGHTS
WTI has also been a major beneficiary of good vaccine news and US stimulus hopes, last week climbing above 49 USD/bbl—the highest level since before the early-year Saudi-Russian price war began. Inventories at the important Cushing, Oklahoma hub have also eased in three of the past four weeks. WTI is on pace to fall by just over 30% in 2020—slightly better than the 38% plunge at the height of the GFC in 2008, and considerably more modest than the 48% crash witnessed in 2015. The more moderate annual drop this year—which included an unprecedented negative close in April—speaks to the profound but relatively short-lived economic trough associated with the pandemic.
Alongside COVID-19 developments, oil prices’ near-term paths will be heavily influenced by OPEC+ decision making. The group’s pact to lower production by an unprecedented 9.7 mn bpd—signalled in April and in effect as of May— contributed significantly to the rally in crude values that began earlier this year. Building on those measures, the bloc agreed this month to reduce production cuts by 500k bpd in January 2021, a target far less than the 2 mn bpd reduction initially discussed. The global crude demand outlook remains uncertain, and going forward, output levels will be set on an ad hoc basis at ministerial meetings. However, the second wave will likely have a more muted impact on fuel consumption in the important Chinese market than elsewhere in the world, potential indirect effects to exports notwithstanding.
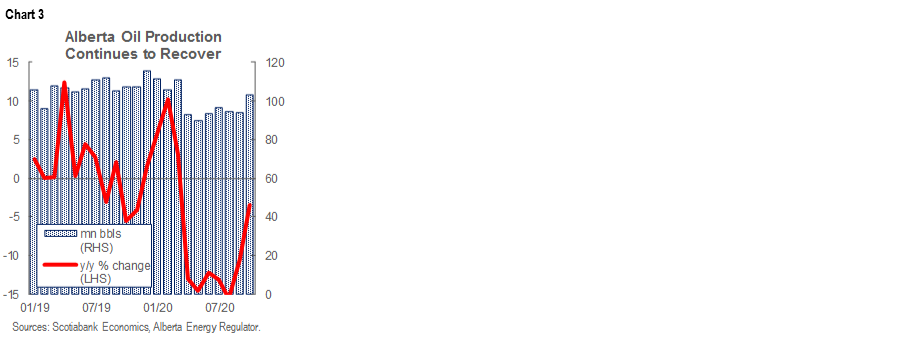
WCS is trending higher, while its discount to WTI is widening. Stronger pricing —supported by steep output cuts that created spare pipeline transportation room after years of limited capacity—has prompted producers to open the taps. In October, Alberta production was only 3.5% below year-earlier levels—in contrast to the 15.6% y/y plunge after the peak lockdown period (chart 3, p.2). Those gains have pressured the WCS-WTI gap, but improving, albeit seasonally weak refinery activity in the US Gulf Coast—the primary destination of marginal Canadian barrels—looks to be providing a partial offset. Next year, discount movements should be at the confluence of further production increases, recovering refinery demand, new egress capacity vis-à-vis Enbridge’s Line 3 pipeline, and fuel consumption’s course as immunization proceeds.
In late November, Alberta published its first multi-year fiscal and economic outlook since the pandemic reached Canada. Our full writeup can be found here, and clearly, improving crude values heading into 2021 bode well for swifter economic growth and financial repair. Yet the most noteworthy item may well be the expectation that provincial output will not return to 2014 levels until 2023. This path underscores the challenging economic environment in the province since the last commodity price downturn, and would represent one of the longest regional economic downturns in Canadian history.
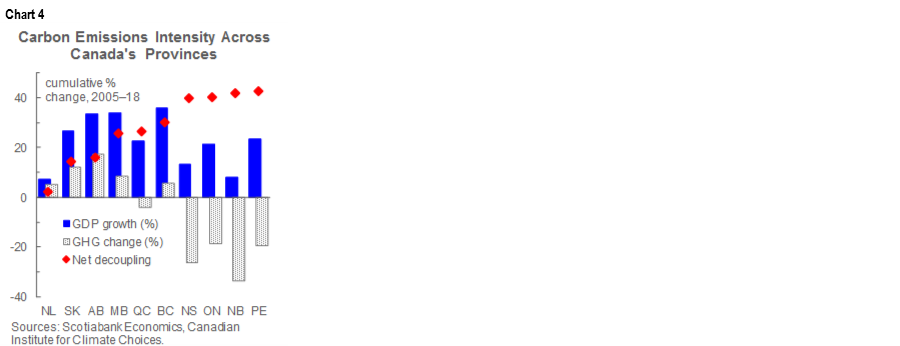
Following its own fiscal update, the Canadian Government released its updated climate action plan, the centrepiece of which is an effort to increase the federal carbon tax to 170 CAD/tonne by 2030. We suspect that markets will perceive the plan as negative for the oil and gas sector, though the steepest annual tax rate increases are penciled in for after 2022, and recent price movements have been dominated by COVID-19 and US stimulus news. Still, we highlight that Canada’s net oil-producing provinces have broadly made progress with respect to reducing emissions intensity over the last several years (chart 4, p.2).
TECHNICAL NOTE
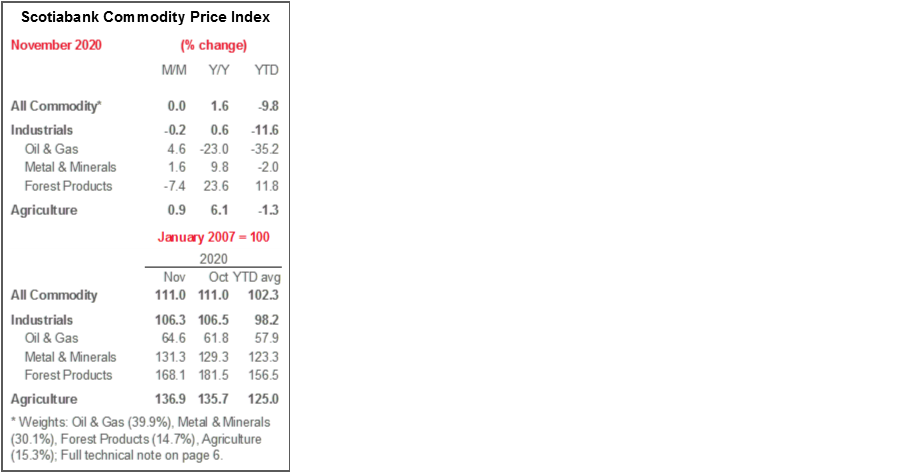
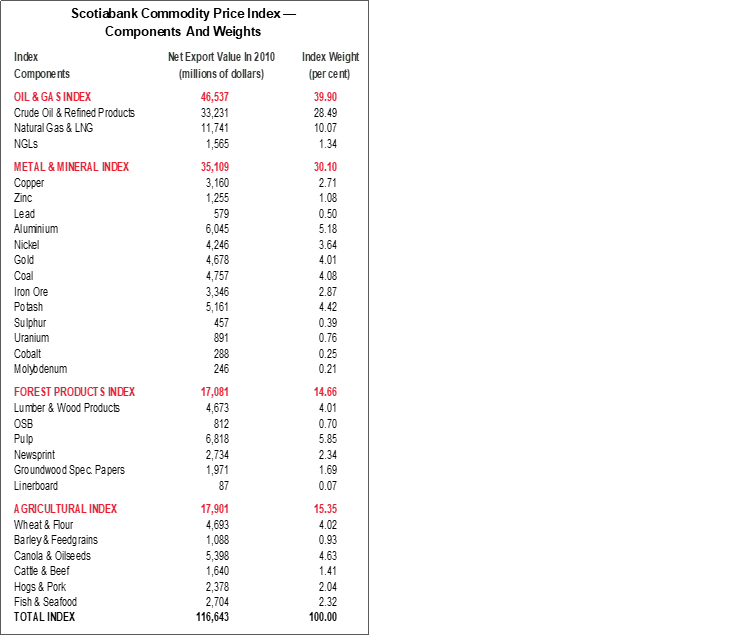
Scotiabank Commodity Price Index — Principal Canadian Exports
January 2007 = 100
This Index has been designed to track the spot or transactions prices paid in U.S. dollars for key Canadian commodities and resource-based manufactured goods in export markets. The weight of each component is based upon its net export value in 2010. Prior to January 2007, the weight of each component was based on its export value in 1995-97, except for crude oil & refined petroleum products, uncoated freesheet paper and linerboard, where net exports were used. Canada imports a significant quantity of these products, and use of their export value alone would have overstated the importance in Canada’s trade performance.
The following prices are included:
OIL & GAS
Crude Oil & Refined Petroleum Products (US$ per bbl) MSW light sweet crude oil at Edmonton (previously Edmonton Par crude) and Western Canadian Select heavy oil at Hardisty, Alberta; price differentials off WTI near-by futures from Bloomberg.
Natural Gas (US$ per mcf) Average export price quoted by the National Energy Board.
Natural Gas Liquids (NGLs – Propane, Butane, Ethane & Pentanes-Plus) (US$ per bbl), Propane at Edmonton & Sarnia.
METALS & MINERALS
Copper & Products (US$ per lb) LME official cash settlement price for grade A copper.
Zinc (US$ per lb) LME SHG cash settlement: prior to Sept 1990, U.S. producers’ price for high-grade zinc delivered.
Lead (US$ per lb) LME official cash settlement price; prior to Jan. 1991, U.S. producers’ price for common grade delivered.
Aluminium & Products (US$ per lb) since 1979, LME official cash settlement price.
Nickel (US$ per lb) since 1980, LME official cash settlement price.
Gold (US$ per oz) ‘LBMA Gold Price PM’ as of March 20, 2015.
Potash (US$ per tonne) Standard potassium chloride, spot price, FOB Vancouver.
Sulphur (US$ per tonne) Solid, spot price, FOB Vancouver.
Metallurgical Coal (US$ per tonne) Contract price for premium-grade hard coking coal, FOB Vancouver.
Iron Ore (US cents per dmtu) Spot price fines 62% Fe, CFR Qingdao, China; prior to Jan 2011, term-contract price for concentrates 66% Fe from Labrador/Quebec to Northern Europe (FOB Sept-Iles).
Uranium (US$ per lb) U3O8 near-by-futures from Bloomberg.
Molybdenum (US$ per lb) since March 1992, MW dealer oxide.
Cobalt (US$ per lb) MW dealer price.
FOREST PRODUCTS
Lumber & Wood Products, Western Spruce-Pine-Fir 2x4 No.2 & Btr (US$ per mfbm) FOB mill.
Oriented Strandboard (US$ per thousand sq. ft.), U.S. North Central region, 7/16 inch.
Pulp, Bleached Northern Softwood Kraft (US$ per tonne) Transactions price, delivery USA.
Newsprint (US$ per tonne) Average transactions price, 45 grams, delivery Eastern USA.
Groundwood Specialty Papers (US$ per ton) Supercalendered-A paper, 35 lb., delivery USA.
Linerboard (US$ per ton), delivery Eastern USA with zone discounts.
AGRICULTURE
Wheat & Flour (US$ per tonne), DNS No 1 14% protein Duluth, Minn; prior to April 2011 No.1 CWRS, 13.5% protein at St. Lawrence.
Barley (US$ per tonne), Manitoba Agriculture and Food No. 1 Canadian western barley aggregate spot price; historical data No. 1 at Lethbridge, Alberta.
Canola & Oilseeds (US$ per tonne) No.1 Canada, in store Vancouver.
Cattle & Beef (US$ per cwt) Steers over 1,051 pounds at Toronto; from Jan 1993, Ontario average.
Hogs & Pork (US$ per cwt) 100 Index Hogs at Toronto; from Jan 1993, Ontario average.
Fish & Seafood (US$ per lb) West Coast silver coho salmon; Atlantic lobster prices; prior to 1986 cod fillets & blocks.
DISCLAIMER
This report has been prepared by Scotiabank Economics as a resource for the clients of Scotiabank. Opinions, estimates and projections contained herein are our own as of the date hereof and are subject to change without notice. The information and opinions contained herein have been compiled or arrived at from sources believed reliable but no representation or warranty, express or implied, is made as to their accuracy or completeness. Neither Scotiabank nor any of its officers, directors, partners, employees or affiliates accepts any liability whatsoever for any direct or consequential loss arising from any use of this report or its contents.
These reports are provided to you for informational purposes only. This report is not, and is not constructed as, an offer to sell or solicitation of any offer to buy any financial instrument, nor shall this report be construed as an opinion as to whether you should enter into any swap or trading strategy involving a swap or any other transaction. The information contained in this report is not intended to be, and does not constitute, a recommendation of a swap or trading strategy involving a swap within the meaning of U.S. Commodity Futures Trading Commission Regulation 23.434 and Appendix A thereto. This material is not intended to be individually tailored to your needs or characteristics and should not be viewed as a “call to action” or suggestion that you enter into a swap or trading strategy involving a swap or any other transaction. Scotiabank may engage in transactions in a manner inconsistent with the views discussed this report and may have positions, or be in the process of acquiring or disposing of positions, referred to in this report.
Scotiabank, its affiliates and any of their respective officers, directors and employees may from time to time take positions in currencies, act as managers, co-managers or underwriters of a public offering or act as principals or agents, deal in, own or act as market makers or advisors, brokers or commercial and/or investment bankers in relation to securities or related derivatives. As a result of these actions, Scotiabank may receive remuneration. All Scotiabank products and services are subject to the terms of applicable agreements and local regulations. Officers, directors and employees of Scotiabank and its affiliates may serve as directors of corporations.
Any securities discussed in this report may not be suitable for all investors. Scotiabank recommends that investors independently evaluate any issuer and security discussed in this report, and consult with any advisors they deem necessary prior to making any investment.
This report and all information, opinions and conclusions contained in it are protected by copyright. This information may not be reproduced without the prior express written consent of Scotiabank.
™ Trademark of The Bank of Nova Scotia. Used under license, where applicable.
Scotiabank, together with “Global Banking and Markets”, is a marketing name for the global corporate and investment banking and capital markets businesses of The Bank of Nova Scotia and certain of its affiliates in the countries where they operate, including; Scotiabank Europe plc; Scotiabank (Ireland) Designated Activity Company; Scotiabank Inverlat S.A., Institución de Banca Múltiple, Grupo Financiero Scotiabank Inverlat, Scotia Inverlat Casa de Bolsa, S.A. de C.V., Grupo Financiero Scotiabank Inverlat, Scotia Inverlat Derivados S.A. de C.V. – all members of the Scotiabank group and authorized users of the Scotiabank mark. The Bank of Nova Scotia is incorporated in Canada with limited liability and is authorised and regulated by the Office of the Superintendent of Financial Institutions Canada. The Bank of Nova Scotia is authorized by the UK Prudential Regulation Authority and is subject to regulation by the UK Financial Conduct Authority and limited regulation by the UK Prudential Regulation Authority. Details about the extent of The Bank of Nova Scotia's regulation by the UK Prudential Regulation Authority are available from us on request. Scotiabank Europe plc is authorized by the UK Prudential Regulation Authority and regulated by the UK Financial Conduct Authority and the UK Prudential Regulation Authority.
Scotiabank Inverlat, S.A., Scotia Inverlat Casa de Bolsa, S.A. de C.V, Grupo Financiero Scotiabank Inverlat, and Scotia Inverlat Derivados, S.A. de C.V., are each authorized and regulated by the Mexican financial authorities.
Not all products and services are offered in all jurisdictions. Services described are available in jurisdictions where permitted by law.