SUMMARY
Despite severe third waves of COVID-19 in many countries, strong incoming economic data and details of the proposed US infrastructure plan have led us to again revise our global growth projections higher.
In light of these developments and early-year momentum, we have also upgraded forecasts for the prices of most commodities in our coverage.
The risk of stronger inflation continues to weigh on precious metals values, but uncertainty and US dollar effects have been supportive.
Iron ore values recently reached all-time highs and we would not be surprised to see copper follow suit.
Our latest global oil price projections assume that crude values will hold reasonably steady this quarter before rising more convincingly in the second half of the year.
GLOBAL OUTLOOK LIFTED AGAIN DESPITE VIRUS SURGE
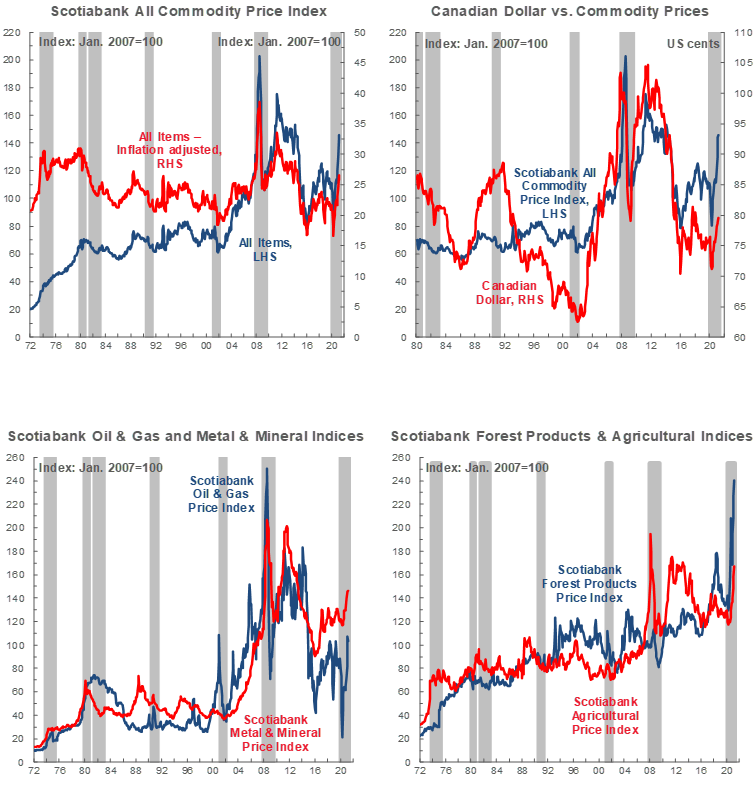
While steep increases in COVID-19 infection rates across a number of countries have prompted even stricter lockdowns over the last month, we have once again revised our global economic forecast higher. This largely reflects the strength of incoming indicators in the US and Canada that suggest economic resilience to second- and third-wave lockdowns (chart 1), but we have now included about half of the proposed Biden infrastructure plan as well. We also assess China’s recovery to be broadening beyond the industrial sector, though fiscal policy continues to provide strong underlying support for commodity prices. Tighter mobility restrictions will no doubt weigh on the expansions of countries that have imposed them, but we believe that upside risks dominate the outlook.

PRECIOUS METALS BENEFIT FROM TAX PLAN, INFLATION READINGS
Gold drifted toward the 1,800 USD/oz range near the end of April, influenced in part by a response to details of the White House’s new tax plan. Investors view the prospect of higher capital gains tax rates as negative for the US dollar; that, in turn, lifted the greenback-priced bullion. The safe-haven yellow metal also benefited from the negative volatility associated with a large bitcoin selloff. Expectations of accelerating prices—often linked to fiscal stimulus and reinforced by the surge in US CPI reported for March—and loose monetary policy continue to anchor values for the classic inflation hedge, gold. This week’s March 2021 report on personal consumption expenditures inflation—the Federal Reserve’s preferred metric of price pressures—will likely reveal further above-trend price growth.
Silver prices have also seen some late-month momentum, climbing back above 26 USD/oz after closing as low as 24 USD/oz in late March. The precious metal’s value is affected by many of the same forces as those affecting gold; ongoing shortages in the physical market continue to lend support for prices. The robust infrastructure spending expected as reopening from lockdowns proceeds should put a floor under silver prices given the metal’s wide range of industrial uses.
INDUSTRIAL METALS SUPERCYCLE
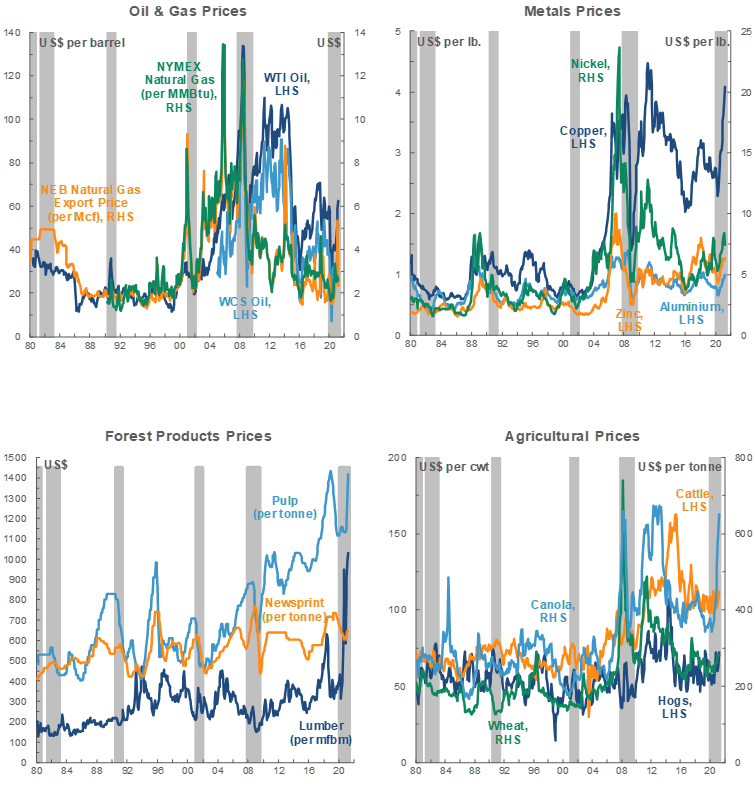
Another month, another new high for copper prices. For the last year, values of the bellwether metal have been lifted by hefty industrial demand in China (chart 2)—which accounts for over 50% of global consumption; more recently, prices have gained from signs of recovery elsewhere in the world. This week, port workers in Chile—the world’s largest copper producer—called a strike, giving rise to fears of supply disruptions and driving the red metal to its highest level since 2011. We have also raised our copper price forecasts for 2021–25 to reflect our expectations of a strong stimulus-led global recovery, as well as limited new mining capacity and healthy decarbonization-related demand in the medium-term. In all, we would not be surprised if copper prices reached new record highs this cycle.

Iron ore prices also continued their upward trend—this month breaching the 190 USD/t mark and exceeding the all-time record set in 2011—and we have likewise revised our price projections higher. An important input for steel production, the metal remains at the confluence of hefty Chinese stimulus and limited output and shipments from Latin America. We expect prices to remain well-supported near-term but ease as the year progresses—fundamentals are strong, but we still see evidence of speculative activity in the market that should abate. However, factors such as Sino-Australian trade tensions and the limited number of major mining capacity upgrades currently planned may keep prices elevated.
Prices for nickel and zinc face more muted prospects. We expect Indonesian nickel pig iron (NPI) output to continue to climb and Tsingshan Holdings’ recent technological breakthrough should increase the amount of nickel matte available for battery use. For zinc, we anticipate that production will finally ramp up following pre-pandemic capacity upgrades outside of China, keeping the global market oversupplied for the next three years despite an improving demand outlook.
OIL PRICE FORECASTS RAISED
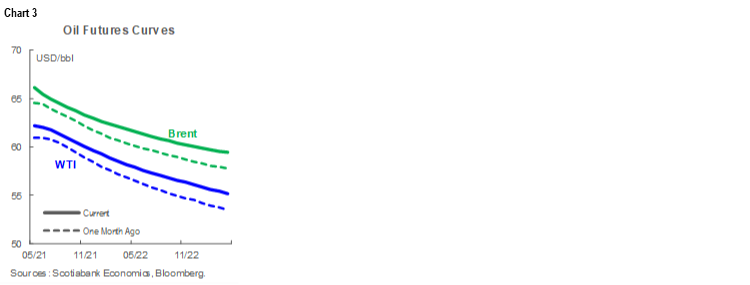
Our latest global oil price projections assume that crude values will hold steady this quarter and rise more convincingly in H2-2021. That forecast corresponds to our view that global fuel consumption will improve with more widespread vaccination and the eventual easing of third-wave lockdown measures. Near-term, we expect US producers to stay cautious with respect to new capital outlays and OPEC+ looks likely to remain nimble on production decisions. Yet the latter group recently raised its demand outlook and appears set to ease production cuts next month, and if American shale patch spending discipline is maintained, it should reduce spare capacity and inventories, and eventually push prices higher. Futures curves for Brent and WTI are depicted in chart 3.
Over time, we expect the WCS differential to WTI to widen to a range more in line with refining and transportation costs. Pricing for Western Canadian barrels continues to benefit from diminished heavy oil availability in the US Gulf Coast related to OPEC+ output cuts; as those quotas are gradually eased, the discount to WTI should normalize. Assisted by the end of the province’s curtailment program late last year, Alberta crude production is also trending generally higher—though it fell back in February. Those additional barrels should be absorbed by added egress capacity via the Line 3 pipeline, expected to enter service later this year.
DON’T KNOCK ON WOOD
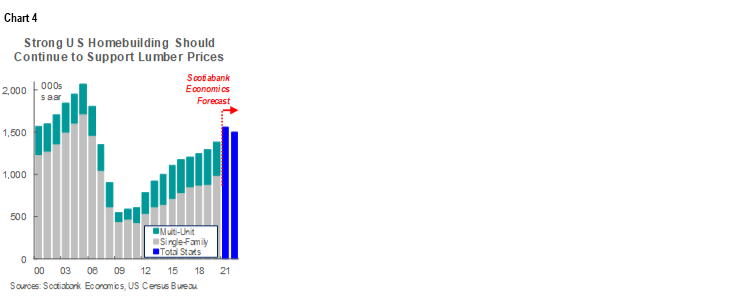
The surge in lumber prices witnessed over the last year has been nothing short of remarkable. North American benchmarks are setting new records every week; the composite framing index’s climb to almost 1,200 USD/Mfbm in the week of April 23 followed reports that US housing starts reached their highest level since 2006 (chart 4, p.2). The demand side of the market looks promising—we anticipate that total US starts will reach a post-GFC high in 2021, with gains concentrated in lumber-intensive single-family units. Home repair and renovation activity should also remain elevated so long as lockdowns are in force. North American mills continue to grapple with tight inventories and strong sales orders.
Prices for many other forest products are also at or near record highs. OSB values were more than triple year-earlier levels in the week of April 23, 2021. The price of Kraft Pulp—used in tissues, packaging, and various other consumer paper products—continues to benefit from strong demand vis-à-vis the pandemic-induced shift to e-commerce.
TECHNICAL NOTE
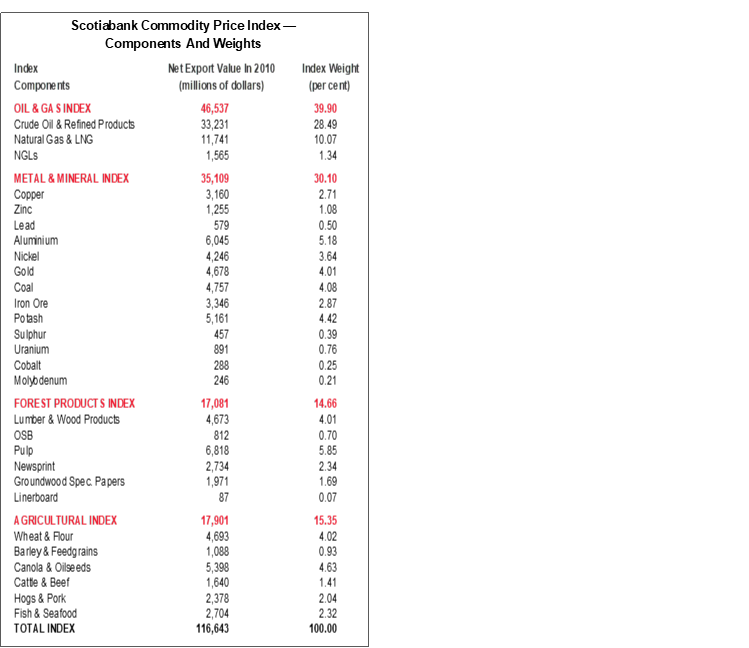
Scotiabank Commodity Price Index — Principal Canadian Exports
January 2007 = 100
This Index has been designed to track the spot or transactions prices paid in U.S. dollars for key Canadian commodities and resource-based manufactured goods in export markets. The weight of each component is based upon its net export value in 2010. Prior to January 2007, the weight of each component was based on its export value in 1995-97, except for crude oil & refined petroleum products, uncoated freesheet paper and linerboard, where net exports were used. Canada imports a significant quantity of these products, and use of their export value alone would have overstated the importance in Canada’s trade performance.
The following prices are included:
OIL & GAS
Crude Oil & Refined Petroleum Products (US$ per bbl) MSW light sweet crude oil at Edmonton (previously Edmonton Par crude) and Western Canadian Select heavy oil at Hardisty, Alberta; price differentials off WTI near-by futures from Bloomberg.
Natural Gas (US$ per mcf) Average export price quoted by the National Energy Board.
Natural Gas Liquids (NGLs – Propane, Butane, Ethane & Pentanes-Plus) (US$ per bbl), Propane at Edmonton & Sarnia.
METALS & MINERALS
Copper & Products (US$ per lb) LME official cash settlement price for grade A copper.
Zinc (US$ per lb) LME SHG cash settlement: prior to Sept 1990, U.S. producers’ price for high-grade zinc delivered.
Lead (US$ per lb) LME official cash settlement price; prior to Jan. 1991, U.S. producers’ price for common grade delivered.
Aluminium & Products (US$ per lb) since 1979, LME official cash settlement price.
Nickel (US$ per lb) since 1980, LME official cash settlement price.
Gold (US$ per oz) ‘LBMA Gold Price PM’ as of March 20, 2015.
Potash (US$ per tonne) Standard potassium chloride, spot price, FOB Vancouver.
Sulphur (US$ per tonne) Solid, spot price, FOB Vancouver.
Metallurgical Coal (US$ per tonne) Contract price for premium-grade hard coking coal, FOB Vancouver.
Iron Ore (US cents per dmtu) Spot price fines 62% Fe, CFR Qingdao, China; prior to Jan 2011, term-contract price for concentrates 66% Fe from Labrador/Quebec to Northern Europe (FOB Sept-Iles).
Uranium (US$ per lb) U3O8 near-by-futures from Bloomberg.
Molybdenum (US$ per lb) since March 1992, MW dealer oxide.
Cobalt (US$ per lb) MW dealer price.
FOREST PRODUCTS
Lumber & Wood Products, Western Spruce-Pine-Fir 2x4 No.2 & Btr (US$ per mfbm) FOB mill.
Oriented Strandboard (US$ per thousand sq. ft.), U.S. North Central region, 7/16 inch.
Pulp, Bleached Northern Softwood Kraft (US$ per tonne) Transactions price, delivery USA.
Newsprint (US$ per tonne) Average transactions price, 45 grams, delivery Eastern USA.
Groundwood Specialty Papers (US$ per ton) Supercalendered-A paper, 35 lb., delivery USA.
Linerboard (US$ per ton), delivery Eastern USA with zone discounts.
AGRICULTURE
Wheat & Flour (US$ per tonne), DNS No 1 14% protein Duluth, Minn; prior to April 2011 No.1 CWRS, 13.5% protein at St. Lawrence.
Barley (US$ per tonne), Manitoba Agriculture and Food No. 1 Canadian western barley aggregate spot price; historical data No. 1 at Lethbridge, Alberta.
Canola & Oilseeds (US$ per tonne) No.1 Canada, in store Vancouver.
Cattle & Beef (US$ per cwt) Steers over 1,051 pounds at Toronto; from Jan 1993, Ontario average.
Hogs & Pork (US$ per cwt) 100 Index Hogs at Toronto; from Jan 1993, Ontario average.
Fish & Seafood (US$ per lb) West Coast silver coho salmon; Atlantic lobster prices; prior to 1986 cod fillets & blocks.
DISCLAIMER
This report has been prepared by Scotiabank Economics as a resource for the clients of Scotiabank. Opinions, estimates and projections contained herein are our own as of the date hereof and are subject to change without notice. The information and opinions contained herein have been compiled or arrived at from sources believed reliable but no representation or warranty, express or implied, is made as to their accuracy or completeness. Neither Scotiabank nor any of its officers, directors, partners, employees or affiliates accepts any liability whatsoever for any direct or consequential loss arising from any use of this report or its contents.
These reports are provided to you for informational purposes only. This report is not, and is not constructed as, an offer to sell or solicitation of any offer to buy any financial instrument, nor shall this report be construed as an opinion as to whether you should enter into any swap or trading strategy involving a swap or any other transaction. The information contained in this report is not intended to be, and does not constitute, a recommendation of a swap or trading strategy involving a swap within the meaning of U.S. Commodity Futures Trading Commission Regulation 23.434 and Appendix A thereto. This material is not intended to be individually tailored to your needs or characteristics and should not be viewed as a “call to action” or suggestion that you enter into a swap or trading strategy involving a swap or any other transaction. Scotiabank may engage in transactions in a manner inconsistent with the views discussed this report and may have positions, or be in the process of acquiring or disposing of positions, referred to in this report.
Scotiabank, its affiliates and any of their respective officers, directors and employees may from time to time take positions in currencies, act as managers, co-managers or underwriters of a public offering or act as principals or agents, deal in, own or act as market makers or advisors, brokers or commercial and/or investment bankers in relation to securities or related derivatives. As a result of these actions, Scotiabank may receive remuneration. All Scotiabank products and services are subject to the terms of applicable agreements and local regulations. Officers, directors and employees of Scotiabank and its affiliates may serve as directors of corporations.
Any securities discussed in this report may not be suitable for all investors. Scotiabank recommends that investors independently evaluate any issuer and security discussed in this report, and consult with any advisors they deem necessary prior to making any investment.
This report and all information, opinions and conclusions contained in it are protected by copyright. This information may not be reproduced without the prior express written consent of Scotiabank.
™ Trademark of The Bank of Nova Scotia. Used under license, where applicable.
Scotiabank, together with “Global Banking and Markets”, is a marketing name for the global corporate and investment banking and capital markets businesses of The Bank of Nova Scotia and certain of its affiliates in the countries where they operate, including; Scotiabank Europe plc; Scotiabank (Ireland) Designated Activity Company; Scotiabank Inverlat S.A., Institución de Banca Múltiple, Grupo Financiero Scotiabank Inverlat, Scotia Inverlat Casa de Bolsa, S.A. de C.V., Grupo Financiero Scotiabank Inverlat, Scotia Inverlat Derivados S.A. de C.V. – all members of the Scotiabank group and authorized users of the Scotiabank mark. The Bank of Nova Scotia is incorporated in Canada with limited liability and is authorised and regulated by the Office of the Superintendent of Financial Institutions Canada. The Bank of Nova Scotia is authorized by the UK Prudential Regulation Authority and is subject to regulation by the UK Financial Conduct Authority and limited regulation by the UK Prudential Regulation Authority. Details about the extent of The Bank of Nova Scotia's regulation by the UK Prudential Regulation Authority are available from us on request. Scotiabank Europe plc is authorized by the UK Prudential Regulation Authority and regulated by the UK Financial Conduct Authority and the UK Prudential Regulation Authority.
Scotiabank Inverlat, S.A., Scotia Inverlat Casa de Bolsa, S.A. de C.V, Grupo Financiero Scotiabank Inverlat, and Scotia Inverlat Derivados, S.A. de C.V., are each authorized and regulated by the Mexican financial authorities.
Not all products and services are offered in all jurisdictions. Services described are available in jurisdictions where permitted by law.