- Bank of Canada on an extended hold, next move likely a hike
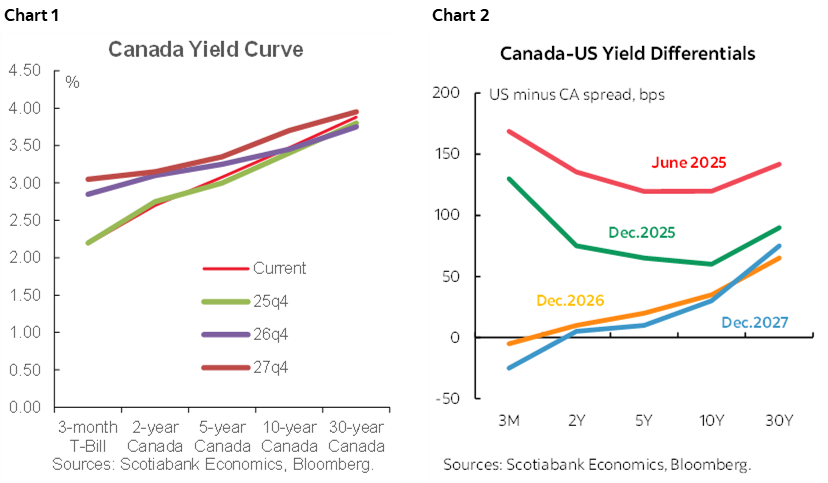
- Canada curve likely to flatten, negative spreads to US to narrow
- BoC’s balance sheet normalization & what it means to bonds
- 2026 carries bidirectional risks to our rates forecasts
SUMMARY OF EXPECTATIONS
Scotiabank Economics expects the new year to extend the Bank of Canada’s 2¼% rate pause before migrating toward 50bps of policy tightening over 2026H2 that may turn out to be greater and earlier than expected. This is a view we’ve had since September with markets recently moving in this direction. The Canada base rates curve is expected to flatten over time. Canada’s short-term yield spread versus the US is expected to narrow aided by Federal Reserve cuts and in support of the Canadian dollar’s expected appreciation while the longer-term positive US yield differential over Canada narrows.
There is only one certainty to these projections—2026 probably faces as many uncertainties as 2025 did! I’ll offer what I think are reasonable views, but this is not a set-and-forget environment for anyone’s forecasts. Risk management needs to be nimble.
Charts 1 and 2 lay out broad year-end views. The Canada 10-year anchor point on the curve is forecast to rally into the early new year before cheapening resumes. An equilibrium level of about 3¾% is forecast with risks skewed higher than lower.
BANK OF CANADA ON AN EXTENDED HOLD...
Key to expectations for a policy rate hold for some time is the Bank of Canada’s signalled reaction function. Recall the key line in the October 29th statement with emphasis added:
“If inflation and economic activity evolve broadly in line with the October projection, Governing Council sees the current policy rate at about the right level to keep inflation close to 2% while helping the economy through this period of structural adjustment.”
That was about as clear a sign that the BoC has shifted to the sidelines as one could imagine. And so they should in order to allow time for the long and variable lags on monetary policy actions to work their way through a muddled mixture of demand and supply side risks over the coming several quarters.
Recent data supports a prolonged pause. The job market is ripping with 181,000 jobs created in the past three months, the unemployment rate is tumbling down to 6.5%, trend core inflation remains materially above the 2% headline target, and deficit-financed stimulus intensified. I’ll come back to the important role of GDP revisions and CUSMA.
...AT A PRESENTLY STIMULATIVE POLICY RATE...
Multiple approaches taken together show that the policy rate is likely stimulative and too low which is part of what counsels a prolonged pause in the absence of a full-blown crisis.
For one, the Bank of Canada’s overnight rate of 2¼% is at the lower end of the neutral rate range of 2¼% to 3¼%. That’s at best a longer-run guidepost.
For another, in real terms adjusted for backward inflation it is around zero or negative. Using the current headline inflation rate of 2.2%, the real policy rate is roughly zero. If we use trimmed mean or weighted median CPI that are both around 3% then the real policy rate is negative. The real policy rate is also negative using traditional core CPI (ex-food and energy).
As for the expected real rate, there are no useful market gauges for inflation expectations in Canada as the real return bonds from which they are derived have dealt with suspended issuance and a buy and hold pattern by key investors. The consensus economist forecast for inflation is around 2% over coming years and this portrays the real overnight rate as slightly positive. Using inflation expectations from the BoC’s Business Outlook Survey that are roughly between 2½% and 3% shows the real policy rate as slightly negative. Using multiple measures of inflation expectations from the Canadian Survey of Consumer Expectations that are all toward 4% results in a sharply negative real policy rate.
Normally one would only plunge further into negative real rates territory in a true crisis. That’s not impossible, but we’re far from expecting one at this point.
...AS THE TAYLOR RULE SUPPORTS
Another approach is to apply a standard Taylor Rule approach to where the policy rate should probably be at present. The outcome has us believing that the additional easing was for insurance against downside risks to the 2% inflation target as the federal budget kept getting pushed out in time, Canada eliminated reciprocal tariffs outside of metals and autos, the US labour market has been flashing warning signs on the US economy which matters a lot to Canada, and trade tensions continue to frustrate efforts toward striking an agreement.
Recall that the Taylor ‘rule’ posits that the policy rate should be directly related to estimates of the real policy rate plus some coefficient applied against the deviation of inflation from the 2% inflation target, plus some coefficient applied against the estimated size of the output gap. All of these variables are highly uncertain at present and going forward, but we can still do some scenarios that yield useful insight.
Enter generative AI. Now everybody has the ability to do umpteen scenarios for what should be the present and future policy rate using different measures of core inflation, output gaps, real neutral policy rates and sensitivities to deviations from the inflation target and capacity deviations. In addition to my own fiddling with Taylor Rule estimates I asked ChatGPT to help.
It all starts with “please provide Taylor rule estimates for what the Bank of Canada's policy rate should be now.” ChatGPT then goes to work, scouring the web for data, for various estimates of the gap and inflation and real neutral policy rates, devises a model in accordance with the Taylor Rule framework, and within around 20–30 seconds presto here’s your answer. Or a few.
Chart 3 is the outcome. It shows what the policy rate should be under differing scenarios for the inflation rate and size of the output gap at reasonable estimates for the coefficients and assuming that the neutral policy rate is about 2.75% which is in the middle of the BoC’s estimated range. Present inflation is 2.2% y/y with the BoC’s core measures at 2.9% (weighted median), 3.0% (trimmed mean) and 2.7% (traditional core ex-food and energy). We estimate the output gap at about -0.6% now. This combination shows the policy rate is presently around 25–50bps too low.
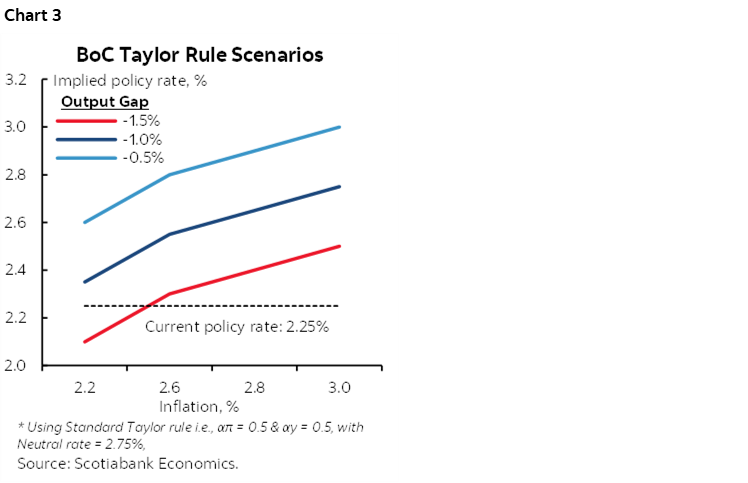
In other words, there may be an insurance premium that is already built into the policy rate in recognition of forward-looking risks, or because the BoC shouldn’t have cut. We did forecast they would cut based on the BoC’s reaction function and our assessment of the insurance argument as Canada eliminated most reciprocal tariffs, as the US labour market sheds somewhat disturbing signals, as trade negotiations stalled and while awaiting fiscal stimulus.
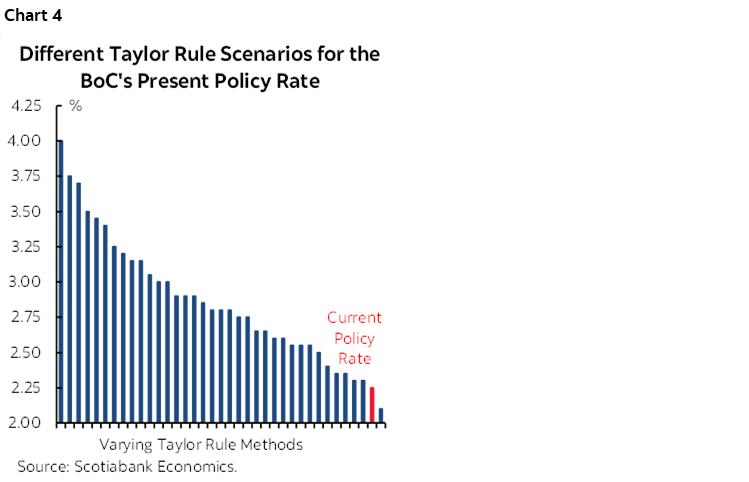
I also ran lots of other scenarios with different measures of inflation, different measures of the nominal neutral rate, different measures of the size of the output gap, and varying coefficients. I can’t run through all of them here but chart 4 shows the three dozen estimates of what the policy rate should be in repeated modelling and compares them to the actual policy rate at present. In the overwhelming majority of those estimates what jumps out is that the policy rate is lower than the Taylor Rule predicts it should be.
If there is such an insurance premium, then it counsels against cutting further at least for some time to see how policy to date works through.
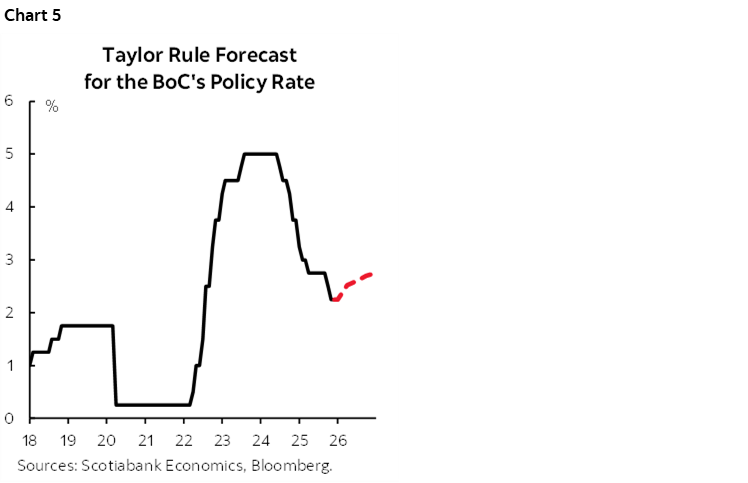
TAYLOR RULE POINTS TO FUTURE HIKES...
I then asked ChatGPT to produce a forecast for the BoC’s policy rate going forward and did multiple scenarios for the various inputs. The most reasonable base case outlook is provided in chart 5. It shows 50bps of hikes next year starting in 2026Q3. I figure it’s on the bubble between starting in Q2 and Q3 and some estimates point higher.
...SUPPORTED BY MACRO ARGUMENTS
This view is consistent with expecting the output gap to roughly close by the end of 2026 from a lower starting point now than previously estimated and because soft demand conditions are accompanied by supply constraints such as tighter immigration policy and weakened supply chains.
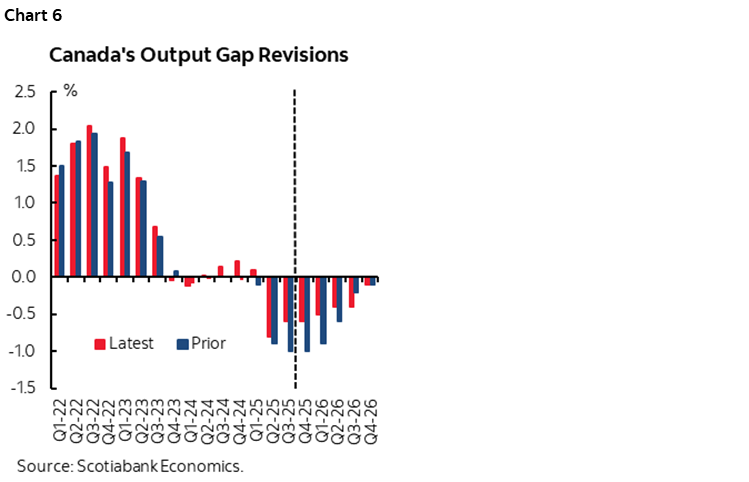
Current output gap estimates have been cut down by the recent upward GDP revisions over 2022–24 including implications for potential GDP. They’ve gone from an estimated -1.1% of potential output to slack that is now estimated at about half as much (chart 6).
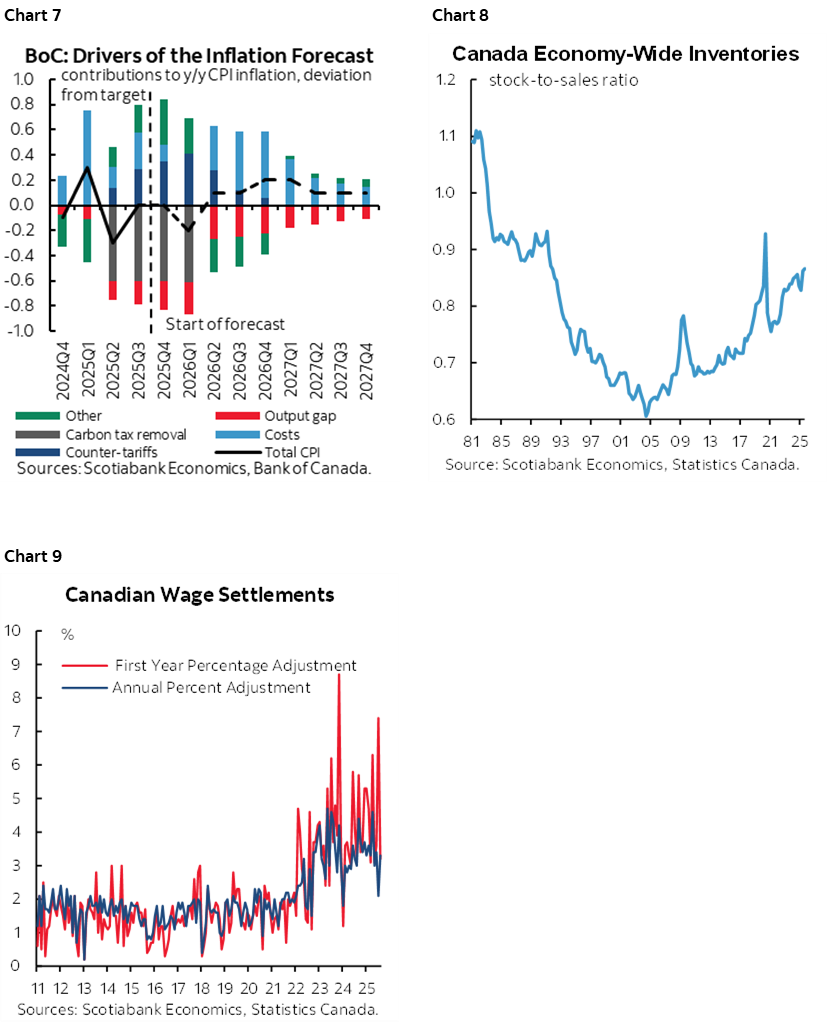
A small gap means that chart 7 that is replicated from the BoC’s October MPR probably now has less of a downward drag on inflation from economic slack which tilts the relative balance more toward cost pressures as a driver of inflation. Those cost pressures reflect upward pressure on inventories that is significantly desired in a move away from pure just-in-time delivery to padding inventories in the context of serial supply side shocks (chart 8). They also include strong ongoing wage pressures including settlements in collective bargaining exercises that govern about one-third of employed Canadians (chart 9). Revamping supply chains by seeking new suppliers, new trade channels, de-emphasizing legacy assets behind borders that are now at higher risk, and investing in new capacity and workforce arrangements are likely to be very long-tailed drivers of cost pressures with incidence effects likely to include passing on some of the costs to end consumers.
As a result, the BoC may have more confidence in hitting its forecast for inflation to be just above 2% by the end of next year, or it could raise that estimate in January’s MPR. The chosen path will determine the relative degree of hawkishness. So will its longer-run views on inflation given the long wave nature of some of today’s inflation impulses.
There is a lot that the Taylor Rule does not take into consideration, some of which can be accommodated by the differing assumptions I used as inputs, such as how strongly the BoC may react to deviations in inflation from the target and output gaps from imbalances (ie: the coefficients).
CUSMA/USMCA negotiations are part of the uncertainties. I view the risks as roughly balanced at present while leaning toward a cautiously optimistic slant. The Trump administration has imposed the lowest effective tariff rate on Canada of any of America’s major trading partners; we estimate it at around 6% because CUSMA-compliant trade is exempt. I doubt very much that the US administration would risk tearing up the agreement into a mid-term election year. Even if Trump tried, the outcome in Congress and possibly SCOTUS could emerge as a major uncertainty and possible embarrassment for the administration right into the vote when its popular support is already tumbling. There is a path to a security and trade agreement that could restore some certainty and assist in unleashing some pent-up demand for housing, consumption and capital goods over the outlook and we’ll just have to monitor developments.
THE FUNDAMENTALS BEHIND BOND YIELDS...
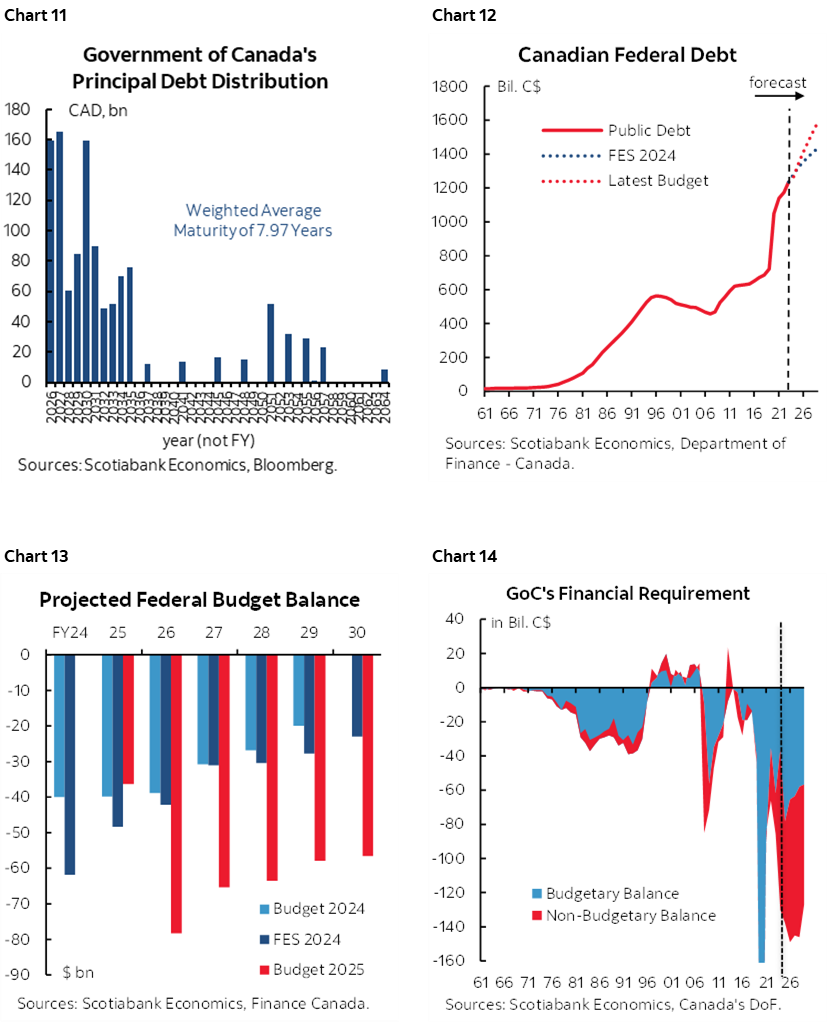
Over time, the Canadian government’s 10-year bond yield should be roughly correlated with expected nominal GDP growth. It’s by no means a perfect fit (chart 10). Since we are forecasting around 3½% NGDP growth in 2026 and closer to 4% in 2027 these should serve as loose guideposts to the 10-year yield.
If we are right on the policy rate settling in at 2¼% and eventually rising then this should place upward pressure upon bond yields over time including through the application of what is now a higher term premium. The 5-year GoC bond yield of 3% at present is probably too dear relative to a longer-run equilibrium rate at a neutral policy rate plus reasonable term premium with considerable residual inflation risk.
If only it were so simple. The bond market is not as simple as rough rules of thumb or economists’ models. Experienced traders and PMs who are good at what they do know full well the market’s capacity to humble everyone’s efforts.
One reason for a potential nearer term bond rally into 2026 is uncertainty around delayed US macroeconomic data for key variables like nonfarm payrolls and inflation. We forecast US growth to ease into 2026. The Federal Reserve is forecast to cut down to 3% by Spring. The Fed is also ending Quantitative Tightening which means even less maturing Treasuries coming back into the market.
Nearer term risk appetite is looking toppish, and effects of other policies like e-SLR changes for the GSIBs and stablecoin demand for US Ts may also contribute to the broader rates view. So does the likelihood that the next Fed chair will be the one who sounds most dovish, at least in the short term (and heaps on the most praise…). I’m also still concerned about the coming five-year review of the regional Fed Presidents at the end of February. As the Bank of Japan continues to tighten policy as soon as this month, the impact is likely to be a further ongoing lessening of the once attractive yen carry trade into US and Canadian bonds but much of this adjustment is deemed to have moved through.
...WITH MORE SUPPLY, LOTS TO REFI...
Government bond issuance is likely to be at high levels over coming years. Common estimates are likely understated. The supply side will become increasingly pressured.
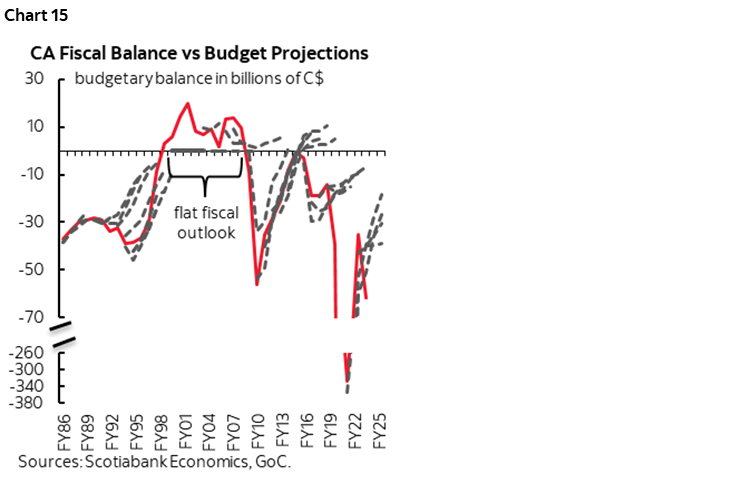
A large amount of maturing bonds needs to be rolled over in the relatively short term (chart 11). Federal debt is likely to rise at a quicker pace than previously estimated (chart 12) as deficit financing mounts (chart 13). Financial requirements are likely to be higher yet with budgetary and non-budgetary drivers (chart 14). Deficit projections are likely lowballed. First, chart 15 provides an unflattering depiction of Ottawa’s ability to project its deficit by comparing the actual size in red to each period’s updated projections in black dashed lines. Inflection points are commonly missed amid eternal optimism that always strives in the direction of smaller numbers. Either they are thoroughly politicized projections or the Finance forecasters are really bad. Second, this past Budget was merely a placeholder on plans to roll out further spending/investment initiatives. Third, two main areas of emphasis are defence and infrastructure spending that are notorious the world over for cost overruns and delays and especially in Canada.
...WHILE THE BANK OF CANADA’S BALANCE SHEET REMAINS SIDELINED
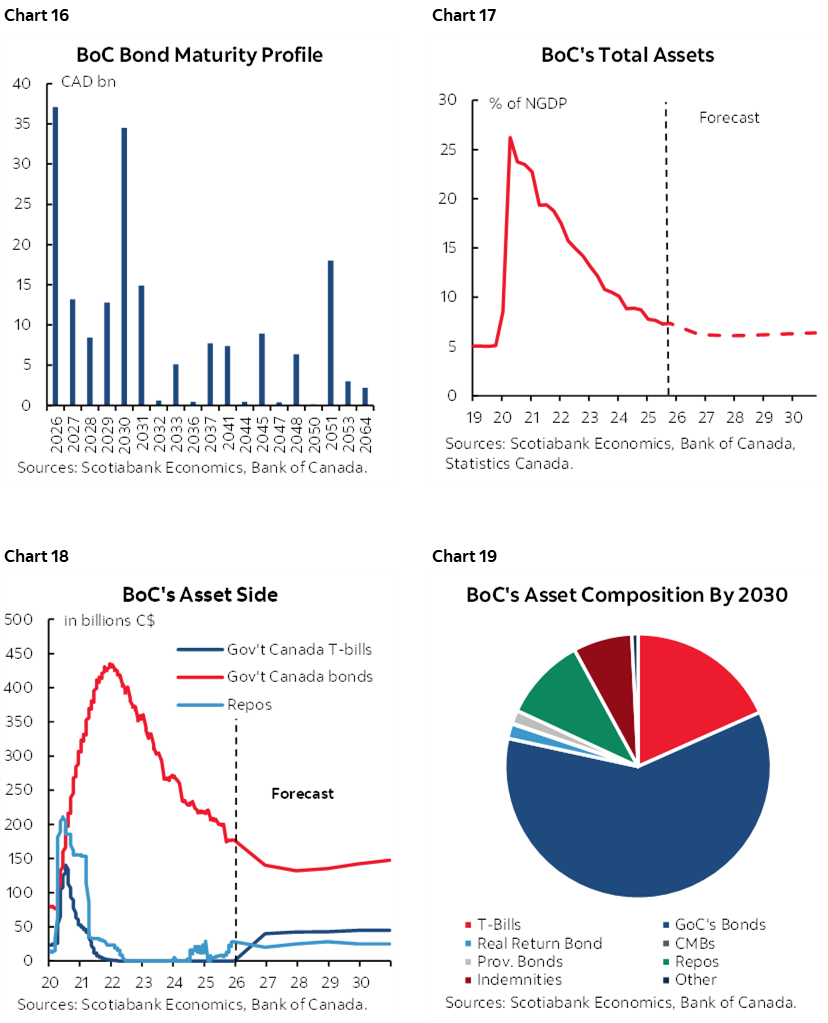
While debt balloons, how much of a role might the Bank of Canada play in the bond market beyond traditional tools applied at the front-end? Nothing over the next year, and very little in 2027 other than in the normal conduct of conventional monetary policy.
Recall that they ended Quantitative Tightening back in the January statement. The first progression toward stabilizing and then expanding the balance sheet was to return to repo activity. The next step is to start buying treasury bills. They recently announced that buying will start on December 16th and will disclose specific intended purchase amounts on December 9th (here). Maturing Government of Canada bonds continue to roll off the balance sheet.
What next and when? It might be reasonable to expect another annual speech by Deputy Governor Gravelle in January as per last year (here), but in 2024 he delivered such a speech in March. An annual update is useful to markets and a fair amount has changed since his last one.
Key is timing when the BoC may return to gross purchases of Government of Canada bonds given the speech’s guidance this would occur “no earlier than late 2026” and then the updated recent guidance on how they will “likely not need to start until 2027.”
Charts 16–20 provide my updated attempts at spitballing the evolution of the BoC’s balance sheet. By my math, the BoC should be in no great rush to purchase GoC bonds until well into 2027. Only a modest amount of GoC bond buying is projected over the next several years. This is the outcome from a set of updated assumptions and Gravelle’s guidance.
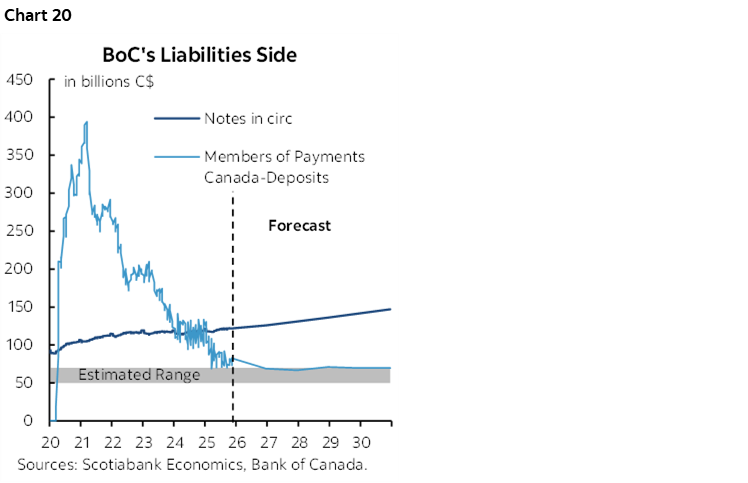
On the liability side:
- settlement balances (ie: the BoC’s version of the Fed’s reserves) are targeted at between C$50–70 billion. What drops out of my math and intuition is that the BoC is likely to lean toward the higher end of this target range. Persistent bouts of funding market challenges probably make it prudent to lean toward the higher end and possibly higher yet. The BoC previously underestimated the amount of settlement balances targeted at C$20–60B.
- Government of Canada deposits temporarily pick up as stimulus is deposited and then redeployed but then these balances return to a lower steady state.
- notes in circulation grow at a pace equal to nominal GDP over time.
- ‘other’ deposits, ‘other liabilities, and equity are relatively stable.
On the asset side:
- CMB, provincial bond and RRB holdings continue to decline as maturing holdings drop off. CMB holdings are basically eliminated by 2030.
- short-term interest-bearing assets (bills, repo) roughly equate to short-term interest-bearing liabilities (settlement balances). The split between bills and repos is unclear but I’ve assumed there to be a natural progression more toward bills than repos.
- GoC bond holdings grow roughly in line with notes in circulation as gross purchases return starting in 2027 and in the secondary market as per BoC guidance and come to offset bond maturities.
The implied challenge to market participants is that—barring a crisis that would generate debate about returning to Quantitative Easing—the BoC won’t be providing much support to the bond market as government debt rises.
DISCLAIMER
This report has been prepared by Scotiabank Economics as a resource for the clients of Scotiabank. Opinions, estimates and projections contained herein are our own as of the date hereof and are subject to change without notice. The information and opinions contained herein have been compiled or arrived at from sources believed reliable but no representation or warranty, express or implied, is made as to their accuracy or completeness. Neither Scotiabank nor any of its officers, directors, partners, employees or affiliates accepts any liability whatsoever for any direct or consequential loss arising from any use of this report or its contents.
These reports are provided to you for informational purposes only. This report is not, and is not constructed as, an offer to sell or solicitation of any offer to buy any financial instrument, nor shall this report be construed as an opinion as to whether you should enter into any swap or trading strategy involving a swap or any other transaction. The information contained in this report is not intended to be, and does not constitute, a recommendation of a swap or trading strategy involving a swap within the meaning of U.S. Commodity Futures Trading Commission Regulation 23.434 and Appendix A thereto. This material is not intended to be individually tailored to your needs or characteristics and should not be viewed as a “call to action” or suggestion that you enter into a swap or trading strategy involving a swap or any other transaction. Scotiabank may engage in transactions in a manner inconsistent with the views discussed this report and may have positions, or be in the process of acquiring or disposing of positions, referred to in this report.
Scotiabank, its affiliates and any of their respective officers, directors and employees may from time to time take positions in currencies, act as managers, co-managers or underwriters of a public offering or act as principals or agents, deal in, own or act as market makers or advisors, brokers or commercial and/or investment bankers in relation to securities or related derivatives. As a result of these actions, Scotiabank may receive remuneration. All Scotiabank products and services are subject to the terms of applicable agreements and local regulations. Officers, directors and employees of Scotiabank and its affiliates may serve as directors of corporations.
Any securities discussed in this report may not be suitable for all investors. Scotiabank recommends that investors independently evaluate any issuer and security discussed in this report, and consult with any advisors they deem necessary prior to making any investment.
This report and all information, opinions and conclusions contained in it are protected by copyright. This information may not be reproduced without the prior express written consent of Scotiabank.
™ Trademark of The Bank of Nova Scotia. Used under license, where applicable.
Scotiabank, together with “Global Banking and Markets”, is a marketing name for the global corporate and investment banking and capital markets businesses of The Bank of Nova Scotia and certain of its affiliates in the countries where they operate, including; Scotiabank Europe plc; Scotiabank (Ireland) Designated Activity Company; Scotiabank Inverlat S.A., Institución de Banca Múltiple, Grupo Financiero Scotiabank Inverlat, Scotia Inverlat Casa de Bolsa, S.A. de C.V., Grupo Financiero Scotiabank Inverlat, Scotia Inverlat Derivados S.A. de C.V. – all members of the Scotiabank group and authorized users of the Scotiabank mark. The Bank of Nova Scotia is incorporated in Canada with limited liability and is authorised and regulated by the Office of the Superintendent of Financial Institutions Canada. The Bank of Nova Scotia is authorized by the UK Prudential Regulation Authority and is subject to regulation by the UK Financial Conduct Authority and limited regulation by the UK Prudential Regulation Authority. Details about the extent of The Bank of Nova Scotia's regulation by the UK Prudential Regulation Authority are available from us on request. Scotiabank Europe plc is authorized by the UK Prudential Regulation Authority and regulated by the UK Financial Conduct Authority and the UK Prudential Regulation Authority.
Scotiabank Inverlat, S.A., Scotia Inverlat Casa de Bolsa, S.A. de C.V, Grupo Financiero Scotiabank Inverlat, and Scotia Inverlat Derivados, S.A. de C.V., are each authorized and regulated by the Mexican financial authorities.
Not all products and services are offered in all jurisdictions. Services described are available in jurisdictions where permitted by law.