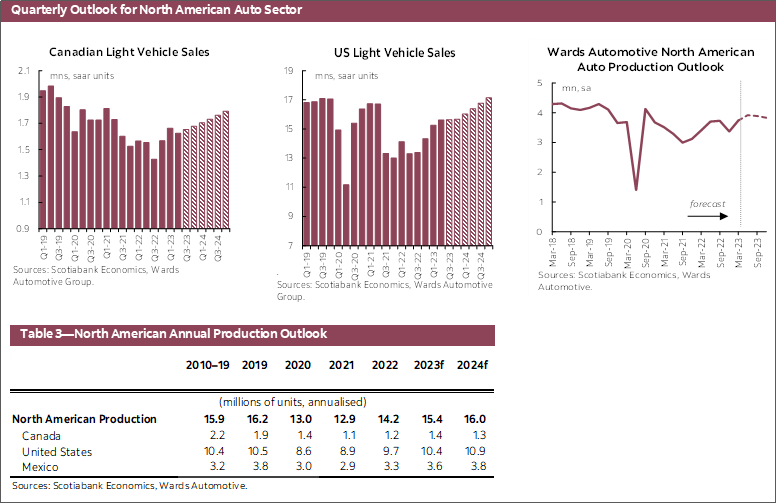
CANADA: TREND RECOVERY UNDERWAY BUT VOLATILE
Canadian auto sales have wrapped up the first half of 2023 with a trend recovery underway from depressed sales throughout 2021 and much of 2022. Light vehicle sales on a non-seasonally adjusted basis are up 5.1% year-to-date relative to 2022 and have averaged 1.64 mn (saar) units sold through the first six months of this year. Nevertheless, auto sales are still quite depressed relative to pre-pandemic and remain 17.4% below this same period in 2019. Pent up demand owing to limited inventory from production and supply chain disruptions are likely acting as a floor to sales in this higher price tag and elevated cost of financing environment, while monthly sales remain volatile, decreasing 7.7% (sa) in June. The still-tight labour market continues to support job growth, adding 110 k full-time positions for a net gain of 60 k additional jobs in June, albeit with wage growth easing in recent months. Headline inflation has come down from the recent peak of above 8% in June 2022 to below 4% as of May 2023 in year-over-year terms. However, the still-high monthly pace of inflation and resilient growth risks slowing the progress of returning inflation towards 2%, resulting in the Bank of Canada hiking the overnight rate to 5.00% at their policy rate meeting on July 12th. Our outlook for Canada expects 1.66 mn auto sales in 2023 as rising production eases supply-side constraints and sales further increasing to 1.75 mn in 2024 as inflation comes down and rates pressures ease.
UNITED STATES: SALES IMPROVING AMID HIGHER INVENTORY
US auto sales continued their upward trend recovery through the first half of 2023, increasing 12.9% year-to-date in non-seasonally adjusted terms compared to 2022. While vehicle sales through the first six months are 8.9% below the same period in 2019, seasonally adjusted sales have increased on a quarterly basis since Q3-2022 and averaged 15.4 mn (saar) units in 2023. Total US light vehicle inventory has increased in fourteen of the past sixteen months, reaching 2 mn units as of June when adjusting for seasonality. While improving inventory levels are easing supply-side pressures, up from around 1 mn units in late 2021 to early 2022, they are still well below the average 3.8 nm units in 2019. Strong wage growth and low unemployment is supporting the recovery in vehicle sales despite the elevated costs of financing as the US Federal Reserve is likely to continue tightening their policy rate in Q3 of this year, with rate cuts not expected until Q2-2024. Our outlook for US auto sales in 2023 is 15.5 mn units as vehicle availability improves amid tightened financial conditions and sales are expected to pick up to 16.6 mn units in 2024 as inflation and rates pressures ease.
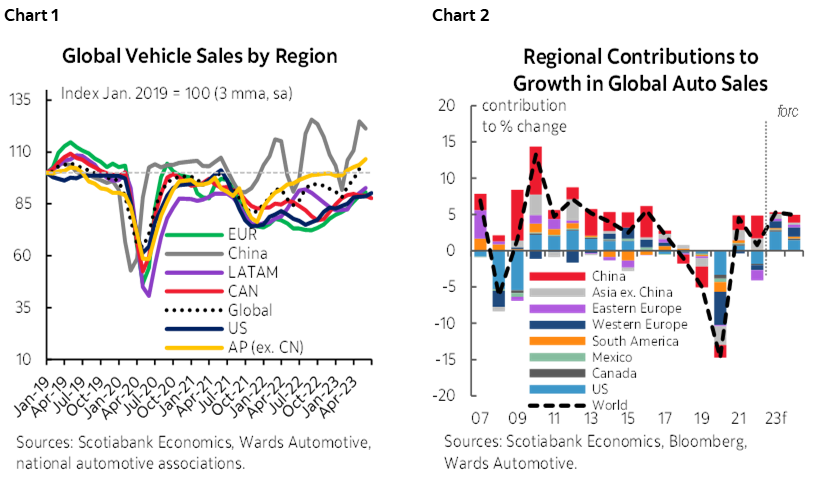
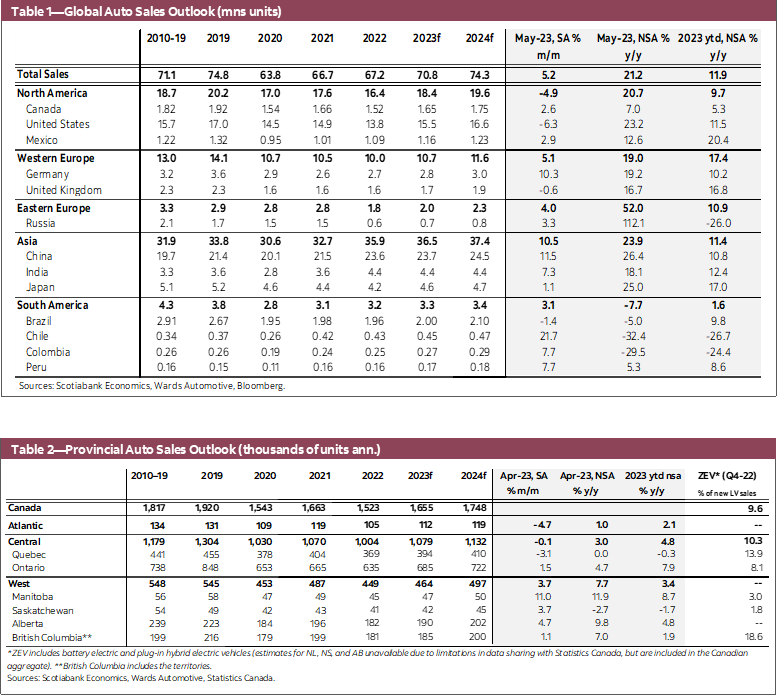
GLOBAL AUTO SALES: MAY REBOUNDS FROM SOFT APRIL
Global auto sales grew 5.2% m/m (sa) in May to 78.3 mn (saar) unit pace, the highest seasonally adjusted monthly pace since March 2019 (78.6 mn saar) (chart 1). The rebound of auto sales in May comes on the back of generally weaker sales in April across most regions. The pace of seasonally adjusted auto sales broadly improved in May for most of western Europe as sales were higher in thirteen of the fifteen countries covered—up 5.1% m/m (sa) to the pace of 11.9 mn (saar) units for the region. On a whole, this was a rebound from the previous month’s sales rate, where seasonally adjusted sales were down in 14 of the 15 countries in April. Of the major markets, higher sales in Germany (10.3% m/m sa) and France (3.0%) rebounded from April’s lower sales rate, while there were improvements in Italy (3.4%) and Spain (1.0%) that partially offset April’s decline, and the pace of auto sales continued to fall in the UK (-0.6%). Asia Pacific auto sales on a seasonally adjusted basis were up unanimously for the month of May across the six countries covered. Asia Pacific’s auto sales in May were greatly improved due to China’s 11.5% m/m (sa) increase as it makes up two thirds of the market share for the region, while Indonesia’s 91.7% increase is largely attributable to a compounding of a reversal from April’s larger than seasonal average drop in the sales rate. Auto sales were further supported from gains in India (7.3% m/m sa), Australia (5.7%), Japan (1.1%), and a marginal increase in South Korea (0.7%). The annual pace of auto sales in Latin America partially recovered from the soft patch in April, increasing 3.0% m/m (sa) in May for the region as a whole and registering positive seasonally adjusted growth in five of the 6 countries covered. Brazil’s second month of seasonally adjusted lower sales (-1.4% m/m sa) were entirely offset by gains in Argentina (9.4%), Chile (21.7%), Colombia (7.7%), Mexico (2.9%), and Peru (7.7%). Our global auto sales outlook forecasts vehicle sales increasing 5.6% in 2023 and 5.2% in 2024 (chart 2).
DISCLAIMER
This report has been prepared by Scotiabank Economics as a resource for the clients of Scotiabank. Opinions, estimates and projections contained herein are our own as of the date hereof and are subject to change without notice. The information and opinions contained herein have been compiled or arrived at from sources believed reliable but no representation or warranty, express or implied, is made as to their accuracy or completeness. Neither Scotiabank nor any of its officers, directors, partners, employees or affiliates accepts any liability whatsoever for any direct or consequential loss arising from any use of this report or its contents.
These reports are provided to you for informational purposes only. This report is not, and is not constructed as, an offer to sell or solicitation of any offer to buy any financial instrument, nor shall this report be construed as an opinion as to whether you should enter into any swap or trading strategy involving a swap or any other transaction. The information contained in this report is not intended to be, and does not constitute, a recommendation of a swap or trading strategy involving a swap within the meaning of U.S. Commodity Futures Trading Commission Regulation 23.434 and Appendix A thereto. This material is not intended to be individually tailored to your needs or characteristics and should not be viewed as a “call to action” or suggestion that you enter into a swap or trading strategy involving a swap or any other transaction. Scotiabank may engage in transactions in a manner inconsistent with the views discussed this report and may have positions, or be in the process of acquiring or disposing of positions, referred to in this report.
Scotiabank, its affiliates and any of their respective officers, directors and employees may from time to time take positions in currencies, act as managers, co-managers or underwriters of a public offering or act as principals or agents, deal in, own or act as market makers or advisors, brokers or commercial and/or investment bankers in relation to securities or related derivatives. As a result of these actions, Scotiabank may receive remuneration. All Scotiabank products and services are subject to the terms of applicable agreements and local regulations. Officers, directors and employees of Scotiabank and its affiliates may serve as directors of corporations.
Any securities discussed in this report may not be suitable for all investors. Scotiabank recommends that investors independently evaluate any issuer and security discussed in this report, and consult with any advisors they deem necessary prior to making any investment.
This report and all information, opinions and conclusions contained in it are protected by copyright. This information may not be reproduced without the prior express written consent of Scotiabank.
™ Trademark of The Bank of Nova Scotia. Used under license, where applicable.
Scotiabank, together with “Global Banking and Markets”, is a marketing name for the global corporate and investment banking and capital markets businesses of The Bank of Nova Scotia and certain of its affiliates in the countries where they operate, including; Scotiabank Europe plc; Scotiabank (Ireland) Designated Activity Company; Scotiabank Inverlat S.A., Institución de Banca Múltiple, Grupo Financiero Scotiabank Inverlat, Scotia Inverlat Casa de Bolsa, S.A. de C.V., Grupo Financiero Scotiabank Inverlat, Scotia Inverlat Derivados S.A. de C.V. – all members of the Scotiabank group and authorized users of the Scotiabank mark. The Bank of Nova Scotia is incorporated in Canada with limited liability and is authorised and regulated by the Office of the Superintendent of Financial Institutions Canada. The Bank of Nova Scotia is authorized by the UK Prudential Regulation Authority and is subject to regulation by the UK Financial Conduct Authority and limited regulation by the UK Prudential Regulation Authority. Details about the extent of The Bank of Nova Scotia's regulation by the UK Prudential Regulation Authority are available from us on request. Scotiabank Europe plc is authorized by the UK Prudential Regulation Authority and regulated by the UK Financial Conduct Authority and the UK Prudential Regulation Authority.
Scotiabank Inverlat, S.A., Scotia Inverlat Casa de Bolsa, S.A. de C.V, Grupo Financiero Scotiabank Inverlat, and Scotia Inverlat Derivados, S.A. de C.V., are each authorized and regulated by the Mexican financial authorities.
Not all products and services are offered in all jurisdictions. Services described are available in jurisdictions where permitted by law.