- Colombia: Economic growth fell short of market expectations, and posted an uneven recovery
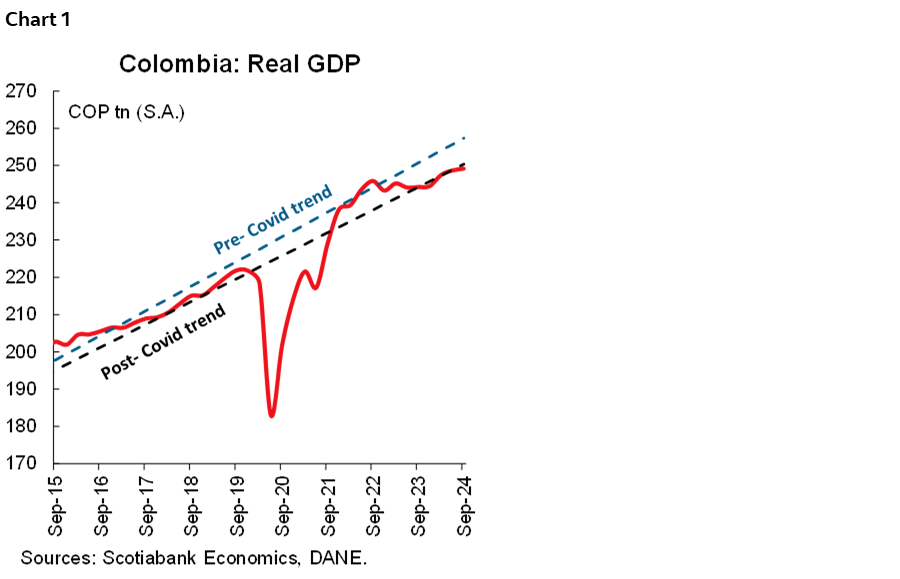
Data released by DANE on Monday, November 18th, showed that Colombia’s real GDP grew 2.0% y/y in Q3-2024, below the 2.3% expected by market consensus and BanRep’s forecast of 2.4%, and slightly above our forecast of 1.9% (chart 1). In seasonally adjusted terms, economic growth recorded a variation of 0.2% compared to the second quarter, slowing down versus the second quarter of 2024 (0.5% q/q). Economic activity shows heterogeneous behaviour in which most of the growth relies on a few sectors, while the sectors associated with a high employment demand are still posting moderate to null increases. On the demand side, there are some green shoots that arose from the recovery of imports, while investments remain lacking in the recovery.
That said, our take on yesterday’s data is that the economy is still transitioning through the bottom of the economic cycle, but we are still looking for a broader recovery force. For now we maintain our GDP growth forecast for 2024 at 1.5%, while for 2025 we expect an acceleration to 2.9% y/y. Regarding monetary policy, as we have highlighted in previous reports, the negative output gap is an argument for accelerating the easing cycle, however, the fiscal uncertainty maintains the cautious approach of the central bank board, and that is why, after yesterday’s data, we expect the central bank to cut the interest rate by 50bps at December’s meeting to close the year at 9.25%.
From a sectoral perspective, the economic activity results show a mixed picture, in which agricultural activities, leisure and public administration leverage growth, while manufacturing and mining offset the recovery. In the third quarter, agricultural activities grew by 10.7% y/y, the highest increase since 2017, and contributed 1.1 ppts to overall growth, reflecting good dynamism in crops, where coffee crops stand out (+33.6% y/y). Leisure was the second sector that contributed the most to the variation, with a growth of 14.1% y/y and a contribution of 0.5 ppts. In this context, according to the Economic Activity Indicator (ISE), in September leisure activity showed a positive performance (8.0% y/y), which implies a positive behaviour for the rest of the year. Despite it being positive to see the expansion of those sectors, we highlighted that Colombia should find a boarder source of expansion as the positive behaviour may not be repeated in 2025.
The manufacturing industry remained in negative territory for the sixth consecutive quarter but showed a slower acceleration compared to previous quarters. Manufacturing fell -1.3% y/y, subtracting 0.2 ppts from overall growth, showing weaker activity in the oil refining, textile, and food processing sectors. The oil and mining sector, with a variation of -7.1% y/y and a negative contribution of 0.5 ppts, also contributed negatively to third quarter results, with coal mining being the most affected.
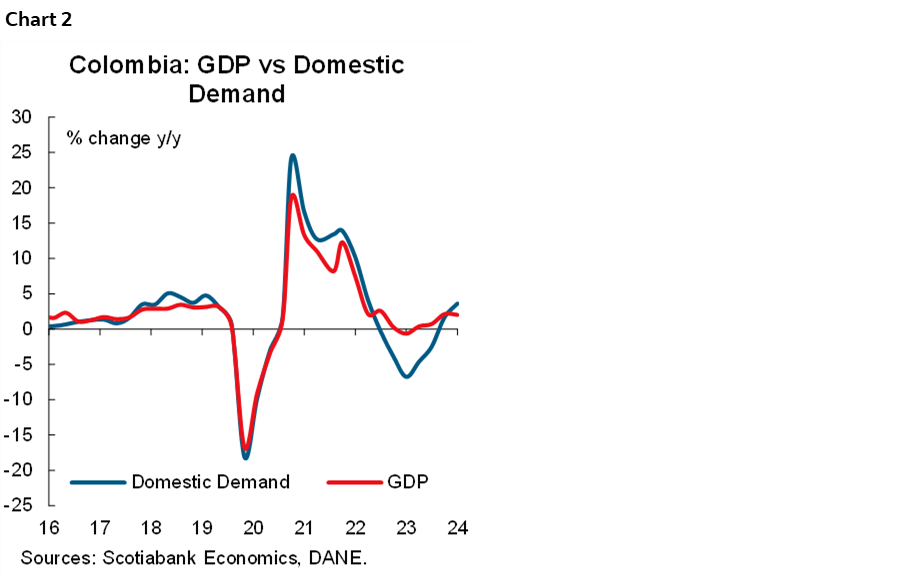
Domestic demand grew by 3.6% y/y driven by investments and imports (chart 2). Investments showed a considerable recovery, with a 22.7% y/y growth in gross capital formation and a 4.0% y/y increase in gross fixed capital formation, although investments continue well below pre-pandemic levels. Exports were the second component contributing to the overall GDP growth, with a growth of 3.8% and a contribution of 0.7 ppts, however, the improved export performance was offset by an 11% y/y increase in imports (which suggests a better domestic demand), increasing the trade deficit by 0.6 ppts compared to the previous quarter. Finally, final consumption grew by 0.7% y/y, contributing 0.6 ppts, showing a recovery in final household consumption, which grew by 1.6% YoY, led by higher spending on non-durable goods (+1.8% y/y) and services (+1.3% y/y), however, it is worth noting that durable goods recovered a bit expanding by 6.2% y/y after a negative base and 8.2% y/y contraction one year ago.
The results show that economic activity is subject to seasonal shocks and that growth in the first part of the year may not be sustainable. Agricultural activity has played an important role in the economic recovery in response to the improved behaviour of climatic changes and a greater supply of agriculture in the country. However, consumption continues to be uneven across sectors, with good dynamics in the services sector, although this puts pressure on manufacturing production. Looking at the monthly evolution of economic activity, we see a 1.2% y/y increase and a 0.2% m/m slowdown in September, complemented by inflation that remained below expectations in October, which could put pressure on the central bank to accelerate the pace of interest rate cuts. However, it is important to note that fiscal risks maintain our expectation of a 50bps cut in December. Before the next BanRep meeting, the board will have the economic activity results for October, the inflation data for November, current account data, and the advance of the minimum wage negotiations.
Key Highlights:
- On the supply side, agriculture contributed around 50% of economic growth with a variation of 10.7% y/y and a contribution of +1.1 ppts. Leisure was the second activity to contribute to growth with an increase of 14.1% y/y and a contribution of 0.5 ppts. In third place are the public administration activities, with a variation of 2.1% and a contribution of 0.3 ppts. Among other activities, construction grew by 4.1% y/y, a growth that is mainly attributed to a good dynamic in civil infrastructure works with an increase of 16.5% y/y.
- Overall commercial activity showed a slight recovery while financial and insurance activities rebounded with 4.4% y/y. Commercial activity grew by 1.0% y/y, showing a recovery amid a rebound in retail sales of technological equipment, household appliances and televisions. Financial and insurance activities continue to perform positively after registering a decline in the first quarter of the year.
- On the negative side, manufacturing industries, oil and mining activities were the ones that offset growth. Manufacturing industries fell by -1.3% y/y, subtracting -0.2 ppts and mining fell by -7.1% YoY, subtracting -0.5 ppts (charts 3 and 4).
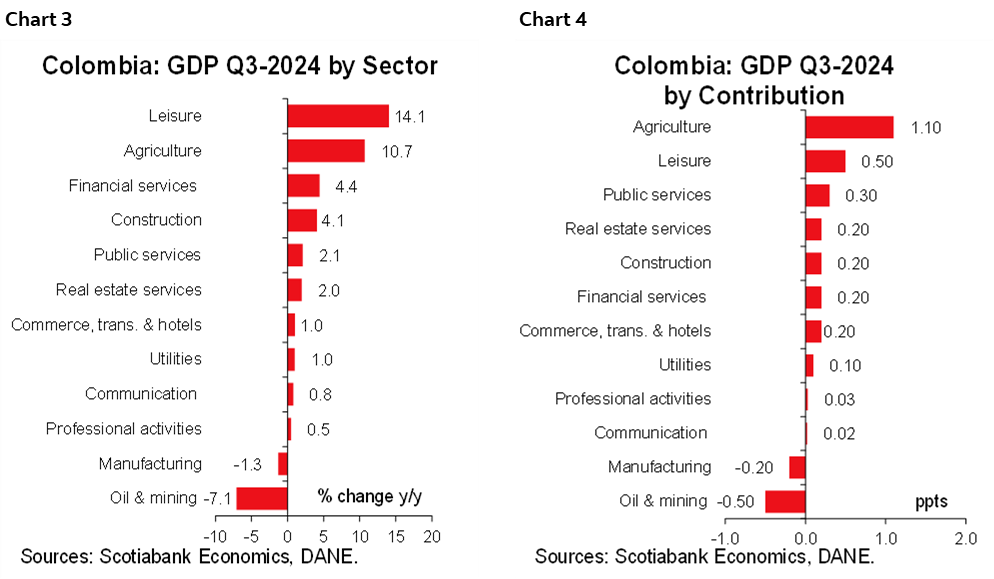
- In seasonally adjusted terms, economic growth was weak, with a variation of 0.2% q/q. Artistic activities grew the most (+3.6% q/q), followed by agricultural activities (+2.5% q/q) and the financial sector (+1.5% y/y). Meanwhile, oil and mining (-2.1% q/q), public administration (-0.7% q/q) and the provision of utilities and construction fell -0.2% q/q, respectively.
- Consumption and increased exports drove the growth of domestic demand. Domestic demand increased by 3.6% y/y and 0.7% q/q. Consumption contributed the most, with a variation of 0.7% y/y and a contribution of 0.6 ppts. However, government spending fell -4.3% y/y and decreased -8.2% q/q during this period after an increase of 2.4% q/q in the last quarter. Household consumption grew 1.6% y/y, reflecting higher spending on non-durable goods (+1.8% y/y), services (+1.4% y/y) and durable goods (+6.2% y/y), while spending on semi-durable goods fell -1.2% y/y, associated with lower demand for textile products. Exports increased 3.8% y/y, contributing 0.7 ppts, while imports had a variation of +11.0% y/y, offsetting with -2.4 ppts. It is worth noting that the importing of goods, expanding by 13.3% y/y, is a good sign but not enough to offset the contraction of one year ago (-28.7% y/y), see charts 5 and 6.
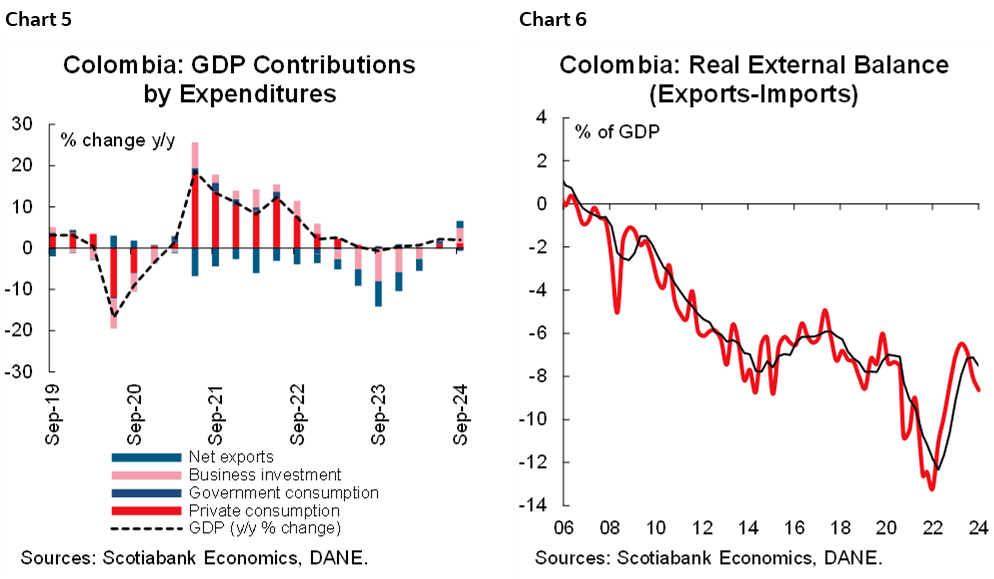
- In the case of investments, gross capital formation expanded by 22.7%; however, investments expanded by only 4.0%, suggesting that inventories increased during the third quarter. In the case of investment, the main contributors were other buildings (+12.8% y/y) and machinery and equipment (+5.9% y/y), while investment in housing contracted the most since 2020 by 9.1% y/y, showing a still-weak balance. Investment in the construction sector remain 21% below pre-pandemic times, while machinery and equipment is 26% above pre-pandemic times.
Economic Activity Indicator (ISE):
In September, the ISE grew by 1.2% compared to September 2023, with eight of the twelve activities showing positive variations. The growth was mainly due to an increase in the agriculture sector of 7.6% y/y with a contribution of 0.8 ppts, public administration which increased 3.7% y/y and contributed 0.5 ppts, followed by leisure with an increase of 8.0% y/y with a contribution of 0.5 ppts. On the negative side, oil and mining recorded a drop of -8.7% y/y subtracting 0.6 ppts of the result, followed by manufacturing, which contracted -3.3% y/y subtracting 0.4 ppts.
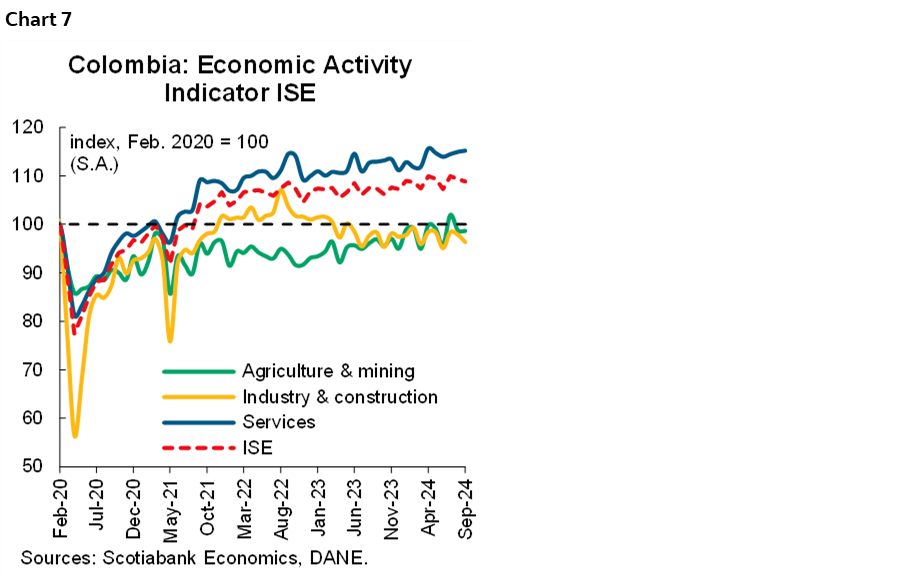
On a seasonally adjusted basis, the ISE fell by -0.4% compared to August 2024, showing declines in nine of the twelve activities. In September, the secondary sector was the one that fell the most compared to the previous month (-1.6% m/m), and does not seem to show evidence of a recovery in the short-term. The primary sector (-0.1% m/m) shows declines in the agricultural sector (-0.3% m/m) and the oil and mining sector (-0.8% m/m), while service activities (+0.2% m/m) offset this behaviour with positive dynamics in leisure, professional and financial activities (chart 7).
—Jackeline Piraján & Valentina Guio
DISCLAIMER
This report has been prepared by Scotiabank Economics as a resource for the clients of Scotiabank. Opinions, estimates and projections contained herein are our own as of the date hereof and are subject to change without notice. The information and opinions contained herein have been compiled or arrived at from sources believed reliable but no representation or warranty, express or implied, is made as to their accuracy or completeness. Neither Scotiabank nor any of its officers, directors, partners, employees or affiliates accepts any liability whatsoever for any direct or consequential loss arising from any use of this report or its contents.
These reports are provided to you for informational purposes only. This report is not, and is not constructed as, an offer to sell or solicitation of any offer to buy any financial instrument, nor shall this report be construed as an opinion as to whether you should enter into any swap or trading strategy involving a swap or any other transaction. The information contained in this report is not intended to be, and does not constitute, a recommendation of a swap or trading strategy involving a swap within the meaning of U.S. Commodity Futures Trading Commission Regulation 23.434 and Appendix A thereto. This material is not intended to be individually tailored to your needs or characteristics and should not be viewed as a “call to action” or suggestion that you enter into a swap or trading strategy involving a swap or any other transaction. Scotiabank may engage in transactions in a manner inconsistent with the views discussed this report and may have positions, or be in the process of acquiring or disposing of positions, referred to in this report.
Scotiabank, its affiliates and any of their respective officers, directors and employees may from time to time take positions in currencies, act as managers, co-managers or underwriters of a public offering or act as principals or agents, deal in, own or act as market makers or advisors, brokers or commercial and/or investment bankers in relation to securities or related derivatives. As a result of these actions, Scotiabank may receive remuneration. All Scotiabank products and services are subject to the terms of applicable agreements and local regulations. Officers, directors and employees of Scotiabank and its affiliates may serve as directors of corporations.
Any securities discussed in this report may not be suitable for all investors. Scotiabank recommends that investors independently evaluate any issuer and security discussed in this report, and consult with any advisors they deem necessary prior to making any investment.
This report and all information, opinions and conclusions contained in it are protected by copyright. This information may not be reproduced without the prior express written consent of Scotiabank.
™ Trademark of The Bank of Nova Scotia. Used under license, where applicable.
Scotiabank, together with “Global Banking and Markets”, is a marketing name for the global corporate and investment banking and capital markets businesses of The Bank of Nova Scotia and certain of its affiliates in the countries where they operate, including; Scotiabank Europe plc; Scotiabank (Ireland) Designated Activity Company; Scotiabank Inverlat S.A., Institución de Banca Múltiple, Grupo Financiero Scotiabank Inverlat, Scotia Inverlat Casa de Bolsa, S.A. de C.V., Grupo Financiero Scotiabank Inverlat, Scotia Inverlat Derivados S.A. de C.V. – all members of the Scotiabank group and authorized users of the Scotiabank mark. The Bank of Nova Scotia is incorporated in Canada with limited liability and is authorised and regulated by the Office of the Superintendent of Financial Institutions Canada. The Bank of Nova Scotia is authorized by the UK Prudential Regulation Authority and is subject to regulation by the UK Financial Conduct Authority and limited regulation by the UK Prudential Regulation Authority. Details about the extent of The Bank of Nova Scotia's regulation by the UK Prudential Regulation Authority are available from us on request. Scotiabank Europe plc is authorized by the UK Prudential Regulation Authority and regulated by the UK Financial Conduct Authority and the UK Prudential Regulation Authority.
Scotiabank Inverlat, S.A., Scotia Inverlat Casa de Bolsa, S.A. de C.V, Grupo Financiero Scotiabank Inverlat, and Scotia Inverlat Derivados, S.A. de C.V., are each authorized and regulated by the Mexican financial authorities.
Not all products and services are offered in all jurisdictions. Services described are available in jurisdictions where permitted by law.