- Colombia: Economic growth in Q1-24 fell short of expectations, but it won’t be enough to trigger a faster easing cycle
- Peru: March GDP weakness did not surprise
COLOMBIA: ECONOMIC GROWTH IN Q1-24 FELL SHORT OF EXPECTATIONS, BUT IT WON’T BE ENOUGH TO TRIGGER A FASTER EASING CYCLE
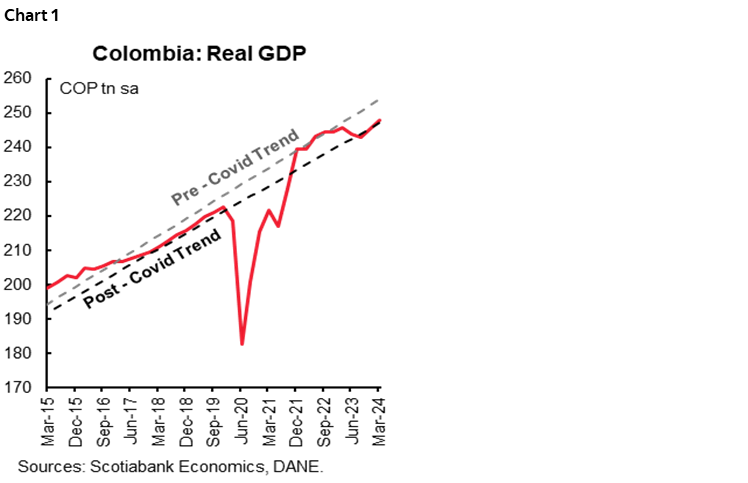
Data released by DANE on Wednesday, May 15th showed that Colombia’s real GDP grew 0.7% y/y in Q1-24, beating BanRep’s forecast of 0.3% y/y but below the market consensus and our forecasts (0.8% y/y and 1.1% y/y, respectively). On a seasonally adjusted basis (chart 1), growth was modest at 1.1% q/q, a slight improvement from the 1% q/q recorded in the previous quarter and its best performance since mid-2022. Although GDP results were weaker than market expectations, we do not think they will be enough to motivate BanRep to accelerate its pace of monetary easing at its next meeting in June, when we expect a 50bps cut.
The economic sectors that contributed to GDP growth were public administration and defense, agriculture, public services, arts and entertainment, real estate, and construction, which together contributed 1.73 ppts to the overall y/y expansion. On the other hand, manufacturing, retail sales, finance and insurance, and mining and quarrying were the main activities that had a negative combined contribution of -1.1 ppts. The March index of economic activity (ISE) reflected a similar patterned, weakening significantly in March by 1.5% y/y, as some sectors related to manufacturing, retail sales, and agriculture were the biggest negative contributors totaling a 2.2ppts drag on the ISE.
In the expenditure accounts, domestic demand fell by 2.6% y/y in the first quarter of 2024, again due to a fall in gross fixed capital formation (-13.4% y/y) and the mild expansion of final consumption (0.4% y/y). The main concern continues to be investment, which showed a weak performance, as fixed capital formation contracted by 6.5% y/y, again due to a fall in machinery and equipment as well as construction (residential and non-residential). In addition, inventories remain in contractionary territory at the beginning of 2024. As for consumption, household spending grew by a moderate 0.6%, concentrated in services, which continue to grow but at a slower pace (1.8% y/y). As for the demand for durable and semi-durable goods, they remain in contractionary territory (-8.3% y/y and -6.1% y/y, respectively). Moreover, it is surprising that government consumption expenditure, which seemed to be resilient, has left behind the impulses of recent quarters and registered a decline of 0.7% y/y in the first quarter of the year.
Although yesterday’s results reflect economic weakness, we do not believe that yesterday’s data will materially surprise BanRep’s Board of Directors since staff projection for Q1-2024 was 0.3% y/y. BanRep’s staff estimate of the output gap is lower than the expectations set at the beginning of the year, due to an increase in the GDP growth forecast. For 2024, growth is projected at 1.4%, indicating a gradual recovery, albeit still below potential, in an environment of somewhat less tight external financing conditions and a less restrictive monetary policy over the forecast horizon, as inflation converges to the 3% target. As a result, BanRep’s board will wait for more evidence before considering accelerating the cycle of cuts, so at Scotiabank Colpatria Economics we expect a 50bps cut at the June 28th meeting.
Highlights
Industry GDP:
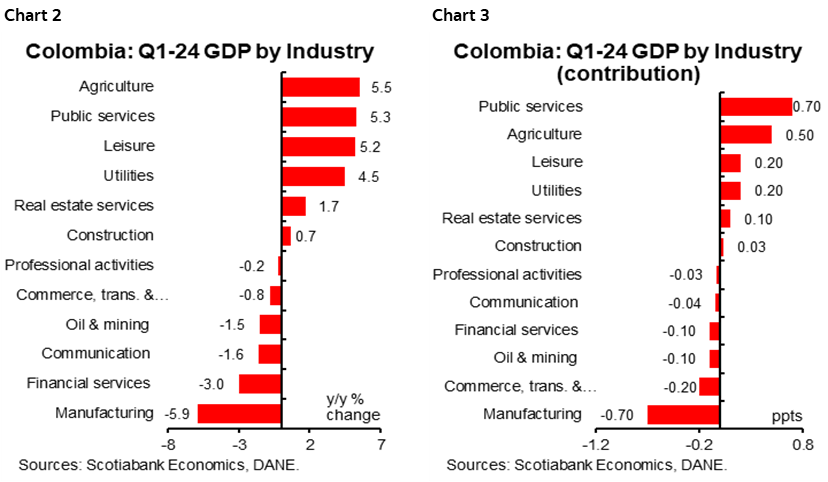
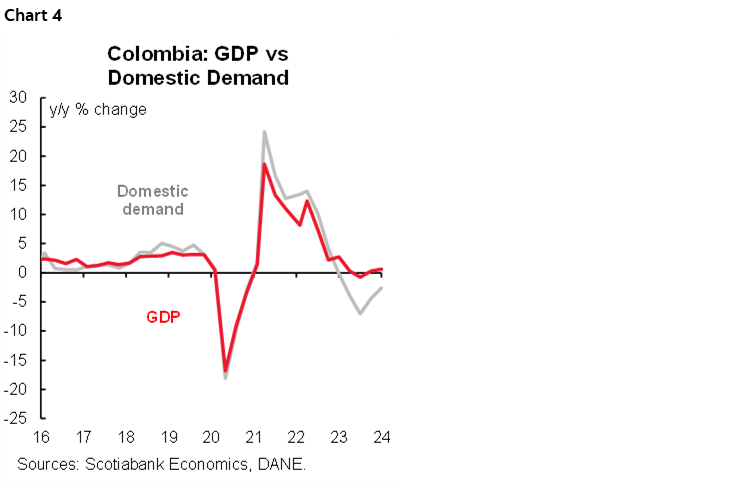
- The sectors that contributed most positively to the first quarter were public administration, with 5.3% y/y, explained by the payment of salaries to sectors of the judiciary and defense, followed by agriculture, livestock, and fishing along with the supply of public services, with expansions of 5.5% y/y and 4.5% y/y, respectively. Mainly the boost of early harvesting to prevent the impact of the El Niño phenomenon in the case of agriculture, while in public services the jump is attributed to the generation of electricity by thermal power plants. Thus, in aggregate, these three sectors made a positive contribution of 1.1 p.p. to GDP growth in the first quarter of 2024.
- In contrast, the three sectors that contracted most in the first quarter were manufacturing (-5.9% y/y), retail sales, transport, and hotels (-0.8% y/y), and financial services and insurance (-3% y/y). In manufacturing, the main declines were in non-metallic mineral products (related to weak construction activity), some food products, basic chemical products, and motor vehicles and engines. On the other hand, in retail sales, the main declines were related to the motor vehicle sector, in particular sales of fuel, vehicles, parts, spare parts, and motorcycles, which continues to highlight the strong year-on-year impact on consumer demand for durable goods, especially vehicles. As for the financial sector, the contraction is due to the lower number of financial transactions as a result of a restrictive monetary policy. Thus, these three sectors made a negative contribution of -1 p.p. to the total variation in the first quarter (chart 2 and chart 3).
- In seasonally adjusted terms, the activity with the highest quarterly growth was entertainment, with an expansion of 3.7% q/q, partly explained by the increase in gambling and sports betting, as well as the holding of regional celebrations in the first quarter of 2024. This was followed by public administration with an expansion of 2.0% q/q because of the payment of public sector salaries and the start of service contracts. In third place is the utilities sector (1.9% q/q), mainly due to the generation of energy by thermal power plants as a result of the increased demand caused by the El Niño phenomenon. On the other hand, information and communication and finance and insurance were the sectors that contracted the most in the first quarter (-3.1% q/q and -2.8% q/q, respectively).
Expenditure GDP:
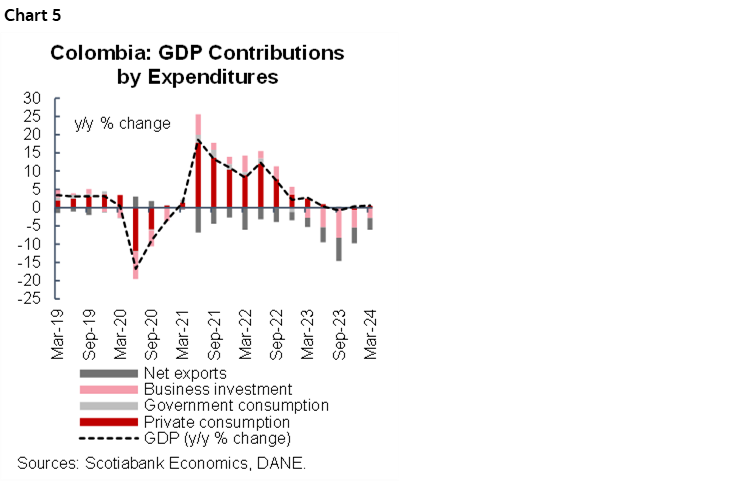
- Domestic demand contracted by 2.6% in the first quarter of 2024 (chart 4), for the fifth consecutive quarter and the lowest contraction rate for the first quarter. On a seasonally adjusted basis, however, domestic demand rebounded slightly by 0.5% q/q, due to a marginal increase in household spending.
- Final consumption expenditure continued to make a positive contribution to growth, albeit at a slower pace (0.4% y/y and a contribution of +0.1 p.p.). Household consumption grew by 0.6% y/y, driven by services (+1.8% y/y and 1 p.p.) and defensive goods (+0.8% y/y and 0.3 p.p.). In contrast, durable and semi-durable consumer goods fell by 8.3% y/y and -6.1% y/y respectively, with a joint negative contribution of -0.7 p.p. In addition, the government’s final consumption expenditure contracted by 0.7% y/y, leaving behind the expansionary impulse of the previous three quarters.
- In seasonally adjusted quarterly terms, household final consumption expenditure fell by 0.3% q/q. This was due to a decline in household final consumption expenditure, which fell by 0.1% q/q, mainly as a result of a fall in demand for semi-durable consumer goods such as clothing and footwear. On the other hand, government final consumption expenditure grew by 0.9% q/q, partly due to payments to sectors of the judiciary and the start of the year for service contracts at the beginning of the year.
- Gross fixed capital formation contracted by 13.4% y/y and made a negative contribution of -2.9 p.p. to the total variation of GDP in the first quarter of 2024, the smallest decrease of the last three quarters (chart 5). This decline is mainly related to the fall in gross fixed capital formation (GFCF), which contracted by 6.5% y/y, driven by the fall in machinery and equipment, followed by dwelling investments with contractions of -10.8% y/y and -6.8% y/y, respectively, making a joint negative contribution of -6.1 p.p. to the variation in investment.
- In seasonally adjusted terms, gross fixed capital formation decreased by 0.6% q/q, explained by a decrease in inventories, which continues to contribute negatively to the variation. On the other hand, gross fixed capital formation increased by 2.5% q/q after four quarters of negative growth. Within this component, the most significant expansions were recorded in machinery equipment and housing (9.4 q/q and 3.2 q/q, respectively).
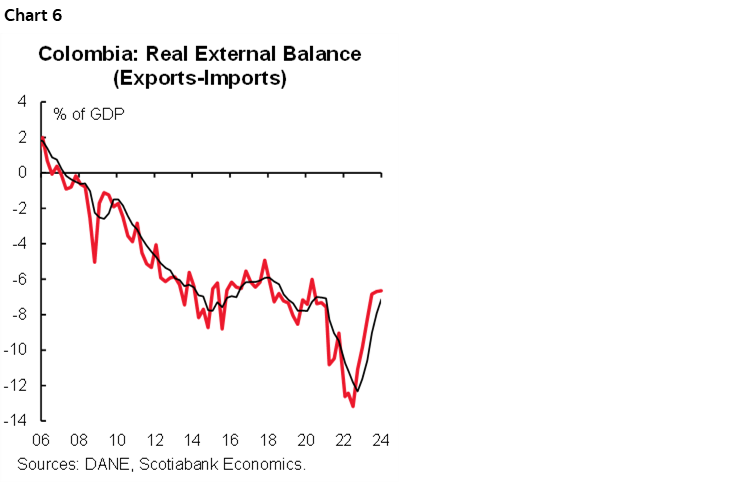
- External deficit stood at 6.7% of GDP in the first quarter (chart 6). Exports grew by a modest 0.7% y/y and contributed 0.3 p.p., while imports contracted by 12.9% y/y and contributed 3.2 p.p., still reflecting the contraction in domestic demand and a significant reduction in imports due to lower investment, which justifies a narrowing of the real external deficit.
Economic Activity Indicator (ISE):
- In March 2024, the ISE slowed down significantly to 1.5% y/y (chart 7), due to a setback in manufacturing (-10.8% y/y), retail sales (-2.4% y/y), and agriculture (-4.2% y/y), which contributed negatively to the ISE variation with -2.2 p.p. On the other hand, the sectors that most compensated for the decline with significant growth and contributions were public administration (6.3% y/y), recreation (3.6% y/y), and public services (4.1% y/y), which together contributed 1.4 p.p. to the variation of the indicator.
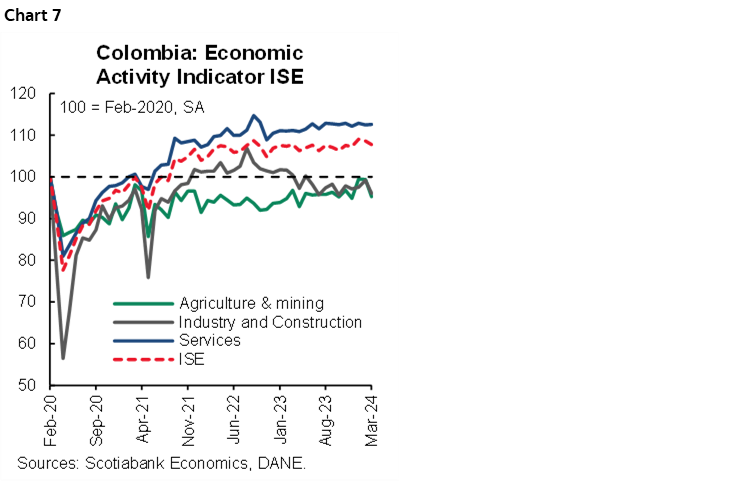
- In seasonally adjusted terms, the ISE recorded a contraction of 0.8% m/m in March, due to a fall in two of the three groups of economic activities: primary activities -4.1% m/m due to a fall in agriculture (-6.7% m/m), while secondary activities contracted by 3.1% m/m due to a fall in both construction and manufacturing. Finally, tertiary activities grew by a modest 0.1% m/m, thanks to the recovery of public administration (1.9% y/y) and recreational activities (1.1% y/y).
—Santiago Moreno
PERU: MARCH GDP WEAKNESS DID NOT SURPRISE
Drat! We were hoping to be wrong. But, we weren’t. March GDP growth came in negative, at -0.3% YoY, as we were expecting, and quite worse than market expectations of +0.8% YoY.
There were two reasons for low growth in March. One was the Easter calendar effect, and the other was the huge 32% YoY decline in fishing. The Easter calendar effect shaved two working days from March this year compared to March in 2023. No surprise, then, that with less working days, nearly all (seasonally adjusted) month-on-month growth figures (compared to February) were negative.
Interestingly enough, though, two sectors that showed positive MoM growth were agriculture, up 1.2% MoM, and fishing, up 3.2% YoY. This is interesting because they are sectors that had, here-to-fore, been most negatively affected by El Niño. March is the first clear indication that the El Niño effect is behind us.
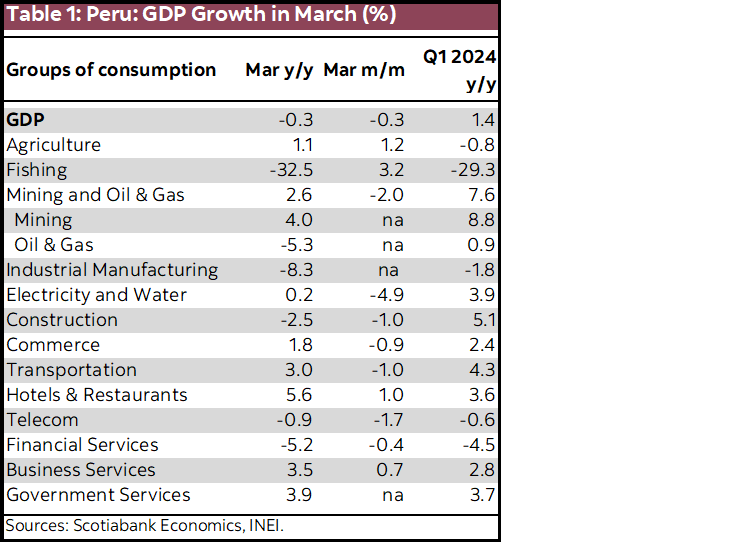
So, how do we reconcile this idea of no El Niño with the 32.5% YoY decline in fishing GDP in March? Mostly through timing. March is an off-season month, and fishing has little weight. To see the impact of the change in weather patterns on fishing, one need only look at April, when the anchovy (fishmeal) fishing season began with a bang! Fishmeal fishing increased 145% YoY in April.
Perhaps the greatest disappointment in March, however, was industrial manufacturing, which plunged 8.3% YoY. This was all the more disappointing, because it was off an already soft March 2023. Although many of the service industries linked to domestic demand are showing growth, the two sectors that are most representative of household welfare, industrial manufacturing and construction, are still weak or unreliable (in the case of construction).
Thankfully, March GDP growth is not representative of the state of the economy. April GDP and growth thereafter should do much better, surpassing 3.0% during most of Q2 and Q3. April, in particular, should be strong, given that it will benefit from the two additional days that March lost, as well as from the huge increase in fishing.
—Guillermo Arbe
DISCLAIMER
This report has been prepared by Scotiabank Economics as a resource for the clients of Scotiabank. Opinions, estimates and projections contained herein are our own as of the date hereof and are subject to change without notice. The information and opinions contained herein have been compiled or arrived at from sources believed reliable but no representation or warranty, express or implied, is made as to their accuracy or completeness. Neither Scotiabank nor any of its officers, directors, partners, employees or affiliates accepts any liability whatsoever for any direct or consequential loss arising from any use of this report or its contents.
These reports are provided to you for informational purposes only. This report is not, and is not constructed as, an offer to sell or solicitation of any offer to buy any financial instrument, nor shall this report be construed as an opinion as to whether you should enter into any swap or trading strategy involving a swap or any other transaction. The information contained in this report is not intended to be, and does not constitute, a recommendation of a swap or trading strategy involving a swap within the meaning of U.S. Commodity Futures Trading Commission Regulation 23.434 and Appendix A thereto. This material is not intended to be individually tailored to your needs or characteristics and should not be viewed as a “call to action” or suggestion that you enter into a swap or trading strategy involving a swap or any other transaction. Scotiabank may engage in transactions in a manner inconsistent with the views discussed this report and may have positions, or be in the process of acquiring or disposing of positions, referred to in this report.
Scotiabank, its affiliates and any of their respective officers, directors and employees may from time to time take positions in currencies, act as managers, co-managers or underwriters of a public offering or act as principals or agents, deal in, own or act as market makers or advisors, brokers or commercial and/or investment bankers in relation to securities or related derivatives. As a result of these actions, Scotiabank may receive remuneration. All Scotiabank products and services are subject to the terms of applicable agreements and local regulations. Officers, directors and employees of Scotiabank and its affiliates may serve as directors of corporations.
Any securities discussed in this report may not be suitable for all investors. Scotiabank recommends that investors independently evaluate any issuer and security discussed in this report, and consult with any advisors they deem necessary prior to making any investment.
This report and all information, opinions and conclusions contained in it are protected by copyright. This information may not be reproduced without the prior express written consent of Scotiabank.
™ Trademark of The Bank of Nova Scotia. Used under license, where applicable.
Scotiabank, together with “Global Banking and Markets”, is a marketing name for the global corporate and investment banking and capital markets businesses of The Bank of Nova Scotia and certain of its affiliates in the countries where they operate, including; Scotiabank Europe plc; Scotiabank (Ireland) Designated Activity Company; Scotiabank Inverlat S.A., Institución de Banca Múltiple, Grupo Financiero Scotiabank Inverlat, Scotia Inverlat Casa de Bolsa, S.A. de C.V., Grupo Financiero Scotiabank Inverlat, Scotia Inverlat Derivados S.A. de C.V. – all members of the Scotiabank group and authorized users of the Scotiabank mark. The Bank of Nova Scotia is incorporated in Canada with limited liability and is authorised and regulated by the Office of the Superintendent of Financial Institutions Canada. The Bank of Nova Scotia is authorized by the UK Prudential Regulation Authority and is subject to regulation by the UK Financial Conduct Authority and limited regulation by the UK Prudential Regulation Authority. Details about the extent of The Bank of Nova Scotia's regulation by the UK Prudential Regulation Authority are available from us on request. Scotiabank Europe plc is authorized by the UK Prudential Regulation Authority and regulated by the UK Financial Conduct Authority and the UK Prudential Regulation Authority.
Scotiabank Inverlat, S.A., Scotia Inverlat Casa de Bolsa, S.A. de C.V, Grupo Financiero Scotiabank Inverlat, and Scotia Inverlat Derivados, S.A. de C.V., are each authorized and regulated by the Mexican financial authorities.
Not all products and services are offered in all jurisdictions. Services described are available in jurisdictions where permitted by law.