- Chile: GDP growth expectations continue to move closer to our 3% projection for this year
- Colombia: Manufacturing and retail sales closed the first quarter with a negative performance
After yesterday’s market head fake on the US PPI beat but with large negative revisions, rates, currencies, and equities have been in a good mood continuing through Asia hours and extending through the European morning—particularly in rates and FX. Overnight developments included slightly weaker than expected Aussie wages data and a report that the Chinese government is looking at options to purchase unsold homes from developers, with both generally overlooked by local markets.
US equity futures are steady about 1% shy of the all-time highs in early-April, while European bourses are mixed to stronger. Currencies are broadly firmer against the USD with gains accelerating in Europe dealing, though the MXN is not doing much at all except for hanging around the 18.45 level. Crude oil is steady in contrast to a 1% decline in iron ore and against a 3% jump in copper where a short squeeze has its price 10%+ higher for the week.
USTs have a nice bid of ~2bps across the curve, with triple these moves in gilts and EGBs, as markets trade with a high degree of confidence into today’s US CPI release that is bound to drive G10 and Latam markets. Some caution may be warranted with the US CPI print threatening the market’s optimism (retail sales data are out at the same time, too).
After the release of US CPI, Peru and Colombia publish March and March/Q1 GDP data at 11ET and 12ET, respectively. We think today’s figures should be taken with a grain of salt considering calendar effects (Easter timing) and other idiosyncratic matters (like fishing collapse y/y in Peru). Yesterday’s retail sales and manufacturing production data out of Colombia was much worse than expected (see below), which tees up a more negative performance than the –0.4% y/y median projection by economists polled by Bloomberg.
—Juan Manuel Herrera
CHILE: GDP GROWTH EXPECTATIONS CONTINUE TO MOVE CLOSER TO OUR 3% PROJECTION FOR THIS YEAR
In its Public Finance Report (Q1-2024), the Ministry of Finance (MoF) revised upwards its 2024 GDP growth projection from 2.5% to 2.7%, slightly above the central bank’s point estimate (2.6%) and above market expectations (2.5%), which continue to be revised upwards. We maintain our GDP growth forecast of 3% for this year.
Higher fiscal revenues due to higher copper prices and better GDP growth prospects are not enough to offset lower lithium revenues. Considering that fiscal revenues are estimated to increase by between USD 20 and 25 mn for each cent per pound of higher copper prices and around USD 500 mn for each extra point of GDP growth, in 2024 the government would have higher revenues of between USD 800 mn and USD 1 bn. However, given the fall in the price of lithium, the government estimates lower revenues of USD 1.3 bn for 2024 from property rents compared to the Q3-2023 Public Finance Report (base projections for the 2024 Fiscal Budget). With this—and without major changes in the expenditure projection—the MoF maintained the projection for the effective fiscal deficit at 1.9% of GDP for this year.
The MoF expects the copper price at USD 4.2 per pound until 2028, above the long-term price estimate made by experts (USD 386 per pound), which should be revised in August this year, just before the presentation of the Fiscal Budget bill for 2025. In line with our view, the MoF projects that the copper price would remain at high levels for longer.
—Aníbal Alarcón
COLOMBIA: MANUFACTURING AND RETAIL SALES CLOSED THE FIRST QUARTER WITH A NEGATIVE PERFORMANCE
On Tuesday, May 14th, the National Statistics Institute (DANE) published the manufacturing and retail sales data for March 2024, which stood well below market expectations. Real manufacturing output contracted by 11.1% y/y in March 2024, below analysts’ forecasts (-7.5% y/y). As for real retail sales, they fell 5.6% y/y in March, worse than the market consensus of -3.5% y/y. Both indicators completed thirteen months of contraction in a row, and both have activity levels similar to those observed in mid-2021, still reflecting the effect of more moderate domestic demand.
In manufacturing, the main contractions came from non-metallic mineral products, other processed food and bakery products, basic chemicals, and motor vehicles and their engines. Those four groups accounted for -4.3 p.p. of the contraction. In the case of retail sales, the main declines were associated with the vehicles sector, specifically, there was a decline in sales of fuels, vehicles, parts, spare parts, and motorcycles, which together made a negative contribution of 5.3 p.p. This continues to highlight the strong year-on-year impact on consumer demand for durable goods, especially vehicles.
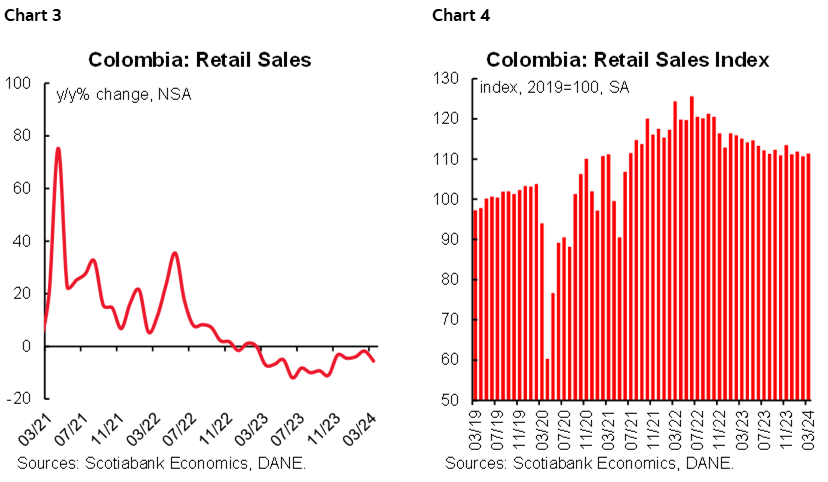
Looking at the margin results in seasonally adjusted terms, the picture is mixed. The manufacturing sector, for instance, contracted slightly for the third consecutive month, by 0.4% m/m. On the other hand, retail sales showed a modest expansion of 0.6% m/m, a slight recovery from the previous month’s -1% m/m decline. However, despite these fluctuations, both indicators are still struggling to find a bottom.
Despite the economic weakness reflected in today’s results, in our opinion BanRep won’t accelerate monetary policy easing. According to the latest monetary policy report of BanRep’s technical staff, GDP expectations for Q1-2024 are at 0.3% y/y, which is compatible with a weak March result. Having said that, we don’t think yesterday’s data surprised BanRep’s board. On the other side, the output gap estimate is lower versus the expectations set at the beginning of the year due to an increase in GDP growth projection. The excess capacity is expected to decline gradually in the second half of 2025.
All in all, BanRep’s board is likely to wait for more evidence before considering accelerating cuts. At Scotiabank Colpatria Economics we expect a 50bps cut at the June 28th meeting. Finally, looking ahead to today’s Q1-2024 GDP data and yesterday’s surprise, we expect an expansion of around 1.1% in Q1-2024. For 2024, the forecast is for 1.4% growth, indicating a gradual recovery, although still below potential.
Key Highlights:
Manufacturing Production:
Manufacturing production contracted a surprising 11.1% y/y in March 2024 (chart 1), a figure well below analyst expectations (-7.5% y/y). This marked the end of thirteen consecutive months of declines, the highest level since May 2020, and the lowest level for March since 2013. In seasonally adjusted terms (chart 2), the manufacturing sector also contracted slightly for the third consecutive month, by 0.4% m/m. Of the thirty-nine industrial activities covered by the survey, a total of thirty-six recorded negative changes in their real output, subtracting 11.6 p.p. from the total annual change, and three subsectors with positive changes together added 0.6 p.p. to the total change.
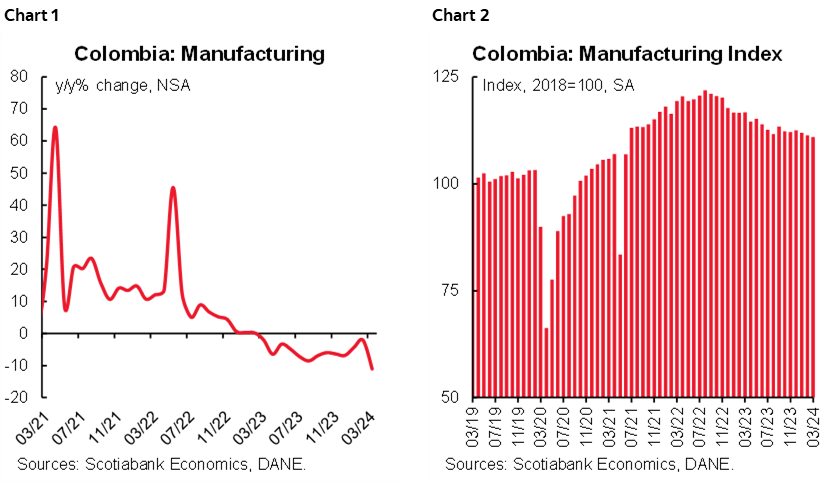
The largest annual falls were recorded for the manufacturing of non-metallic mineral products (-5.3% y/y), the preparation of other food products (-19.1% y/y), the manufacturing of basic chemicals (-20.3% y/y), the manufacturing of bakery products, the processing and preserving of meat, fish and other food products (-13.7% y/y) and the manufacturing of motor vehicles and their engines (-58% y/y). These activities accounted for -4.3 p.p. of the total annual variation in manufacturing production.
In addition, some activities related to the production of durable and semi-durable consumer goods, such as clothing (-14.1% y/y), textiles (-21.7% y/y), furniture and mattresses (-15.4% y/y) and footwear (-18.2% y/y), remained in negative territory and continued to show no encouraging change in trend, contributing -1.2 p.p. to the total variation of the group.
On the other hand, the three best-performing activities were basic iron and steel, sugar and panela production, and motor vehicle bodies, which together contributed 0.6 p.p. to the annual variation.
In the YTD until the first quarter of 2024, real manufacturing output showed a variation of -6%, mainly due to declines in the manufacturing of non-metallic mineral products (-11.6%), the manufacturing of clothing (-11.8%), and the manufacturing of chemical products (-13.3%), which together contributed -1.6 p.p. to total output.
Retail sales:
Retail sales fell 5.6% y/y in March (chart 3), surprising the market on the downside (-3.5% y/y). Like the manufacturing sector, this was the thirteenth month in contraction territory and the largest decline since October 2023. During the month, eleven of the nineteen basic product groups recorded negative year-on-year changes in real turnover, while eight basic product groups recorded positive year-on-year changes in turnover. In seasonally adjusted terms (chart 4), retail sales excluding trucks and public transport rose slightly by 0.6% m/m, compared with a fall of 1% in the previous month.
In annual terms, the main negative contributors to the annual rate of change were related to the transport sector, as fuels (-7.3% y/y), sales of motor vehicles (-15.9% y/y), spare parts, accessories and lubricants for motor vehicles (-19.8% y/y), and motorcycles and other vehicles (-13% y/y) were the main negative contributors to the annual rate of change in trade, recording a total of -5.3 p.p.
The largest positive contributions came from the sale of food (3.5% y/y), personal care products, cosmetics and perfume (6.8% y/y), and household appliances and furniture (7.2%), which together added 1.2 p.p. to the total. The expansion in furniture and appliances marks the third consecutive month of expansion in a sector that is heavily affected by high inflation and high interest rates. Throughout the year, several product lines related to durable and semi-durable goods are expected to continue to show moderate expansion results.
In the first quarter of the year, retail sales decreased by 3.9% compared to the first quarter of 2023. During this period, the sub-sectors with the largest negative contribution to sales were cars, motorcycles, and other non-auto vehicles and parts, accessories, and lubricants for motor vehicles, which together contributed -2.9 p.p.
Services and hotels:
In March, ten of the eighteen service subsectors recorded positive year-on-year changes in total nominal billings. The best-performing subsectors were health services (10% y/y), motion picture and television production (8% y/y), education (7.9% y/y), computer programming and consultancy (7.4% y/y) and restaurants (7.2% y/y). On the other hand, the sub-sectors with the largest decreases were activities related to news agencies (-13.6% y/y), call centers (-12.8% y/y), and translation activities (-9.7% y/y).
In the hotel sector, billings continued to contract, falling by 5.4% in real terms in March 2024, completing a year of contraction. In addition, in seasonally adjusted terms, there was a monthly contraction of 2.9% m/m, compared to an expansion of 4.7% m/m in February. As for hotel occupancy, it reached 49.7% in March 2024, down from 51.4% in February but still above the pre-pandemic average (49.1%).
—Jackeline Piraján & Santiago Moreno
DISCLAIMER
This report has been prepared by Scotiabank Economics as a resource for the clients of Scotiabank. Opinions, estimates and projections contained herein are our own as of the date hereof and are subject to change without notice. The information and opinions contained herein have been compiled or arrived at from sources believed reliable but no representation or warranty, express or implied, is made as to their accuracy or completeness. Neither Scotiabank nor any of its officers, directors, partners, employees or affiliates accepts any liability whatsoever for any direct or consequential loss arising from any use of this report or its contents.
These reports are provided to you for informational purposes only. This report is not, and is not constructed as, an offer to sell or solicitation of any offer to buy any financial instrument, nor shall this report be construed as an opinion as to whether you should enter into any swap or trading strategy involving a swap or any other transaction. The information contained in this report is not intended to be, and does not constitute, a recommendation of a swap or trading strategy involving a swap within the meaning of U.S. Commodity Futures Trading Commission Regulation 23.434 and Appendix A thereto. This material is not intended to be individually tailored to your needs or characteristics and should not be viewed as a “call to action” or suggestion that you enter into a swap or trading strategy involving a swap or any other transaction. Scotiabank may engage in transactions in a manner inconsistent with the views discussed this report and may have positions, or be in the process of acquiring or disposing of positions, referred to in this report.
Scotiabank, its affiliates and any of their respective officers, directors and employees may from time to time take positions in currencies, act as managers, co-managers or underwriters of a public offering or act as principals or agents, deal in, own or act as market makers or advisors, brokers or commercial and/or investment bankers in relation to securities or related derivatives. As a result of these actions, Scotiabank may receive remuneration. All Scotiabank products and services are subject to the terms of applicable agreements and local regulations. Officers, directors and employees of Scotiabank and its affiliates may serve as directors of corporations.
Any securities discussed in this report may not be suitable for all investors. Scotiabank recommends that investors independently evaluate any issuer and security discussed in this report, and consult with any advisors they deem necessary prior to making any investment.
This report and all information, opinions and conclusions contained in it are protected by copyright. This information may not be reproduced without the prior express written consent of Scotiabank.
™ Trademark of The Bank of Nova Scotia. Used under license, where applicable.
Scotiabank, together with “Global Banking and Markets”, is a marketing name for the global corporate and investment banking and capital markets businesses of The Bank of Nova Scotia and certain of its affiliates in the countries where they operate, including; Scotiabank Europe plc; Scotiabank (Ireland) Designated Activity Company; Scotiabank Inverlat S.A., Institución de Banca Múltiple, Grupo Financiero Scotiabank Inverlat, Scotia Inverlat Casa de Bolsa, S.A. de C.V., Grupo Financiero Scotiabank Inverlat, Scotia Inverlat Derivados S.A. de C.V. – all members of the Scotiabank group and authorized users of the Scotiabank mark. The Bank of Nova Scotia is incorporated in Canada with limited liability and is authorised and regulated by the Office of the Superintendent of Financial Institutions Canada. The Bank of Nova Scotia is authorized by the UK Prudential Regulation Authority and is subject to regulation by the UK Financial Conduct Authority and limited regulation by the UK Prudential Regulation Authority. Details about the extent of The Bank of Nova Scotia's regulation by the UK Prudential Regulation Authority are available from us on request. Scotiabank Europe plc is authorized by the UK Prudential Regulation Authority and regulated by the UK Financial Conduct Authority and the UK Prudential Regulation Authority.
Scotiabank Inverlat, S.A., Scotia Inverlat Casa de Bolsa, S.A. de C.V, Grupo Financiero Scotiabank Inverlat, and Scotia Inverlat Derivados, S.A. de C.V., are each authorized and regulated by the Mexican financial authorities.
Not all products and services are offered in all jurisdictions. Services described are available in jurisdictions where permitted by law.