- Colombia: BanRep’s Survey—Inflation expectations increased, while economist consensus expects BanRep to cut the rate by 50bps in March; Economic activity expanded in January due to agriculture and public sector, however the weakness in other sectors affirm our call for a 75bps cut; Imports began 2024 with a slow pace, marking fifteen consecutive months of declines. However, there was a slight increase in purchases of manufactured goods in January
COLOMBIA: BANREP’S SURVEY—INFLATION EXPECTATIONS INCREASED, WHILE ECONOMIST CONSENSUS EXPECTS BANREP TO CUT THE RATE BY 50 BPS IN MARCH
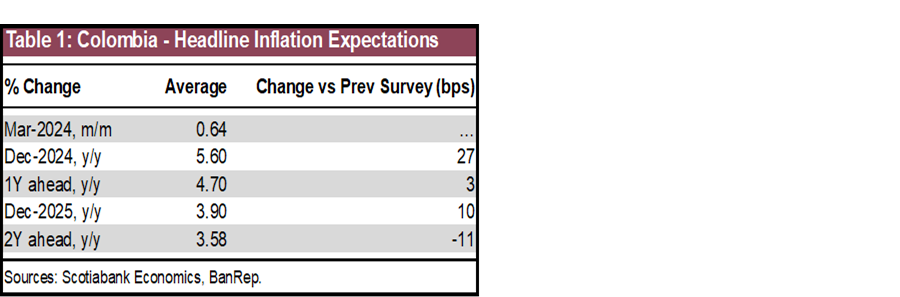
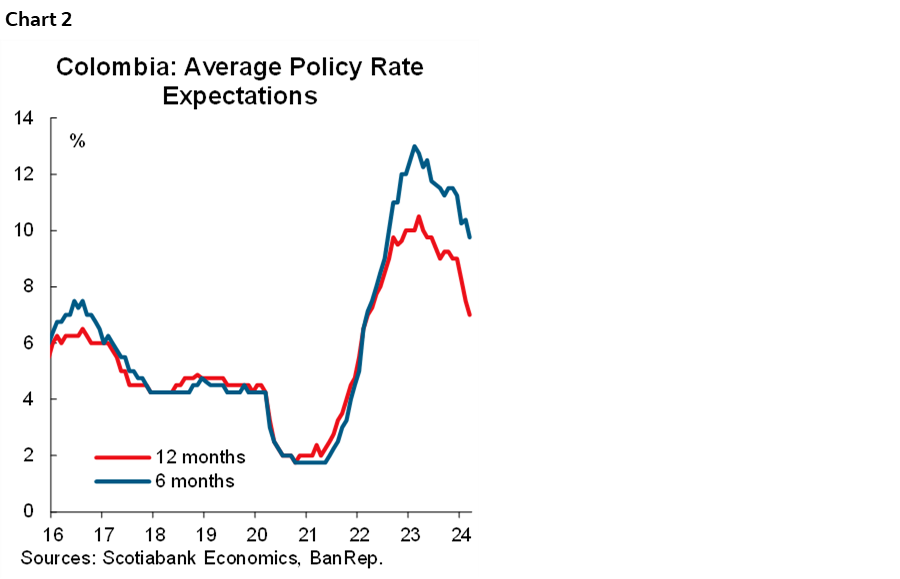
The Central Bank (BanRep) released the economist’s expectation survey for March. Inflation expectations increased for Dec 2024 and Dec 2025 to 5.60% and 3.90%, respectively. The inflation expectation for the 2y horizon (March 2026) decreased by 11bps to 3.58%. For the monetary policy rate, market consensus projects a 50bps cut at the March 22nd meeting; however, it is worth noting that despite recent negative surprises in economic growth, market consensus maintained the 50bps cut as the base case. For year end, the monetary policy rate is expected at 8.25%, above Scotiabank Colpatria’s projection of 7.50%.
In the short-term, the inflation expectation for March is at 0.67% m/m, which could take the annual inflation to 7.30% from the current 7.74%. Scotiabank Colpatria’s projection is 0.71% m/m, and 7.37% y/y. In March, the main contributor to inflation is expected to be the lodging and utilities group because March is usually when rent fees increase the most. Additionally, some regulated prices in the transport group are expected to increase due to increases in public transport fees, especially in the capital city (Bogotá) and utilities inflation is expected to continue to stay elevated.
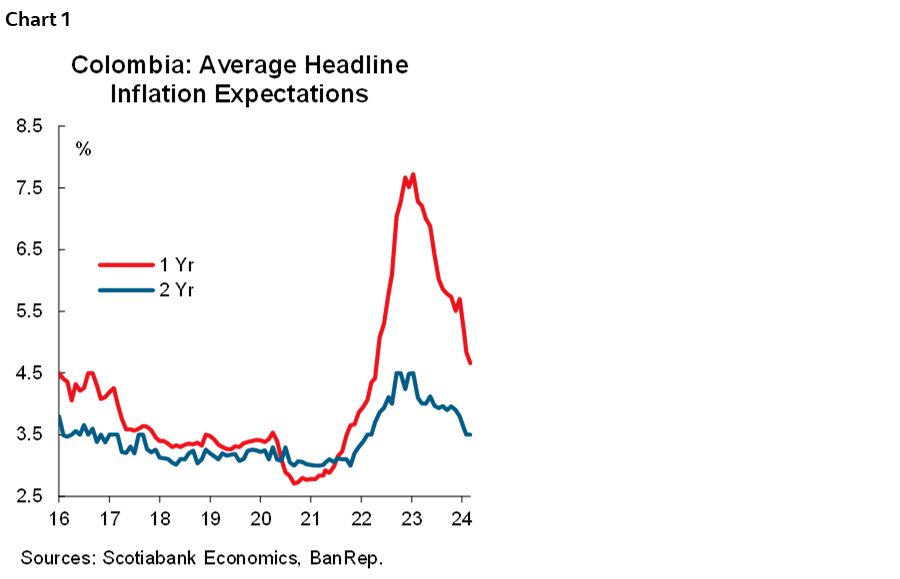
On Friday BanRep will decide about the monetary policy rate. Negative surprises in economic activity and the continuation in the disinflation process support the expectation for an acceleration in the cutting cycle. Market consensus is for a 50bps cut, while Scotiabank Colpatria’s expectation is for a 75bps cut in a split vote, however we have revised our expectation for the year-end rate from 7% to 7.50% assuming that in forthcoming months the central bank will continue the easing cycle with consecutive 75bps cuts (chart 1).
Key points from the survey:
- Short-term inflation expectation. For March, the consensus is 0.64% m/m, which implies an annual inflation rate of 7.30% y/y (down from 7.74% in February’s survey). The maximum expectation is 0.80%, and the minimum is 0.31%. Scotiabank Economics forecast is 0.71% m/m and 7.37% y/y. In March, we expect to see high inflation in the lodging and utility group, which will respond to the increase in utility fees and the indexation in rent fees that usually reflect the stronger effect in the third month of the year. Regulated prices in the transport group are expected to increase, because some cities, especially Bogotá, announced increases in transport fees. We project that food prices will continue to remain under control, which will help to see most of the disinflationary effect in the annual headline figure due to the high statistical base effect in 2023. It is worth noting that March will be the last month in which food prices will have a significant contribution from the high statistical base; in forthcoming months, we expect the inflation slowdown to lose steam.
- Medium-term inflation was revised to the upside. Inflation expectations for December 2024 increased by 27bps to 5.60% y/y (table 1). However, the headline inflation expectations for the one-year horizon were 4.70% y/y (+3bps). In comparison, the two-year outlook fell 11bps to 3.58% y/y, closer to the central bank’s target of 3%. At Scotiabank, we revised our forecast for Dec 2024 from 4.99% to 4.54% since indexation effects in the rent fees have been higher than expected.
- Policy rate. The median expectation points to a 50bps rate cut at the March and April meetings, while the rest of the meetings in 2024 point to 75bps rate cuts in each one (June, July, September, October, and December). With previous expectations, economists’ consensus points to an 8.25% lever for Dec 2024 and 5.50% for Dec 2025. Scotiabank Colpatria’s projection is 7.50% for Dec 2024 and 5.5% for Dec 2025 (chart 2).
- FX. The projections for the USDCOP exchange rate for the end of 2024 averaged 4008 pesos (33 pesos below previous survey). For December 2025, respondents, on average, expect the peso to settle at USDCOP 3985 pesos (previous 4004 pesos).
—Sergio Olarte & Jackeline Piraján
ECONOMIC ACTIVITY EXPANDED IN JANUARY DUE TO AGRICULTURE AND PUBLIC SECTOR, HOWEVER THE WEAKNESS IN OTHER SECTORS AFFIRM OUR CALL FOR A 75BPS CUT
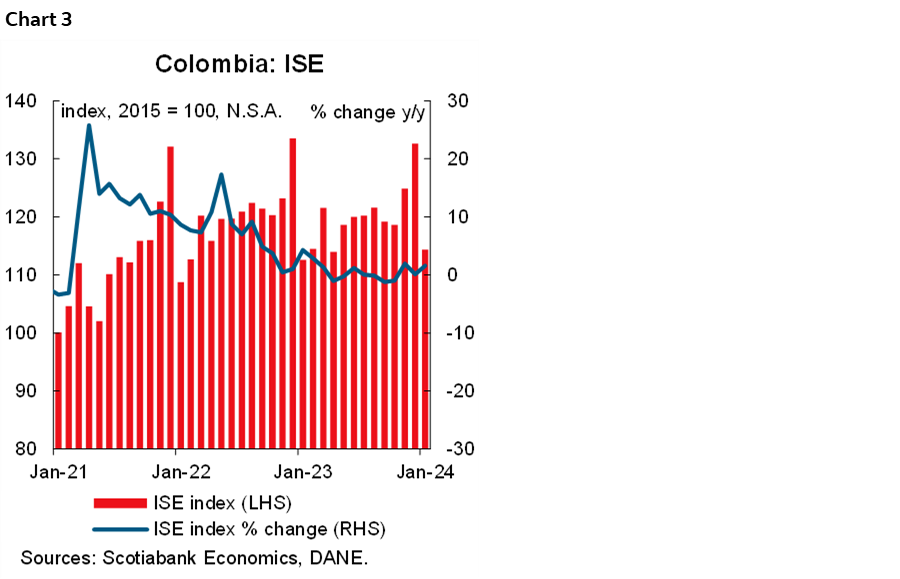
On Monday, March 18th, DANE published the latest data on the economic activity indicator (ISE) for January. The indicator showed an annual growth of 1.6% (chart 3), exceeding analysts’ expectations and our estimates of -0.4% y/y and 0.5% y/y, respectively. Monthly growth picked up, with seasonally adjusted growth of 2.2% m/m, the highest level since September 2021. It is worth noting that the positive surprise was mostly explained by the agriculture and mining and public sectors, while the rest of the sectors continued showing weaknesses. Having said that, it shouldn’t materially change the picture for the central bank about the economic activity weakness, we still think the possibility of having a 75bps rate cut is in the cards.
In January, primary activities showed a significant annual growth of 10.3% y/y, followed by tertiary activities (services) with an expansion of 1.0% y/y. Within the tertiary sector, growth was driven by public services, public administration, arts, entertainment, and real estate activities. However, the trade, transport, and accommodation sectors recorded a negative variation, marking the eleventh consecutive month of contraction. This was largely due to a decline in sales of clothing and motor vehicles and parts, suggesting that consumer demand for durable and semi-durable goods remains low.
Secondary activities, which include manufacturing and construction, had a slow start to the year, falling by -5% y/y in January. This was the eleventh consecutive month of negative figures, as was the case for trade. In the manufacturing sector, clothing, non-metallic mineral products, and iron and steel were the main contributors to the negative result in January, due to a decline in household demand for both clothing and construction in the case of iron and steel.
In seasonally adjusted terms, primary activities showed a significant expansion compared to the results of December 2023, being the sector with the highest growth in January, with 8.1% m/m. This was followed by tertiary activities, which recorded a modest growth of 0.2% m/m, driven by public administration, arts, and entertainment. On the other hand, secondary activities (manufacturing and construction) showed a decline of -0.5% m/m at the beginning of the year, as in the annual result.
Current results indicate that retail trade, industry, and construction continue to perform weaker than expected, reflecting the impact of high interest rates on the economy and the decline in household demand. In contrast, public services, public administration, arts and entertainment, and real estate are the sectors that have contributed most to boosting economic activity at the beginning of 2024. In this sense, our baseline scenario for 2024 assumes a gradual reduction in inflation and interest rates, a contractionary local monetary policy, and moderate levels of consumer and business confidence operating below their potential, which would lead to economic growth of 1.4% in 2024.
BanRep will decide on the monetary policy rate on Friday. Negative surprises in economic activity (retail trade, industry, and construction) and the continuation of the disinflation process support the expectation of an acceleration in the cutting cycle. The market consensus is for a 50bps cut, while Scotiabank Colpatria expects a 75bps cut in a split vote. However, we have raised our year-end rate expectation from 7% to 7.50% on the assumption that the central bank will continue the easing cycle next month with consecutive 75bps cuts.
Key Highlights:
- Primary activities (agriculture and mining) grew at an annual rate of 10.3% y/y (chart 4) and 8.1% m/m seasonally adjusted. In agriculture, the moderation in producer prices continues to contribute to food production, partly due to the appreciation of the exchange rate and its relationship with the level and statistical base. In the mining sector, oil and coal production has contributed to the improvement of the sector’s results.
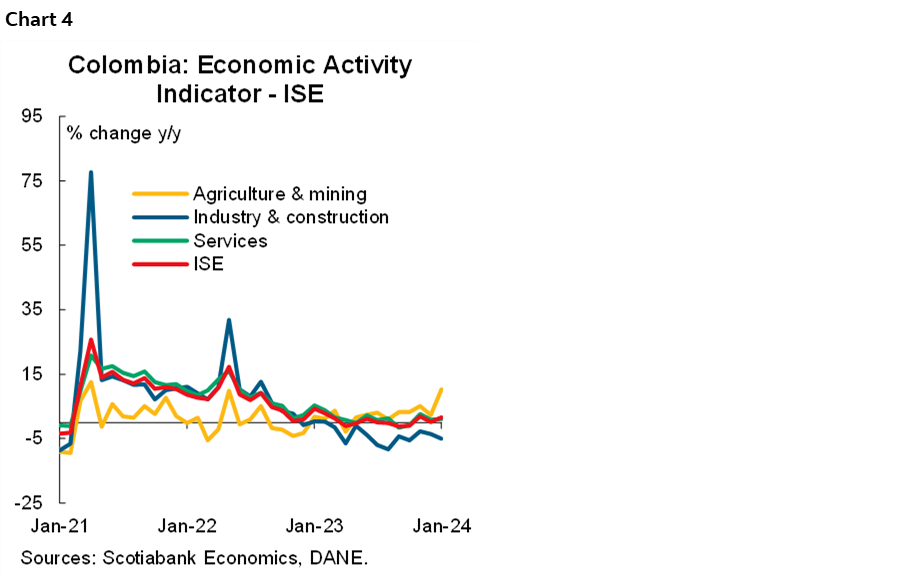
- Secondary activities (manufacturing and construction) ended eleven consecutive months in negative territory, registering a contraction of 5.0% y/y, mainly due to the fall in demand for clothing and the decline in the production of iron and steel as a result of lower demand in the construction sector. In seasonally adjusted terms, a monthly decrease of 0.5% was recorded in January, after -0.9% m/m in December.
- The tertiary sector, which includes activities related to trade, services, and public administration, recorded an annual growth of 1.0% in January. This result is attributed to the growth of public services (+4.4% y/y), partly due to the higher energy production by thermoelectric plants as a result of the El Niño phenomenon, public administration, arts, and entertainment (+3.4% y/y) and real estate activities (+1.7% y/y). However, commerce, transport and accommodation services, and information and communication services were the subsectors that recorded the largest falls in January, with decreases of 1.3% y/y and 1.6% y/y, respectively. In retail sales, sales of clothing and motor vehicles and parts declined, indicating that household consumption of durable and semi-durable goods remains low, partly due to high prevailing interest rates and inflation outside the target range.
- In seasonally adjusted terms, tertiary activities recorded a monthly variation of 0.2%, mainly driven by the subsectors of public administration, education, and entertainment (+7.8% m/m) and professional activities (1.2% m/m). These offset the decline in the financial and insurance services (-5.4% m/m) and trade, transport, and accommodation services (-1.2% m/m) subsectors.
—Jackeline Piraján & Santiago Moreno
IMPORTS BEGAN 2024 WITH A SLOW PACE, MARKING FIFTEEN CONSECUTIVE MONTHS OF DECLINES. HOWEVER, THERE WAS A SLIGHT INCREASE IN PURCHASES OF MANUFACTURED GOODS IN JANUARY
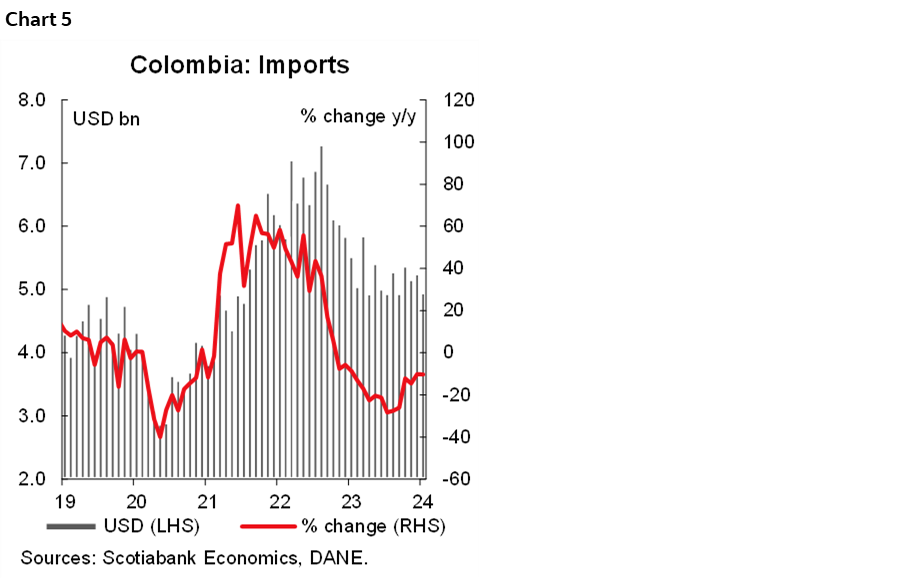
On Monday, March 18th, DANE published the import figures for January 2024, which reached USD 4.959 billion CIF (chart 5), a decrease of 10.3% y/y. This represents the fifteenth consecutive month of declines and the lowest January since 2021. This result is mainly due to a 48.3% decline and a -8.1 p.p. contribution in the group of fuels and products of the extractive industries. On the positive side, the manufacturing sector posted a modest growth of 0.5% y/y and a positive contribution of 0.3 p.p. to the total variation, mainly due to a surge in imports of capital goods for industry, such as office machinery and equipment. This represents a slight relief and boost for this group of products, which had shown a steady decline during 2023. Manufactured goods represent 75.7% of the total CIF value of imports, followed by agriculture, food, and beverages with 14.6%, fuels and products of the extractive industries with 9.6%, and other sectors with 0.1%.
In terms of the trade balance, Colombia recorded an external FOB deficit of USD 959.5 million in January 2024 (chart 6), slightly widening the difference with the December close (USD -546.0 million) due to a larger decline in exports than in imports in January. Having said that, the external deficit continued its correction in January compared to January 2023, when it reached USD 1,478.1 million FOB. Thus, domestic demand continues to adjust to the high levels recorded a year ago, due to the decline in investment and consumption of durable and semi-durable goods. This pattern of domestic demand has manifested itself in a significant reduction in imports, which, together with exports, continues to justify a reduction in the real external deficit.
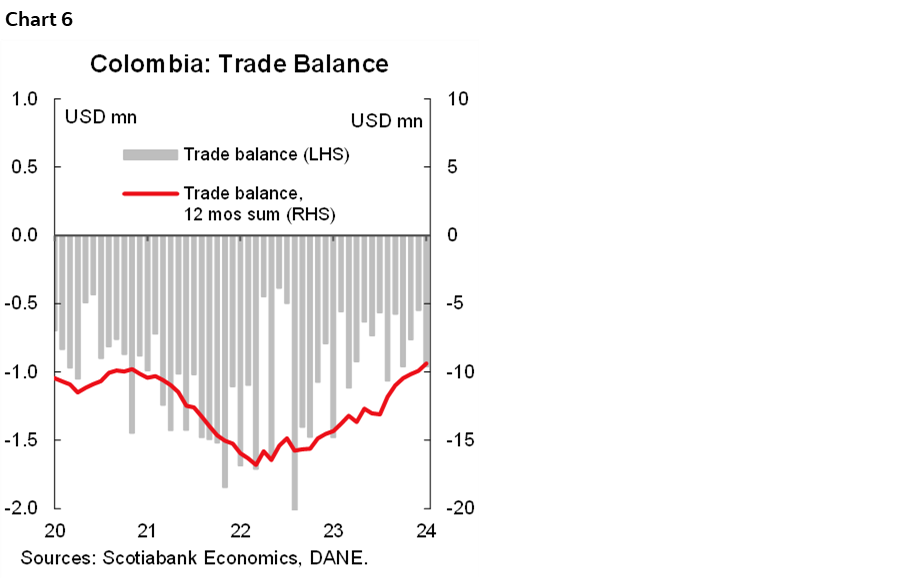
Recent figures on economic activity and imports indicate that investment remains low, marking a discouraging start to the year. Consumption has registered a negative balance, that anticipates a modest behaviour in household spending. This has led to a fall in domestic demand, which has reduced the trade deficit to figures not seen since January 2020. All of this is happening in an environment of consumer and business distrust, reduced credit dynamics, and a restrictive monetary policy. Therefore, economic growth is expected to continue to be modest during 2024, however, as inflation approaches its target, internal financing conditions will ease, helping the growth rate to improve.
Based on these factors, BanRep will decide on the monetary policy rate on Friday. The slow start to the year in terms of economic activity and the continuation of the disinflation process support the expectation of an acceleration in the easing cycle. The market consensus is for a cut of 50 basis points, while Scotiabank Colpatria expects a cut of 75 basis points, in a split vote, if the economic slowdown materializes. Nevertheless, we have raised our year-end rate expectation from 7% to 7.50% on the assumption that the central bank will continue the easing cycle next month with consecutive 75bps cuts.
Key Highlights:
- In terms of product categories, imports of manufactured goods reached USD 3.754 billion CIF in January 2024, an increase of 0.5% y/y and a contribution of 0.3 p.p. to total variation. This increase was mainly due to higher purchases of chemical products (7.4% y/y), which contributed 2.1 p.p. to the group’s variation.
- The second most important group of imports is agricultural products, food, and beverages, valued at USD 721.8 million CIF. These show a decrease of 16.4% compared to January 2023 and contributed -2.6 p.p. to the total variation. This is explained by lower imports of food and live animals (-14.2% y/y) and non-edible raw materials, excluding fuels (-28.4% y/y), which together contributed -14.0 p.p. to the group’s variation.
- In third place are imports of fuels and products of the extractive industries, which amounted to USD 478.3 million CIF, a decrease of 48.3% y/y and contributing -8.1 p.p. to the total variation. Within this group, the product that contributed most to the decline was petroleum, petroleum products, and related products (-61.3% y/y), which contributed -54.8 p.p. to the total variation of the group.
- When imports are classified by economic use or destination, two of the three main groups show negative trends (chart 7).
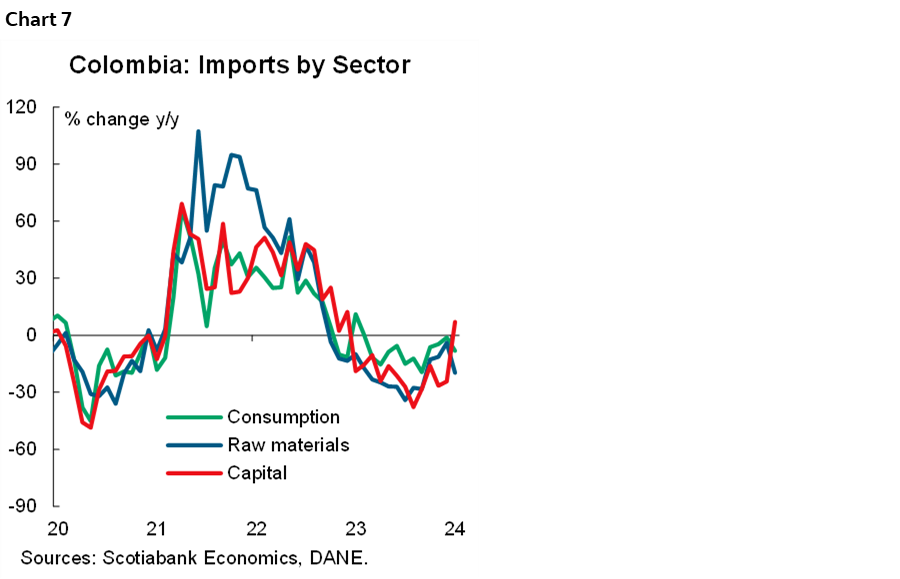
- Consumer goods imports: These reached USD 1.141 billion CIF in January 2024, down 8.1% y/y and contributing -1.8 p.p. to the total. Durable consumer goods fell by 15.5% y/y, contributing -1.5 p.p., due to the slowdown in personal goods and vehicles, which together contributed -2.1 p.p. to the group’s variation. However, this decline was partly offset by the positive contribution of household appliances, personal decorations, and furniture, which added 0.6 p.p.
- Non-durable consumer goods fell by 2.3% y/y in January, contributing -0.3 p.p. to the overall variation in imports. This decline was mainly due to a decrease in imports of food, beverages, clothing, and textiles, which together added -0.9 p.p. to the group’s variation. On the other hand, pharmaceutical products and other non-durable consumer goods added 0.6 p.p. to the group’s variation.
- Imports of raw materials and intermediate goods: In January 2024, these amounted to USD 2.326 billion CIF, a decrease of 19.7% y/y and a negative contribution of -10.3 p.p. to the total variation. This decline was driven by an 11% annual decline in imports of fuels, lubricants, and related materials, with a negative contribution of -8 p.p. and a decline of 52.6% y/y. Imports of raw materials for industry (excluding construction) came second, with a decrease of 6.7% y/y and a negative contribution of -2.2 p.p. At the same time, imports of raw materials for agriculture fell by 3.5% y/y in January, contributing -0.2 p.p.
- Capital goods imports: In January 2024, these totaled USD 1.490 billion, up 7.1% y/y, contributing 1.8 p.p. This increase was mainly due to the expansion of capital goods for industry (+13.6% y/y and 22.2 p.p.), while construction materials counteracted this trend with a decline of 8.7% y/y and a contribution of -0.2 p.p. (the largest contributor). Next, transportation equipment fell by 2.8% y/y in January and contributed -0.2 p.p. Finally, imports of capital goods for agriculture fell by 11.9% in January and contributed -0.0 p.p.
—Sergio Olarte & Santiago Moreno
DISCLAIMER
This report has been prepared by Scotiabank Economics as a resource for the clients of Scotiabank. Opinions, estimates and projections contained herein are our own as of the date hereof and are subject to change without notice. The information and opinions contained herein have been compiled or arrived at from sources believed reliable but no representation or warranty, express or implied, is made as to their accuracy or completeness. Neither Scotiabank nor any of its officers, directors, partners, employees or affiliates accepts any liability whatsoever for any direct or consequential loss arising from any use of this report or its contents.
These reports are provided to you for informational purposes only. This report is not, and is not constructed as, an offer to sell or solicitation of any offer to buy any financial instrument, nor shall this report be construed as an opinion as to whether you should enter into any swap or trading strategy involving a swap or any other transaction. The information contained in this report is not intended to be, and does not constitute, a recommendation of a swap or trading strategy involving a swap within the meaning of U.S. Commodity Futures Trading Commission Regulation 23.434 and Appendix A thereto. This material is not intended to be individually tailored to your needs or characteristics and should not be viewed as a “call to action” or suggestion that you enter into a swap or trading strategy involving a swap or any other transaction. Scotiabank may engage in transactions in a manner inconsistent with the views discussed this report and may have positions, or be in the process of acquiring or disposing of positions, referred to in this report.
Scotiabank, its affiliates and any of their respective officers, directors and employees may from time to time take positions in currencies, act as managers, co-managers or underwriters of a public offering or act as principals or agents, deal in, own or act as market makers or advisors, brokers or commercial and/or investment bankers in relation to securities or related derivatives. As a result of these actions, Scotiabank may receive remuneration. All Scotiabank products and services are subject to the terms of applicable agreements and local regulations. Officers, directors and employees of Scotiabank and its affiliates may serve as directors of corporations.
Any securities discussed in this report may not be suitable for all investors. Scotiabank recommends that investors independently evaluate any issuer and security discussed in this report, and consult with any advisors they deem necessary prior to making any investment.
This report and all information, opinions and conclusions contained in it are protected by copyright. This information may not be reproduced without the prior express written consent of Scotiabank.
™ Trademark of The Bank of Nova Scotia. Used under license, where applicable.
Scotiabank, together with “Global Banking and Markets”, is a marketing name for the global corporate and investment banking and capital markets businesses of The Bank of Nova Scotia and certain of its affiliates in the countries where they operate, including; Scotiabank Europe plc; Scotiabank (Ireland) Designated Activity Company; Scotiabank Inverlat S.A., Institución de Banca Múltiple, Grupo Financiero Scotiabank Inverlat, Scotia Inverlat Casa de Bolsa, S.A. de C.V., Grupo Financiero Scotiabank Inverlat, Scotia Inverlat Derivados S.A. de C.V. – all members of the Scotiabank group and authorized users of the Scotiabank mark. The Bank of Nova Scotia is incorporated in Canada with limited liability and is authorised and regulated by the Office of the Superintendent of Financial Institutions Canada. The Bank of Nova Scotia is authorized by the UK Prudential Regulation Authority and is subject to regulation by the UK Financial Conduct Authority and limited regulation by the UK Prudential Regulation Authority. Details about the extent of The Bank of Nova Scotia's regulation by the UK Prudential Regulation Authority are available from us on request. Scotiabank Europe plc is authorized by the UK Prudential Regulation Authority and regulated by the UK Financial Conduct Authority and the UK Prudential Regulation Authority.
Scotiabank Inverlat, S.A., Scotia Inverlat Casa de Bolsa, S.A. de C.V, Grupo Financiero Scotiabank Inverlat, and Scotia Inverlat Derivados, S.A. de C.V., are each authorized and regulated by the Mexican financial authorities.
Not all products and services are offered in all jurisdictions. Services described are available in jurisdictions where permitted by law.