- Colombia: The economy grew well below expectations in Q4-23 and throughout the year due to a decline in investment and lower private consumption, recording its weakest performance since the pandemic
COLOMBIA: THE ECONOMY GREW WELL BELOW EXPECTATIONS IN Q4-23 AND THROUGHOUT THE YEAR DUE TO A DECLINE IN INVESTMENT AND LOWER PRIVATE CONSUMPTION, RECORDING ITS WEAKEST PERFORMANCE SINCE THE PANDEMIC
Data released by DANE on Thursday, February 15th showed that Colombia’s real GDP grew a modest 0.3% y/y in Q4-2023, below BanRep’s forecast, the market consensus, and our projections (~1% y/y). The economic activities that contributed the most positively were agriculture, public administration and defense, education, health, and finance and insurance, which together contributed 1.3 p.p. to the total expansion. On the other hand, manufacturing, retail trade, construction, and, surprisingly, arts and entertainment were the activities that showed a negative contribution of -1.4 percentage points in the fourth quarter. On a seasonally adjusted basis (chart 1), a slight growth of 0.04% q/q was recorded, which is a deterioration from the 0.3% q/q recorded in the previous quarter. According to the Economic Activity Index (ISE), Colombia weakened significantly in December, to 0.1% q/q, as some service-related sectors, such as leisure, began to show weaker results, in addition to the manufacturing and trade sectors, which were affected throughout 2023.

On the demand side, private consumption continued to moderate in Q4-2023 (+0.1% y/y). Demand for durable and semi-durable goods was very weak, with a negative contribution of -0.9 p.p. to the group variation and annual growth rates in contractionary territory (-5.3% y/y and -7.2% y/y, respectively). In contrast, expenditure on services grew by +1.5% and 0.7 p.p. in the fourth quarter, followed by consumption of non-durable consumer goods with a slight growth of +0.6% and 0.2 p.p. For its part, the final consumption expenditure of the general government saw an expansion of 12.5% y/y in Q4. However, once again, the main drag on GDP in Q4-2023 came from a significant drop in gross fixed capital formation (-27.2% y/y), which is largely explained by a drop in fixed capital formation, which contracted by 14% y/y, both in machinery and equipment and in construction (residential and non-residential).
It must be added that all the data for both GDP and ISE have been revised downwards for the most part of the last year in this latest presentation. Thus, the consolidated GDP for the year 2023 shows a growth of 0.6% compared to 2022 (the lowest balance since the pandemic and lowest in the century if we take off pandemic), driven by the activities of public administration and defense, education, human health care activities (+3.9% and contribution of 0.6 p.p.), financial and insurance activities (+7.9% and contribution of 0.3 p.p.), along with arts and leisure activities (+7.0% and contribution of 0.2 p.p). These increases were offset by a decline throughout the year in trade (-2.8% and contribution of -0.6 p.p.), manufacturing (-3.5% and contribution of -0.4 p.p.), and construction (-4.2% and contribution of -0.2 p.p.).
For 2023, final consumption expenditure grows by 1.1% compared to 2022, driven by household final consumption expenditure (+1.1% compared to 2022) and government final consumption expenditure (+0.9% compared to 2022). These increases offset the decline of -24.8% in gross fixed capital formation and -8.9% in gross fixed capital formation compared to 2022.
Yesterday’s data showed that domestic demand fell mainly due to the poor performance of investment, while consumption decelerated every quarter despite the recovery in public consumption. This led to a further decline in domestic demand, lower imports, and a narrowing of the trade deficit. All of this occurred in the context of low consumer and business confidence, lower credit dynamics and a contractionary monetary policy. As a result, economic growth is expected to keep expansions below 2% in 2024, although higher than last year, due to a gradual decline in interest rates, a still contractionary local monetary policy and still low consumer and business confidence indices. As inflation converges to the target, internal financing conditions ease, favouring the recovery of growth in 2025. In 2024, total consumption is expected to be stable, with the public component growing faster than the private one. The investment will maintain its low dynamism in the first half of the year, but a gradual recovery is expected in the second half, driven by the reactivation of civil works and local investment projects. However, investment in civil engineering will remain low. In 2024, the contribution of net external demand to GDP will be much lower, due to the low growth of exports and the absence of new declines in imports.
Although the results are below market expectations, the path would be compatible with the convergence of inflation towards the target. Therefore, in 2024 we expect that the effects of a high statistical base will continue to contribute to a significant correction of inflation in the first quarter of the year. As a result, annual inflation is expected to be below 8% in February, allowing BanRep to accelerate the easing cycle to a 75bps cut on March 29th.
Key Highlights
From the supply side:
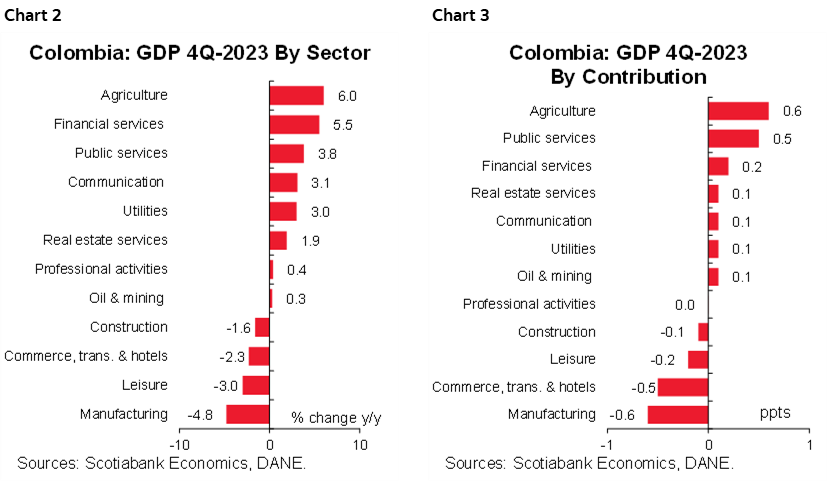
- The sectors that contributed most positively in the fourth quarter were: i) agriculture, animal husbandry, and fishing (+6.0% y/y and a contribution of 0.6 p.p. to the annual variation); ii) public administration and defense, education and health (+3.8% y/y and a contribution of 0.5 p.p. to the annual variation); iii) finance and insurance (+5.5% y/y and a contribution of 0.2 p.p. to the annual variation).
- The sectors that contracted most in the fourth quarter were manufacturing (-4.8% y/y and a contribution of -0.6 p.p.), trade, transport and hotels (-2.3% y/y and a contribution of -0.5 p.p.), construction (-1.6% y/y and a contribution of -0.1 p.p.) and, unexpectedly, arts and recreation (-3% y/y and a contribution of -0.2 p.p.). Thus, these sectors accounted for -1.4 p.p. of the total variation in the fourth quarter (chart 2 and chart 3).
- In seasonally adjusted terms, the activities with the highest quarterly growth were: (i) financial intermediation (+4.7% q/q), agriculture (+2.7% q/q), and information and communication (+1.8% q/q). On the other hand, mining and quarrying and public administration were the activities that contracted the most in the last quarter (-3.5% q/q and -0.6% q/q, respectively).
From the expenditure side:
- Domestic demand contracted by 4.1% year-on-year in the fourth quarter of 2023 (chart 4), for the third consecutive quarter, reaching contraction rates not seen since 2020. Nonetheless, on a seasonally adjusted basis, domestic demand rebounded slightly in the final quarter of 2023, in contrast to the contractions of the previous four consecutive quarters.

- Final consumption expenditure continued to contribute positively to growth, albeit at a slower pace (0.1% y/y and a contribution of 0.1 p.p.). Specifically, household consumption grew by 0.1% y/y, driven by services (+1.5% y/y and 0.7 p.p.) and defensive goods (+0.2% y/y and 0.2 p.p.). In contrast, durable and semi-durable consumer goods fell by 5.3% y/y and -4.7% y/y respectively, with a joint contribution of -0.9 p.p. On the other hand, the government’s final consumption expenditure grew by 12.5% y/y (driven by its three components: collective consumption expenditure, individual market, and non-individual market).
- In seasonally adjusted quarterly terms, final consumption expenditure declined by 0.2% q/q, due to a decline in government consumption expenditure, which fell by 3.8% q/q. On the other hand, household final consumption expenditure grew by 0.6% q/q, driven by a recovery in expenditure on durable goods and services (+2.4% q/q and +1.1% q/q, respectively), which offset declines in both non-durable and semi-durable consumer goods (-0.7% q/q and -1.0% q/q, respectively).
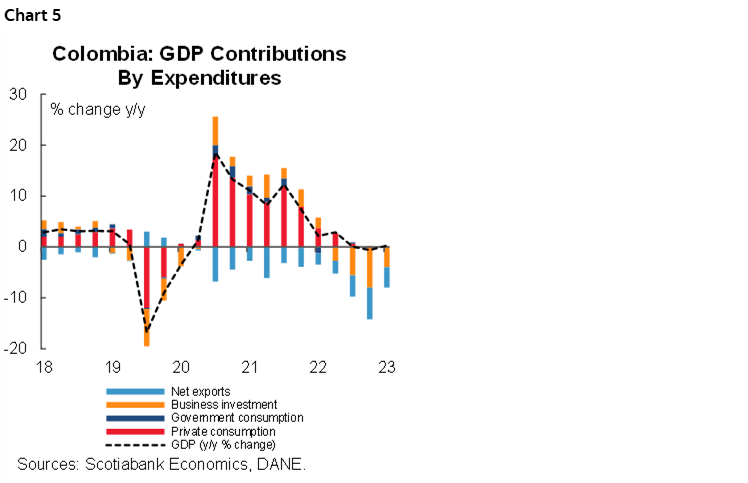
- Gross fixed capital formation contracted by 27.2% y/y and made a negative contribution of -4.3 p.p. to the total variation of GDP in the third quarter of 2023, approaching the peaks recorded during the pandemic (chart 5). This decline is mainly associated with a fall in gross fixed capital formation (investments), which contracted by 14% y/y, driven by the fall in machinery and equipment (-25.7% y/y and -12.6 p.p.), followed by housing (-9.8% y/y and -2 p.p.).
- In seasonally adjusted terms, there was a rebound of 5.7% q/q, the best result of the year, after three consecutive quarters in negative territory. On the other hand, gross fixed capital formation contracted by 4.1% q/q, a deterioration compared to the previous quarter (-2.4% q/q in Q4-2010). Within this component, the most significant declines were in machinery equipment and housing (-10.3 q/q and -7.5 q/q, respectively).
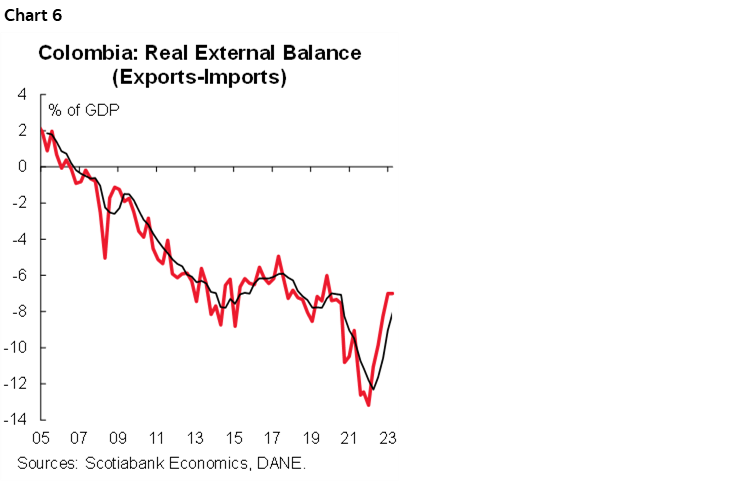
- The constant external deficit amounted to 7.0% of GDP in Q4-2023 (chart 6). Exports grew by 6.6% y/y and contributed 1.4 p.p., while imports contracted by 12.8% y/y and contributed 3 p.p., reflecting the contraction in domestic demand and a significant reduction in imports, justifying a narrowing of the real external deficit.
Economic Activity Indicator (ISE):
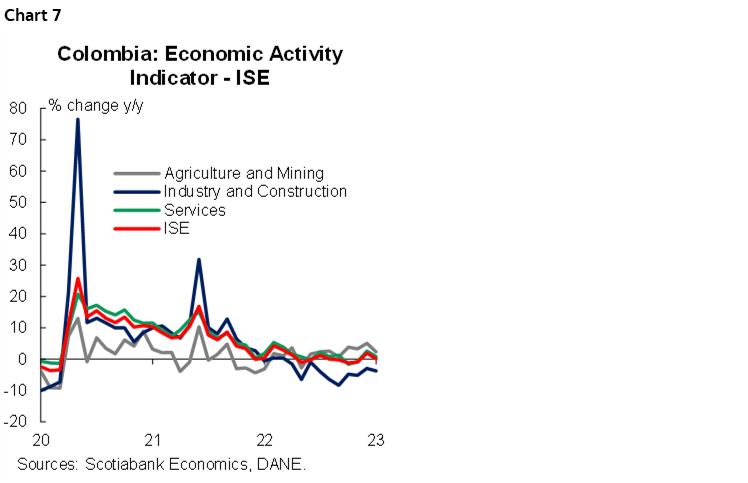
- In December 2023, the ISE slowed significantly to 0.1% y/y (chart 7), due to a decline in manufacturing (-4.8% y/y and -0.6 p.p.), arts and recreation (-2.7% y/y and -0.2 p.p.), trade, transport and accommodation (-0.5% y/y and -0.2 p.p.). On the other hand, the sectors that most compensated for the decline with more significant growths and contributions were agricultural activities (+5.4% y/y and 0.4 p.p.), financial activities (+8.8% y/y and 0.4 p.p.), along with public administration and defense, education, human health activities (+1% y/y and 0.1 p.p.).
- For the period January–December 2023, the ISE recorded a growth of 0.64% compared to the same period of the previous year, while for the year 2022, from January to December, it recorded a growth of 6.40%.
- In seasonally adjusted terms, the ISE recorded a contraction of 0.2% m/m in December, due to a decrease in the three groups of economic activities: primary activities -1.3% m/m, secondary activities -0.7% m/m and tertiary activities -0.3% m/m. From a sectoral point of view, finance and insurance activities recorded the largest increase (+5.3% m/m), while recreation and culture recorded the largest decrease (-9.8% m/m).
—Sergio Olarte & Santiago Moreno
DISCLAIMER
This report has been prepared by Scotiabank Economics as a resource for the clients of Scotiabank. Opinions, estimates and projections contained herein are our own as of the date hereof and are subject to change without notice. The information and opinions contained herein have been compiled or arrived at from sources believed reliable but no representation or warranty, express or implied, is made as to their accuracy or completeness. Neither Scotiabank nor any of its officers, directors, partners, employees or affiliates accepts any liability whatsoever for any direct or consequential loss arising from any use of this report or its contents.
These reports are provided to you for informational purposes only. This report is not, and is not constructed as, an offer to sell or solicitation of any offer to buy any financial instrument, nor shall this report be construed as an opinion as to whether you should enter into any swap or trading strategy involving a swap or any other transaction. The information contained in this report is not intended to be, and does not constitute, a recommendation of a swap or trading strategy involving a swap within the meaning of U.S. Commodity Futures Trading Commission Regulation 23.434 and Appendix A thereto. This material is not intended to be individually tailored to your needs or characteristics and should not be viewed as a “call to action” or suggestion that you enter into a swap or trading strategy involving a swap or any other transaction. Scotiabank may engage in transactions in a manner inconsistent with the views discussed this report and may have positions, or be in the process of acquiring or disposing of positions, referred to in this report.
Scotiabank, its affiliates and any of their respective officers, directors and employees may from time to time take positions in currencies, act as managers, co-managers or underwriters of a public offering or act as principals or agents, deal in, own or act as market makers or advisors, brokers or commercial and/or investment bankers in relation to securities or related derivatives. As a result of these actions, Scotiabank may receive remuneration. All Scotiabank products and services are subject to the terms of applicable agreements and local regulations. Officers, directors and employees of Scotiabank and its affiliates may serve as directors of corporations.
Any securities discussed in this report may not be suitable for all investors. Scotiabank recommends that investors independently evaluate any issuer and security discussed in this report, and consult with any advisors they deem necessary prior to making any investment.
This report and all information, opinions and conclusions contained in it are protected by copyright. This information may not be reproduced without the prior express written consent of Scotiabank.
™ Trademark of The Bank of Nova Scotia. Used under license, where applicable.
Scotiabank, together with “Global Banking and Markets”, is a marketing name for the global corporate and investment banking and capital markets businesses of The Bank of Nova Scotia and certain of its affiliates in the countries where they operate, including; Scotiabank Europe plc; Scotiabank (Ireland) Designated Activity Company; Scotiabank Inverlat S.A., Institución de Banca Múltiple, Grupo Financiero Scotiabank Inverlat, Scotia Inverlat Casa de Bolsa, S.A. de C.V., Grupo Financiero Scotiabank Inverlat, Scotia Inverlat Derivados S.A. de C.V. – all members of the Scotiabank group and authorized users of the Scotiabank mark. The Bank of Nova Scotia is incorporated in Canada with limited liability and is authorised and regulated by the Office of the Superintendent of Financial Institutions Canada. The Bank of Nova Scotia is authorized by the UK Prudential Regulation Authority and is subject to regulation by the UK Financial Conduct Authority and limited regulation by the UK Prudential Regulation Authority. Details about the extent of The Bank of Nova Scotia's regulation by the UK Prudential Regulation Authority are available from us on request. Scotiabank Europe plc is authorized by the UK Prudential Regulation Authority and regulated by the UK Financial Conduct Authority and the UK Prudential Regulation Authority.
Scotiabank Inverlat, S.A., Scotia Inverlat Casa de Bolsa, S.A. de C.V, Grupo Financiero Scotiabank Inverlat, and Scotia Inverlat Derivados, S.A. de C.V., are each authorized and regulated by the Mexican financial authorities.
Not all products and services are offered in all jurisdictions. Services described are available in jurisdictions where permitted by law.