- Colombia: Manufacturing and retail sales close negative in 2023, with mixed results at the margin; Imports end 2023 on a contractionary trajectory, while the external deficit continues its adjustment path, reaching levels unseen since 2018
- Peru: Expected changes in cabinet take place
A weak global data three-of-a-kind is supporting rates curves across the G10 to further unwind rates losses on Tuesday’s US CPI release, losses which in SPX futures have fully closed but remain well in place in the FX space. Japanese and UK Q4 GDP, and Australian January labour market data all undershot expectations. Today’s US retail sales, Philly Fed, industrial production, and trade price indices are the G10 data highlights, and we also get speeches/appearances by ECB, BoE, and Fed policymakers.
USTs are bull flattening (in 2s10s erasing yesterday’s bull steepening) as are EGBs, while gilts bull steepen. The USD is weak against most major currencies though in limited ranges against the bulk of the G10 where the JPY’s 0.4% rise is the standout move; the MXN is trading into the low 17s thanks to a 0.2% appreciation. SPX futures are up 0.2% to have the index back above 5,000. Crude oil has swung around overnight to sit ldown 0.5% at writing while iron ore and copper add small gains.
We have a busy release calendar in Latam today, starting with the minutes to the BCCh’s late-January meeting at 6.30ET, followed by Colombian Q4/December GDP and Peruvian December GDP and January unemployment over the course of the morning. In the BCCh’s meeting summary, we’ll see just how willing the bank is to consider another full-point, or even bigger, rate cut. At the January decision, one of the council’s six members (Céspedes) voted for a 125bps cut. How close were others to supporting his view and/or what would make them consider this at the April decision?
Colombian GDP for Q4 looks on track to undershoot economists’ forecasts after yesterday’s December retail sales and industrial production figures disappointed, and the trade deficit also narrowed less than expected (see below). The Bloomberg median projects a 0.8% y/y expansion in output in Q4 and December (below our team’s forecast of 1.1% and 1.0%, respectively). Yesterday’s weaker data reinforces our view that BanRep will consider a 75bps rate cut at their March 22 decision.
Our team in Lima projects that the Peruvian economy held little changed in year-on-year terms in December, as mining, trade, and services gains are offset by weakness in fishing and construction. But, either side of 0% y/y will still be a weak performance and recall that in the January to November period Peruvian GDP has contracted year-on-year in eight out of eleven months. Businesses and households remain pessimistic about the economic outlook but it seems we’re at a turning point and growth should soon pick up. The median economist is more optimistic than us, predicting a 0.4% y/y rise.
—Juan Manuel Herrera
COLOMBIA: MANUFACTURING AND RETAIL SALES CLOSE NEGATIVE IN 2023, WITH MIXED RESULTS AT THE MARGIN
On Wednesday, February 14th, the National Statistics Institute (DANE) published the manufacturing and retail sales data for December 2023. Real manufacturing production recorded a contraction of 6.8% y/y in December 2023, below market expectations and above our forecasts (-7.2% y/y and -6.1% y/y, respectively). As for real retail sales, they contracted by 4.7% y/y in December, slightly less than our estimate (-5% y/y) and above the market’s expectations (-2.7% y/y). This marked the 10th consecutive month of annual contraction in manufacturing and the 11th consecutive month of decline in retail sales. On the manufacturing side, transport equipment and clothing were the main negative contributors to the December result. On the trade side, a contraction was recorded on the side of vehicles other than private cars and motorcycles, followed by a reduction in the marketing of fuel for vehicles.
At the margin, however, the results were mixed, as manufacturing expanded slightly by 0.5% m/m (vs. -0.1% m/m in the previous month), while retail trade contracted by 1.9% m/m in December (vs. +2.3% m/m in November).
In fact, the full year of 2023 showed a negative balance for both industry and trade. In the year to December 2023, the real output of the manufacturing industry presented a variation of -4.9%, largely due to a reduction in the manufacturing of motor vehicles and the manufacturing of chemical substances. For its part, retail sales decreased by 6.5% in 2023 compared to 2022, mainly due to lower demand for durable and semi-durable goods, given that the highest negative contributions to trade were vehicles and motorcycles, both cars and cargo, as well as personal or domestic use computers and telecommunications equipment, with a contribution of -4.1 p.p. together.
The latest manufacturing and retail trade results anticipate the release of Q4 GDP, which is estimated to have grown at an annual rate of 1.1%. Investment remained low and consumption showed a negative balance, reflecting a contraction in household spending. This, together with low consumer and business confidence, lower credit dynamics, and a contractionary monetary policy, has led to a reduction in domestic demand. The economy is expected to maintain weak momentum in the coming quarters, with annual growth rates below 2% in 2024, while domestic demand adjusts to more sustainable levels. Investment is the most uncertain part due to high costs, high interest rates, and lower domestic demand. This economic path is consistent with inflation converging to the target. In 2024, the effects of the high statistical base will continue to contribute to a pronounced correction of inflation in the first quarter of the year. Inflation is expected to be below 8% y/y in February, allowing BanRep to accelerate the easing cycle to a 75bps cut on March 29th.
Key Highlights:
Manufacturing Production:
- Manufacturing production declined 6.8% y/y in December 2023 (chart 1), below market expectations (-7.2% y/y) and above our forecasts (-6.1% y/y). This marks the end of 10 consecutive months of declines in 2023. On a seasonally adjusted basis, the manufacturing sector expanded slightly by 0.5% m/m after -0.1% m/m in November. Of the 39 industrial activities covered by the survey, a total of 32 recorded negative annual variations in their real output, subtracting 7.9 p.p. from the overall annual variation, and 7 subsectors with positive variations added a total of 1.2 p.p. to the overall variation.
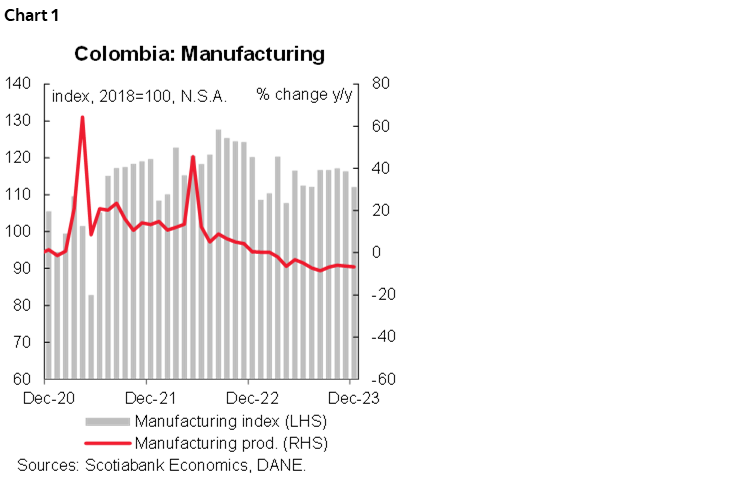
- The largest annual falls were in the transport equipment (-72.5% y/y and a contribution of -1.0 p.p.), clothing (-15.0% y/y and a contribution of -0.7 p.p.), and other food (-14.1% y/y and a contribution of -0.6 p.p.) groups. These activities accounted for -2.3 p.p. of the total annual variation in manufacturing production.
- On the other hand, other important activities recorded annual decreases, in particular those related to durable and semi-durable consumer goods, such as textiles (-20% y/y and -0.4 p.p. contribution), paper and paper products (-6% y/y and -0.2 p.p. contribution), furniture, mattresses and beds (-8.3% y/y and -0.1 p.p. contribution) and footwear (-12.1% y/y and -0.1 p.p. contribution).
- Conversely, the best-performing activities were coking, refining, and blending of petroleum products (+6% y/y and 0.4 p.p. contribution), soap, detergents and perfumes (+6.3% y/y and 0.3 p.p. contribution), other manufacturing (+20.9% y/y and 0.3 p.p. contribution), electrical machinery and equipment (+5.9% y/y and 0.1 p.p. contribution) and machinery and equipment (3.1% y/y and 0.04 p.p. contribution).
Retail Sales:
- Retail sales contracted 4.7% y/y in December 2023 (chart 2), slightly less than our estimate (-5% y/y) and more than the market expected (-2.7% y/y). Moreover, the last month of 2023 ended 11 months in contraction territory. On a seasonally adjusted basis, retail sales excluding trucks and public transport fell by -1.9% m/m compared to the previous month’s rebound (2.3% m/m in November). Of the 19 product lines, 14 recorded negative annual variations in their real sales, while 5 product lines recorded positive annual variations in their sales.
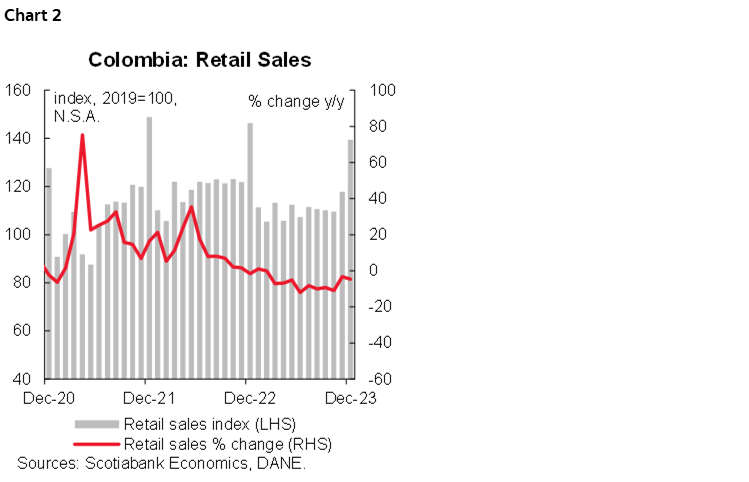
- On an annual basis, the evolution of retail sales in December 2023 was influenced by the decline in sales of vehicles other than motor cars and motorcycles (-23.7% y/y and -1.8 p.p.), fuels for motor vehicles (-3.8% y/y and -0.6 p.p.) together with spare parts and components (-8.7% y/y and -0.5 p.p.) and clothing and textile products (-4.4% y/y and -0.5 p.p.); in total, these three groups of products together contributed -3.4 p.p. to the total variation of retail trade.
- On the other hand, the highest positive contributions came from non-alcoholic beverages (+12.4% y/y and +0.1 p.p.), and from personal care products, cosmetics, and perfume (+3.1% y/y and 0.1 p.p.), which together contributed 0.2 p.p. to the total change.
Services and hotels:
- In December, 12 of the 18 services sub-sectors recorded positive year-on-year changes in total nominal income. The best-performing subsectors were real estate, renting and business activities (+15.8% y/y), computer services (+14.3% y/y), health services (+11.5% y/y), and restaurants and bars (+11.3% y/y). On the other hand, the sub-sectors with the largest decreases were motion picture and television program production (-37.4% y/y), call centers (-14.3% y/y), and supporting activities for storage and transport (-6.2% y/y).
- In the hotel sector, revenues fell by 7.8% in real terms in December. In addition, hotel occupancy reached 51.2% in December, the highest level in 2023 and 2 p.p. above the pre-pandemic average.
IMPORTS END 2023 ON A CONTRACTIONARY TRAJECTORY, WHILE THE EXTERNAL DEFICIT CONTINUES ITS ADJUSTMENT PATH, REACHING LEVELS UNSEEN SINCE 2018
On Wednesday, February 14th, DANE published the import data for December 2023, which amounted to USD 5.26 billion CIF (chart 3), with a decline of 10.2% y/y, ending fourteen consecutive months in contracting territory. This behaviour was mainly due to the fall of 15.5% y/y and the contribution of -11.5 p.p. from the manufacturing group, as a result of lower imports of vehicles, iron, and steel, which contributed -7.7 p.p. to the total y/y variation of imports. This dynamic continues to be explained by lower domestic demand, especially for durable and semi-durable consumer goods.
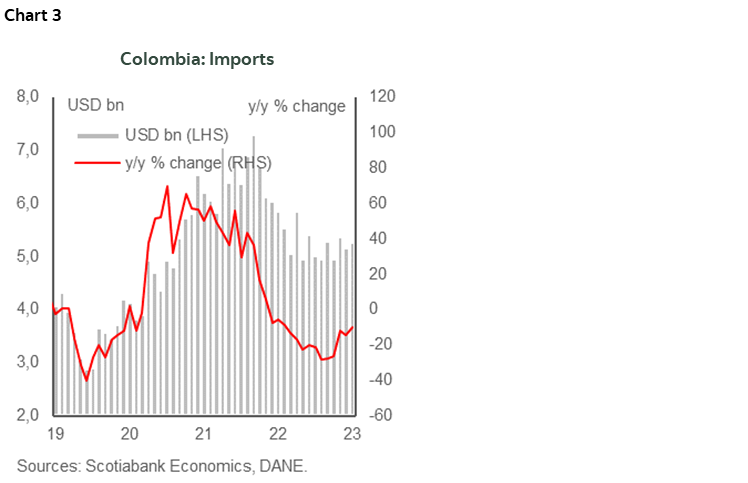
In December 2023, imports of manufactured goods represented 70.1% of the total CIF value of imports, followed by agriculture, food and beverages with 16.1%, fuels and products of extractive industries with 13.7%, and other sectors with 0.1%.
In the course of 2023 until December, imports amounted to USD 62.780 billion CIF, recording a decrease of 18.9% compared to the same period of 2022, with the manufacturing component being the largest contributor to the group’s variation, with -15 p.p. and a decrease of 20.3% between January–December 2023 compared to January–December 2022. This is the result of lower purchases of machinery and transport equipment (-19.7%) and manufactured goods, mainly classified by material (-29.1%), which together contributed -14.1 negative p.p. to the group’s variation.
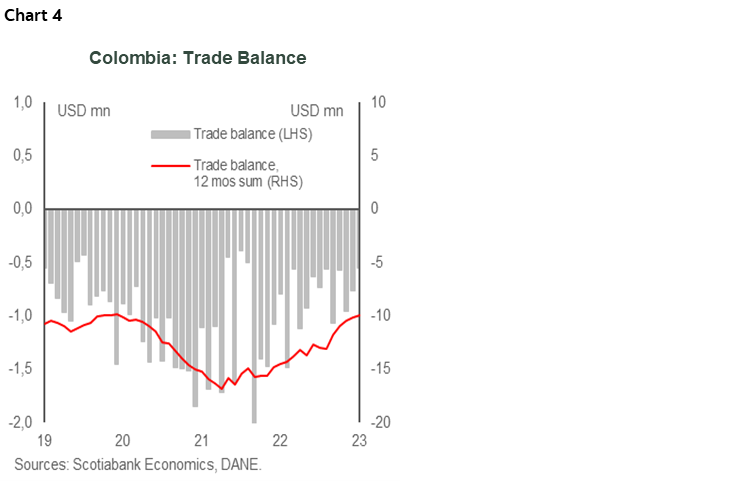
Regarding the trade balance, Colombia recorded an external FOB deficit of USD 546.0 million in December 2023 (chart 4), closing the gap with the previous month (USD 762.1 million in November) due to a decrease in imports compared to exports in December. On the other hand, the external deficit continued its correction path in December compared to that recorded in December 2022, when it reached USD 791.2 million FOB. Moreover, the trade balance in 2023 amounted to USD -9.902 billion, the lowest since 2018. Thus, domestic demand experienced a contraction compared to the high levels recorded a year ago, due to the decline in investment and consumption of durable and semi-durable goods. This pattern of domestic demand manifested itself in a significant reduction in imports, which, together with the dynamism of exports, continues to justify a reduction in the real external deficit.
Yesterday’s data on imports, manufacturing, and retail trade will serve as an indicator for today’s release of fourth-quarter GDP, which is estimated to have grown at an annual rate of 1.1%. Investment has remained low, while consumption has shown a negative balance, reflecting a contraction in household spending. This has led to a decline in domestic demand, which has reduced the foreign trade deficit to levels not seen in the last 5 years. All of this is occurring in the context of low consumer and business confidence, reduced credit dynamics, and a contractionary monetary policy. Thus, the economy is expected to maintain weak momentum in the coming quarters, with annual growth rates below 2% in 2024, as domestic demand adjusts to more sustainable levels, with the investment component being the most uncertain part of the economy due to high costs, high-interest rates, and lower domestic demand.
This path of economic activity is compatible with the convergence of inflation towards the target. Therefore, in 2024, we expect that the effects of a high statistical base will continue to contribute to a significant correction of inflation in the first quarter of the year. As a result, year-on-year inflation is expected to fall below 8% in February, allowing BanRep to accelerate the easing cycle to a 75bps cut on March 29th.
Highlights:
In terms of product groups, imports of manufactured goods reached USD 3.68 billion CIF in December 2023, 15.5% less than in December 2022 and contributing -11.5 p.p. to the total variation, due to lower purchases of machinery and transport equipment (-20.8%), which contributed -9.9 pp. .to the variation of the group.
The second group of imports with the highest participation corresponds to the imports of agricultural products, food, and beverages, valued at USD 847 million CIF, with a decrease of 1.8% compared to December 2022 and a contribution of -0.3 p.p. to the total variation, explained by lower imports of food and live animals (-2% y/y) and beverages and tobacco (-29.9% y/y), which contributed -3.3 p.p. to the group’s variation.
In third place are imports of fuels and products of the extractive industries, which amounted to USD 719.2 million CIF, an increase of 15.7% y/y and a positive contribution of 1.7 p.p. to the total variation. Within this group, the product that contributed most to the growth was the subgroup classified as other (other than petroleum, its derivatives, and nonferrous metals), which contributed 22.0 p.p. to the total variation of the group.
In terms of imports by economic use or destination, the three main groups remained in negative territory (chart 5):
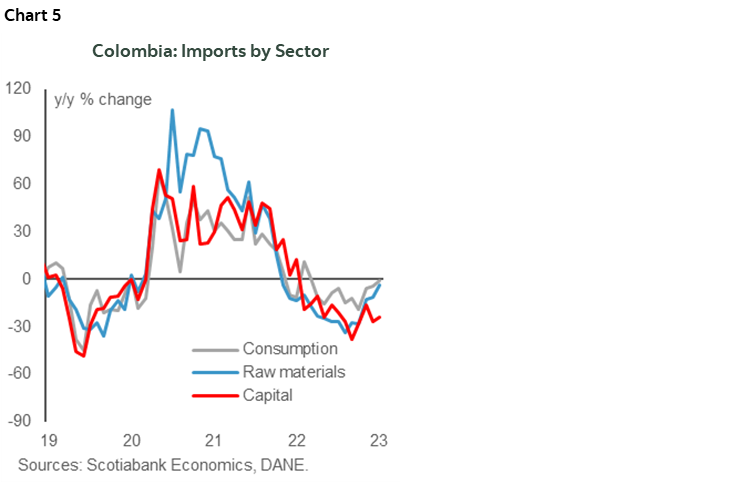
- Imports of consumer goods: these reached USD 1.22 billion CIF in December 2023, down 1.2% y/y, contributing -0.3 p.p. to the total. Durable consumer goods fell by 5.1% y/y, contributing -0.4 p.p., due to a slowdown in goods such as personal goods, vehicles, and household appliances, which together contributed -0.7 p.p. to the group’s variation. These declines were offset by the positive contribution of household appliances and furniture, which added 0.2 p.p..
- Non-durable consumer goods rose by 1.5% y/y in December and contributed 0.2 p.p. to the total variation in imports, mainly due to the contribution of pharmaceutical products, food, and tobacco, which added 1 p.p. to the group’s variation and offset the fall in clothing, beverages, and other non-durable consumer goods, which together contributed -0.7 p.p. to the group’s variation.
- Imports of raw materials and intermediate goods: these amounted to USD 2.55 billion CIF in December 2023, a decrease of 3.9% y/y and a negative contribution of -1.8 p.p. to the total variation. This was due to an 11% y/y decline in imports of raw materials and intermediate goods for industry (excluding construction), with a negative contribution of -3.5 p.p. In parallel, imports of raw materials for agriculture fell by 2.6% y/y in December, contributing -0.1 p.p.. In contrast, fuels, lubricants, and related materials rose by 20.9% y/y in December, contributing 1.9 p.p. to the total.
- Capital goods imports: These totaled USD 1.48 billion in December 2023, 24.3% lower than a year earlier and contributing -8.2 p.p. This decline continued to be driven mainly by the fall in transport equipment, which fell by 38.2% y/y in December and contributed -4.6 p.p. (the largest contributor). This was followed by imports of capital goods for industry, which fell by 12.9% y/y and contributed -2.3 p.p., while purchases of construction materials fell by 38% y/y and contributed -1.3 p.p. Finally, imports of capital goods for agriculture increased by 6.2% y/y and contributed 0.02 p.p. in December 2023.
—Santiago Moreno
PERU: EXPECTED CHANGES IN CABINET TAKE PLACE
While the highest summer temperatures are printed in Peru, the political scene is also beginning to heat up. On Tuesday, February 13th, President Dina Boluarte ordered four changes in the ministerial cabinet. The renewal of about 25% of the cabinet would demonstrate the Government’s intention to give new wind to the administration that maintains single-digit approval figures. However, the fact that Chief of Staff Alberto Otárola remains in office makes us think that there will be no major changes in general government policies.
One of the most anticipated changes was that of Economy Minister Alex Contreras, who had threatened to resign at the beginning of the year. Peru’s economy would post a recession of about -0.5% in 2023 due to political shocks: social protests, climate shocks and El Niño, despite the efforts of the Ministry of Economy to counteract the lower dynamism with greater public spending.
The new Minister of Finance, José Arista, has experience in public sector administration. He briefly held the position during the short-lived government of Manuel Merino in 2020 and previously as Vice Minister of Finance between 2006 and 2010. Arista has a conservative profile, and we hope that it maintains the fiscal discipline that has traditionally characterized the heads of this sector, although the strict fiscal deficit goal for this year (2.0% of GDP) will be an interesting challenge for the new minister.
Likewise, Rómulo Mucho was appointed as the new Minister of Energy and Mines, replacing the questioned Oscar Vera, who had advocated financial aid to the state oil company Petroperú. Mucho is a mining engineer and he served as Vice Minister of Mines between 2005 and 2006 so he has extensive experience in the mining sector. We hope that, unlike his predecessor, his management will be focused on the mining sector, particularly on unblocking the extensive portfolio of mining projects that Peru has and that show slow progress due, among others, to obtaining permits and the complicated administrative procedures to get projects started.
Finally, Walter Astudillo was appointed as the new Minister of Defense instead of Jorge Chávez and Juan Carlos Castro as the new Minister of the Environment instead of Albina Ruiz.
—Pablo Nano
DISCLAIMER
This report has been prepared by Scotiabank Economics as a resource for the clients of Scotiabank. Opinions, estimates and projections contained herein are our own as of the date hereof and are subject to change without notice. The information and opinions contained herein have been compiled or arrived at from sources believed reliable but no representation or warranty, express or implied, is made as to their accuracy or completeness. Neither Scotiabank nor any of its officers, directors, partners, employees or affiliates accepts any liability whatsoever for any direct or consequential loss arising from any use of this report or its contents.
These reports are provided to you for informational purposes only. This report is not, and is not constructed as, an offer to sell or solicitation of any offer to buy any financial instrument, nor shall this report be construed as an opinion as to whether you should enter into any swap or trading strategy involving a swap or any other transaction. The information contained in this report is not intended to be, and does not constitute, a recommendation of a swap or trading strategy involving a swap within the meaning of U.S. Commodity Futures Trading Commission Regulation 23.434 and Appendix A thereto. This material is not intended to be individually tailored to your needs or characteristics and should not be viewed as a “call to action” or suggestion that you enter into a swap or trading strategy involving a swap or any other transaction. Scotiabank may engage in transactions in a manner inconsistent with the views discussed this report and may have positions, or be in the process of acquiring or disposing of positions, referred to in this report.
Scotiabank, its affiliates and any of their respective officers, directors and employees may from time to time take positions in currencies, act as managers, co-managers or underwriters of a public offering or act as principals or agents, deal in, own or act as market makers or advisors, brokers or commercial and/or investment bankers in relation to securities or related derivatives. As a result of these actions, Scotiabank may receive remuneration. All Scotiabank products and services are subject to the terms of applicable agreements and local regulations. Officers, directors and employees of Scotiabank and its affiliates may serve as directors of corporations.
Any securities discussed in this report may not be suitable for all investors. Scotiabank recommends that investors independently evaluate any issuer and security discussed in this report, and consult with any advisors they deem necessary prior to making any investment.
This report and all information, opinions and conclusions contained in it are protected by copyright. This information may not be reproduced without the prior express written consent of Scotiabank.
™ Trademark of The Bank of Nova Scotia. Used under license, where applicable.
Scotiabank, together with “Global Banking and Markets”, is a marketing name for the global corporate and investment banking and capital markets businesses of The Bank of Nova Scotia and certain of its affiliates in the countries where they operate, including; Scotiabank Europe plc; Scotiabank (Ireland) Designated Activity Company; Scotiabank Inverlat S.A., Institución de Banca Múltiple, Grupo Financiero Scotiabank Inverlat, Scotia Inverlat Casa de Bolsa, S.A. de C.V., Grupo Financiero Scotiabank Inverlat, Scotia Inverlat Derivados S.A. de C.V. – all members of the Scotiabank group and authorized users of the Scotiabank mark. The Bank of Nova Scotia is incorporated in Canada with limited liability and is authorised and regulated by the Office of the Superintendent of Financial Institutions Canada. The Bank of Nova Scotia is authorized by the UK Prudential Regulation Authority and is subject to regulation by the UK Financial Conduct Authority and limited regulation by the UK Prudential Regulation Authority. Details about the extent of The Bank of Nova Scotia's regulation by the UK Prudential Regulation Authority are available from us on request. Scotiabank Europe plc is authorized by the UK Prudential Regulation Authority and regulated by the UK Financial Conduct Authority and the UK Prudential Regulation Authority.
Scotiabank Inverlat, S.A., Scotia Inverlat Casa de Bolsa, S.A. de C.V, Grupo Financiero Scotiabank Inverlat, and Scotia Inverlat Derivados, S.A. de C.V., are each authorized and regulated by the Mexican financial authorities.
Not all products and services are offered in all jurisdictions. Services described are available in jurisdictions where permitted by law.