- Chile: Progress in pension reform
- Colombia: Q2 economic growth shows a mixed picture across sectors
- Peru: Barely positive 0.2% June GDP growth disappoints
CHILE: PROGRESS IN PENSION REFORM
The Government reaches an agreement in the Senate to move forward with the Pension Reform project. An agreement wass signed between the government and the opposition to close the pension reform in January 2025. There is broad agreement on many of the points discussed in recent months, both in the Chamber of Deputies, the Government bill, and the recent proposals of the Technical Commission. This agreement will be perfected over the coming months in two dimensions: (1) Separation of the industry between administration and collection; (2) Distribution of the additional mandatory contribution (6%).
Among the issues on which there is broad agreement we can mention: an increase of the mandatory pension contribution by 6 ppts, charged to the employer; increasing the taxable ceiling used for unemployment insurance; and the transition from the multi-funds scheme to target date funds (TDF); among others.
—Waldo Riveras
COLOMBIA: Q2 ECONOMIC GROWTH SHOWS A MIXED PICTURE ACROSS SECTORS
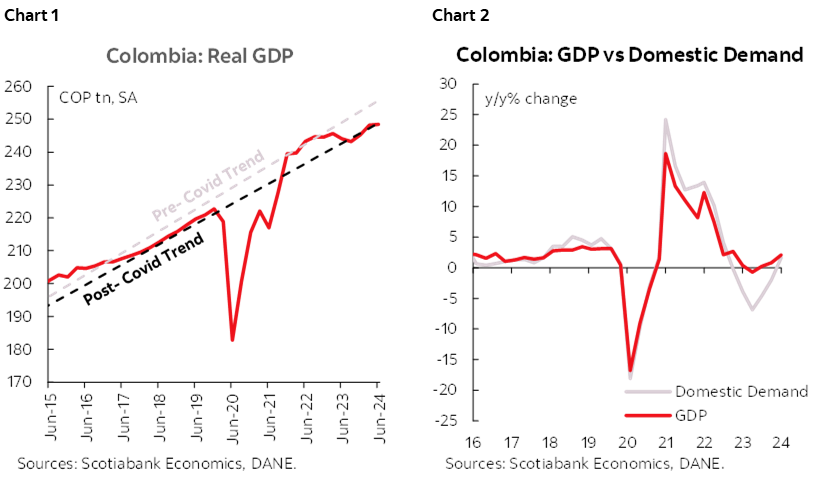
Data released by DANE on Thursday, August 15th, showed that Colombia’s real GDP grew 2.1% y/y in Q2 2024 (charts 1 and 2), beating BanRep’s forecast of 1.8% y/y, but below the 2.8% expected by the Bloomberg median. In seasonally adjusted terms, economic growth was weak, with a variation of 0.1% compared to the first quarter, being the lowest growth since the third quarter of 2023 (-0.3% q/q).
The economic activity results show a mixed picture, in which agricultural activities and public administration buoy growth, while manufacturing and mining offset the recovery. In the second quarter, agricultural activities expanded by 10.2% y/y, the highest increase since 2017, and contributed 1.0 ppt to overall growth, reflecting good output in crops, where coffee production stands out (+25.8% y/y). Public administration was the sector that contributed the second most to the rise, with a growth of 4.8% y/y and a contribution of 0.8 ppts. However, according to the Economic Activity Indicator (ISE), in June public administration activity showed a negative performance (-8.5% y/y), which implies a moderation for the rest of the year.
The manufacturing industry remained in negative territory for the fifth consecutive quarter, although showing a smaller deterioration compared to previous quarters. Manufacturing fell -1.6% y/y, subtracting 0.2 ppts from overall growth, showing weaker activity in the automotive sector, the textile sector, food processing, and oil refining. Mining and quarrying, with a variation of -3.3% y/y and a negative contribution of 0.1 ppts, contributed also negatively to the second-quarter results, with coal mining being the most affected.
Domestic demand grew by 1.6% y/y, being the first positive variation in the last 5 quarters, driven by higher consumption. Final consumption grew by 1.6% y/y, contributing 1.4 ppts., showing a recovery in final household consumption, which grew by 1.5% y/y, led by higher spending on durable goods and services. Exports were the second component contributing to the overall GDP growth, with a growth of 4.8% and a contribution of 0.9 ppts, which supports a better external balance. Investment also showed a recovery, with a 1.7% y/y growth in gross capital formation and a 4.3% y/y increase in gross fixed capital formation, although investment continues well below pre-pandemic levels.
The results reinforce the idea that economic activity is experiencing seasonal shocks and that the growth of the first part of the year may not be sustainable. Agricultural activity has played an important role in the economic recovery; however, this could be due to a change in the harvest cycles given the adverse weather phenomena that have occurred in the last year. In addition, consumption remains uneven in the different sectors, with good dynamics in the services sector, but putting pressure on manufacturing production. If we look only at the GDP results, these might not imply greater pressure on the Banco de la República to accelerate the pace of cuts, since they turned out better than they were expecting. However, when observing the monthly behavior of economic activity, a deterioration of -1.1% y/y in June is observed, the view would change. This slowdown added to an inflation that surprised below expectations in July, keeping our expectation of a 75bps cut in September alive. However, it will be necessary to monitor the economic activity results for July and the inflation data for August.
Highlights
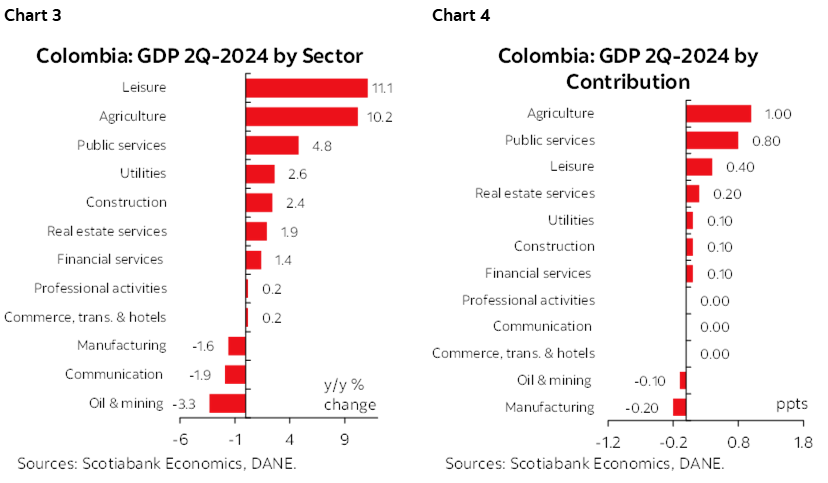
- On the supply side, agriculture contributed around 50% of economic growth with a variation of 10.2% y/y and a contribution of +1.0 ppts. Public administration and defense was the second activity to contribute to growth with an increase of 4.8% y/y and a contribution of 0.8 ppts. In third place are entertainment activities and household activities, with a variation of 11.1% and a contribution of 0.4 ppts, where the growth of gambling and the hiring of domestic service stand out. Among other activities, construction grew by 2.4% y/y, a growth that is mainly attributed to a good dynamic in civil infrastructure works.
- The overall commercial activity showed a slight recovery while financial and insurance activities rebounded with 1.6% y/y. Commercial activity grew by 0.2% y/y, showing a recovery in wholesale and retail trade, which may be associated with different events in the quarter, such as Mother’s Day and sporting events that would have boosted trade. Financial and insurance activities returned to positive territory after registering a fall in the first quarter.
- On the negative side, manufacturing industries, mining and quarrying, and communications activities were the ones that offset growth. Manufacturing industries fell by -1.6% y/y, subtracting -0.2 ppts, mining fell by -3.3% y/y, subtracting -0.1 ppts, while communications activity fell by -1.9% y/y (charts 3 and 4).
- In seasonally adjusted terms, economic growth was weak, with a variation of 0.1% q/q. Artistic activities grew the most (+3.5% q/q), followed by public administration (+1.7% y/y) and agricultural activities (+1.5% q/q). Meanwhile, manufacturing, mining and the provision of utilities fell -0.9%, respectively.
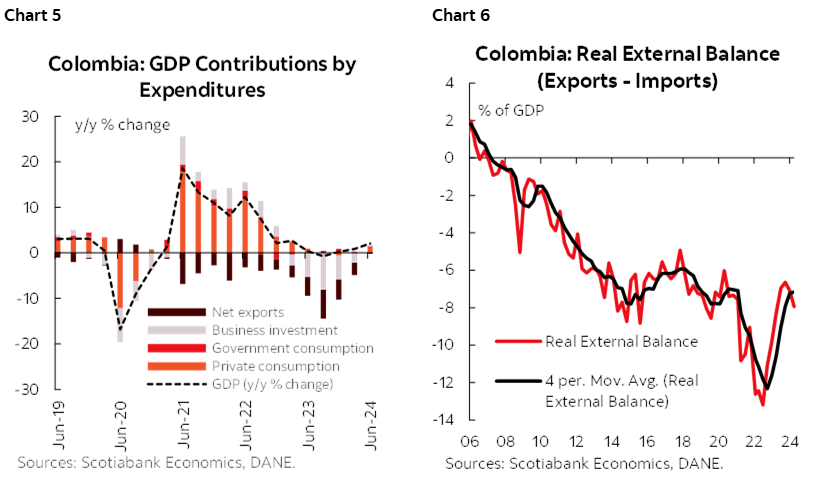
- Consumption and increased exports drove the growth of domestic demand. Domestic demand increased by 1.6% y/y and 1.5% q/q. Consumption contributed the most, with a variation of 1.6% and a contribution of 1.4 ppts. Government spending remained in positive territory for the fourth consecutive quarter, registering an increase of 2.0% y/y. Household consumption grew 1.5% y/y, reflecting higher spending on durable goods (+2.3% y/y), non-durable goods (+2.6% y/y) and services (+1.4% y/y), while spending on semi-durable goods fell -2.6% y/y, associated with lower demand for textile products. Exports increased 4.8% y/y, contributing 0.9 ppts, while imports had a variation of +2.2% y/y, offsetting with -0.5 ppts (charts 5 and 6).
Economic Activity Indicator (ISE):
In June, the ISE slowed down significantly, registering a fall of -1.1% compared to June 2023, with 6 of the 12 activities registering negative variations (chart 7). The fall was mainly due to a decline in public administration of -8.5% y/y with a contribution of -1.7 ppts, followed by manufacturing industries which fell -4.3% y/y and subtracted -0.5 ppts. On the positive side, artistic and entertainment activities stand out, which expanded by 20% y/y and contributed 1.1 ppts, followed by agriculture with a variation of 3.3% y/y and a contribution of 0.3 ppts.
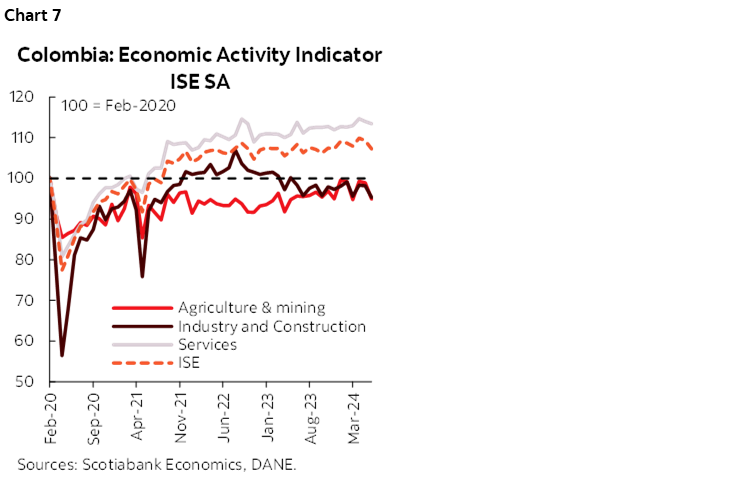
On a seasonally adjusted basis, the ISE fell -1.9% compared to May 2024, showing declines in 8 of the 12 activities. In June, the primary sector was the one that fell the most compared to the previous month (-4.0% m/m), which could mean that the positive dynamics of agricultural activities were moderating. The secondary sector (-2.9% m/m) continued to show declines in manufacturing and construction, while service activities (-0.5% m/m) were affected by a negative dynamic in public administration, communications, and professional activities.
—Sergio Olarte & Daniela Silva
PERU: BARELY POSITIVE 0.2% JUNE GDP GROWTH DISAPPOINTS
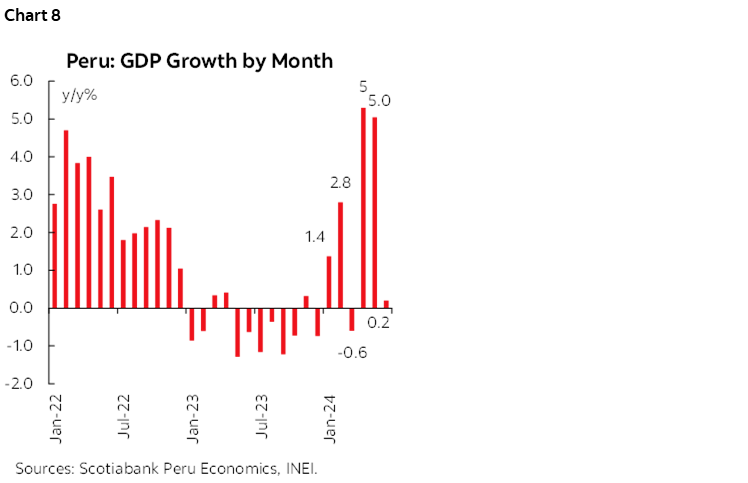
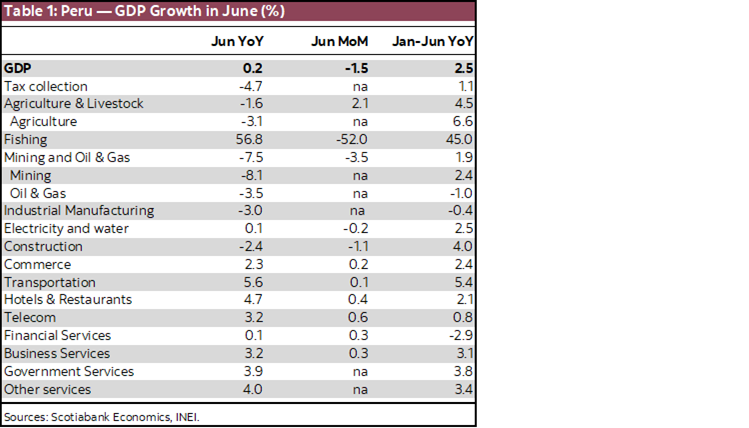
GDP growth for June was reported as 0.2% y/y, below consensus of 1.8%, and below our expectations of 1.0% (chart 8, table 1). Moreover, it came nowhere near the growth rates of previous months, 5.3% in May and 5.0% in June.
Now we have a better idea of why the BCRP lowered the reference rate last week. The BCRP surely had a good idea of just how low growth would have been in June. The figure also bolsters the possibility of another rate cut in July, although we may be getting ahead of ourselves here, or at least getting ahead of the FED, upon which the BCRP decision will largely depend.
The official figure for GDP growth in Q2 has not been released, but the January–June aggregate GDP growth figure of 2.5%, y/y, suggests that growth in Q2 would have been if it was 3.5%, y/y, which would be a convincing improvement from 1.4% in Q1. The trend puts us comfortably in line with our full-year forecast of 3.0% GDP growth.
So, what happened in June? Basically three things. The first is that the rebound from last year’s El Niño is wearing off. Fishing GDP rose 57% y/y in June, which seems high, except when you compare it to May, when it was up a huge 330%, and April’s 158% increase. To put it another way, fishing only added 0.1 percentage points to aggregate growth in June, compared to half of the 5.3% growth in May. This, however, was expected, as June was the tail-end month of the anchovy (fishmeal) fishing season.
Agriculture’s 3.1% y/y decline in June, was not expected. Agriculture growth has been volatile so far in 2024, as it rebounds from the impact of severe El Niño weather in 2023, which threw seasonal timing for agricultural crops out of whack. Note that agricultural GDP growth spiked at 36% y/y in April, and this is not offset by June’s number. It would be best to take the year-to-date average, which shows 6.6% growth as a better indicator of performance. The bottom line is that the figure for June is not representative of what is actually occurring in the sector this year.
The second reason for such low aggregate GDP growth in June is mining. The context of high metal prices should have been great for mining, so, how does one explain mining GDP falling 8.1% in June? Mining growth has actually been low over the past three months, in fact. The explanation appears to have to do with lower metal grades in the ore being mined. One of the contradictory issues of rising metal prices, is that it makes previously unprofitable lower-grade ore, become profitable. It lowers the cut-off grade. Now that copper prices have come down from their loftier highs of early in the year, one should expect production to begin rising again in Q3.
The third reason is perhaps the most significant. Certain sectors linked to domestic demand remain very weak. Construction GDP fell 2.4% y/y in June. If it had performed better earlier in the year (it was up 4.0% in the year-to-June) that was because of public sector investment. What is weak is private sector construction, and more specifically, residential construction.
Aside from construction, two figures also denote a lack in domestic demand spending. The first is industrial manufacturing of goods, down 3.0%, y/y, in June, and 0.4% in the year. That this decline is linked to weak domestic demand seems to be ratified by the -4.7% y/y decline in tax collection in June (up only 1.1% for the year).
At the same time, however, growth linked to service sectors (transportation, restaurants, telecom, business services) is much firmer and broader. An intriguing possibility is that consumer spending is shifting out of goods (as represented by industrial manufacturing) and into services. Then there is also anecdotal evidence suggesting another substitution effect, this one between locally produced goods and imports.
GDP growth in future months should consistently surpass the figure for June. For one, inflation has come down and real salaries are starting to improve, which should help impact consumption, albeit with a lag. Short-term, the impact on consumption of pension fund withdrawals, which was still incipient in June, should be much stronger in the period running from July to the end of the year. We expect a good portion of this to boost domestic demand in 2024, and even early 2025.
—Guillermo Arbe
DISCLAIMER
This report has been prepared by Scotiabank Economics as a resource for the clients of Scotiabank. Opinions, estimates and projections contained herein are our own as of the date hereof and are subject to change without notice. The information and opinions contained herein have been compiled or arrived at from sources believed reliable but no representation or warranty, express or implied, is made as to their accuracy or completeness. Neither Scotiabank nor any of its officers, directors, partners, employees or affiliates accepts any liability whatsoever for any direct or consequential loss arising from any use of this report or its contents.
These reports are provided to you for informational purposes only. This report is not, and is not constructed as, an offer to sell or solicitation of any offer to buy any financial instrument, nor shall this report be construed as an opinion as to whether you should enter into any swap or trading strategy involving a swap or any other transaction. The information contained in this report is not intended to be, and does not constitute, a recommendation of a swap or trading strategy involving a swap within the meaning of U.S. Commodity Futures Trading Commission Regulation 23.434 and Appendix A thereto. This material is not intended to be individually tailored to your needs or characteristics and should not be viewed as a “call to action” or suggestion that you enter into a swap or trading strategy involving a swap or any other transaction. Scotiabank may engage in transactions in a manner inconsistent with the views discussed this report and may have positions, or be in the process of acquiring or disposing of positions, referred to in this report.
Scotiabank, its affiliates and any of their respective officers, directors and employees may from time to time take positions in currencies, act as managers, co-managers or underwriters of a public offering or act as principals or agents, deal in, own or act as market makers or advisors, brokers or commercial and/or investment bankers in relation to securities or related derivatives. As a result of these actions, Scotiabank may receive remuneration. All Scotiabank products and services are subject to the terms of applicable agreements and local regulations. Officers, directors and employees of Scotiabank and its affiliates may serve as directors of corporations.
Any securities discussed in this report may not be suitable for all investors. Scotiabank recommends that investors independently evaluate any issuer and security discussed in this report, and consult with any advisors they deem necessary prior to making any investment.
This report and all information, opinions and conclusions contained in it are protected by copyright. This information may not be reproduced without the prior express written consent of Scotiabank.
™ Trademark of The Bank of Nova Scotia. Used under license, where applicable.
Scotiabank, together with “Global Banking and Markets”, is a marketing name for the global corporate and investment banking and capital markets businesses of The Bank of Nova Scotia and certain of its affiliates in the countries where they operate, including; Scotiabank Europe plc; Scotiabank (Ireland) Designated Activity Company; Scotiabank Inverlat S.A., Institución de Banca Múltiple, Grupo Financiero Scotiabank Inverlat, Scotia Inverlat Casa de Bolsa, S.A. de C.V., Grupo Financiero Scotiabank Inverlat, Scotia Inverlat Derivados S.A. de C.V. – all members of the Scotiabank group and authorized users of the Scotiabank mark. The Bank of Nova Scotia is incorporated in Canada with limited liability and is authorised and regulated by the Office of the Superintendent of Financial Institutions Canada. The Bank of Nova Scotia is authorized by the UK Prudential Regulation Authority and is subject to regulation by the UK Financial Conduct Authority and limited regulation by the UK Prudential Regulation Authority. Details about the extent of The Bank of Nova Scotia's regulation by the UK Prudential Regulation Authority are available from us on request. Scotiabank Europe plc is authorized by the UK Prudential Regulation Authority and regulated by the UK Financial Conduct Authority and the UK Prudential Regulation Authority.
Scotiabank Inverlat, S.A., Scotia Inverlat Casa de Bolsa, S.A. de C.V, Grupo Financiero Scotiabank Inverlat, and Scotia Inverlat Derivados, S.A. de C.V., are each authorized and regulated by the Mexican financial authorities.
Not all products and services are offered in all jurisdictions. Services described are available in jurisdictions where permitted by law.