- Colombia: July imports end nine consecutive months of negative growth
- Peru: Greater availability of imported cars boost auto sales in July
European hours started out with a bang on a sizable miss in UK CPI/RPI data after an uneventful Asia session (where Chinese banks left their reference rates unchanged, as expected). Narrow ranges in rates and FX in Asia gave way to choppy trading with the European open generally leaving a weaker USD at writing, including a 0.2% stronger MXN; the JPY and GBP are the clear exceptions to today’s dollar-negative mood. UST, EGB, and especially gilt curves are bull steepening.
Oil prices are off 1% continuing yesterday’s losses amid some maybe needed consolidation of gains; greater-than-expected Russian crude exports figures may also be weighing. Iron ore and copper are moving in the opposite direction with respective increases of 1.5% and 0.5%. US equity futures are 0.2% higher thanks to the leg lower in US yields in the last couple of hours.
Global markets await the Fed’s decision and Powell’s presser at 14ET and 14.30ET, respectively, with the focus on the bank’s updated inflation, growth, and rates projections in the so-called ‘dots’—which will likely show still one more hike and likely a higher median end-2024 Fed rate projection. Markets currently have a toss-up implied chance of a Fed hike by year end (Dec meeting priced at 12/13bps).
A few hours after the Fed, we have the only highlight of the Latam day ahead. It’s a long wait until the BCB’s announcement at 17.30ET, and it’s probably going to be a rather uneventful one as well. Officials are widely expected to cut the Selic rate by 50bps to 12.75%, in line with the guidance that was provided at the early-August decision. It looks like 50bps cuts at least through the remainder of 2023.
Yesterday’s weaker than expected economic activity data for July (muddied by revisions) will not motivate a larger rate cut today, nor should it change guidance. We may have a more unanimous vote from the Copom this time around, however, after the 5–4 vote split when rate cuts began in August between those favouring a 50bps cut versus those preferring a 25bps move.
Note that Chilean markets reopen today after two days of holidays and keep an eye out for the results of the biweekly Citibanamex economists survey this afternoon. Minimum wage increase discussions are also picking up in Colombia. Yesterday, deputy finance minister Guevara said that next year’s minimum wage increase should be at least a two-digit figure—in line with the reference being double-digit inflation, and so the vicious cycle of indexation and sticky elevated inflation continues.
—Juan Manuel Herrera
COLOMBIA: JULY IMPORTS END NINE CONSECUTIVE MONTHS OF NEGATIVE GROWTH
On Tuesday, September 19th, DANE (National Administration of Statistics) released the import data for July 2023, which amounted to USD 4.9 billion CIF, a decline of 28.2% y/y and becoming the ninth consecutive month in negative territory compared to July 2022 (chart 1). This decline was mainly due to a fall of 26.8% in the manufacturing group, which contributed -19.8 pp to the variation.
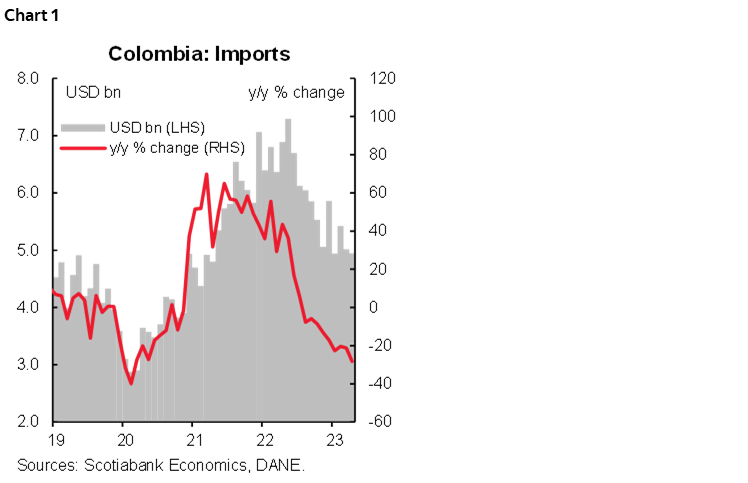
In July 2023, manufacturing imports accounted for 75.5% of the total CIF value of imports, followed by agriculture, food, and beverages with 14.2%, fuels and products of the extractive industries with 10.1%, and other sectors with 0.2%.
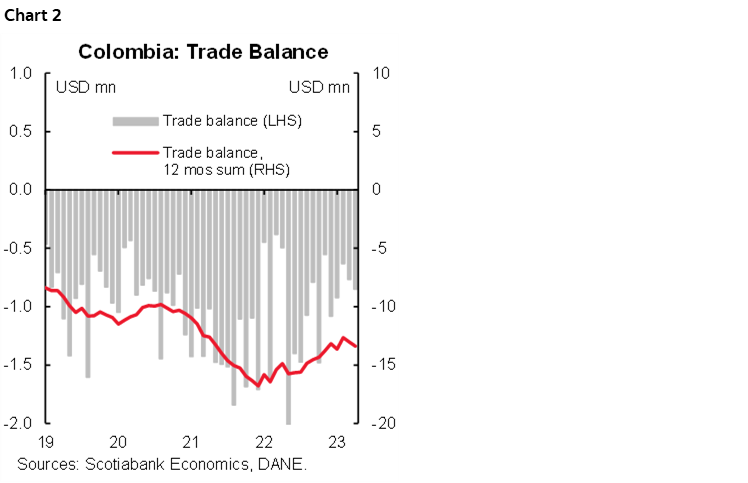
In terms of trade balance, in July 2023 there was a deficit of USD 600.2 million FOB, higher than that observed in July 2022 when the deficit was of USD 494.5 million FOB (chart 2). Deficit reduction is stabilizing despite imports continuing to decrease. Exports are also contracting. Either way, current deficit levels don’t represent a structural concern for the currency.
In terms of product groups, imports of manufactured goods reached USD 3.732 billion CIF in July 2023, an annual decline of 26.8% compared to July 2022, as a result of lower purchases of machinery and transport equipment (-25.9% y/y), which contributed -12.0 pp to the group’s variation. The second largest import group was the agriculture, food and beverages group, valued at USD 703.8 million CIF and a decline of 23.4% y/y vs July 2022, explained by lower imports of food products and live animals (-24.2% y/y), which contributed -19.0 pp to the group’s variation. In third place are imports of the group of fuels and products of the extractive industries with a value of USD 499.8 million CIF and an annual decrease of 42.6% y/y, with oil, petroleum products and related products being the product that contributed most to the decrease with an annual variation of -45.5% y/y and a negative contribution of 38.9 pp to the total variation of the group.
From the perspective of imports by economic use or destination, the three main groups continued in negative territory (chart 3):
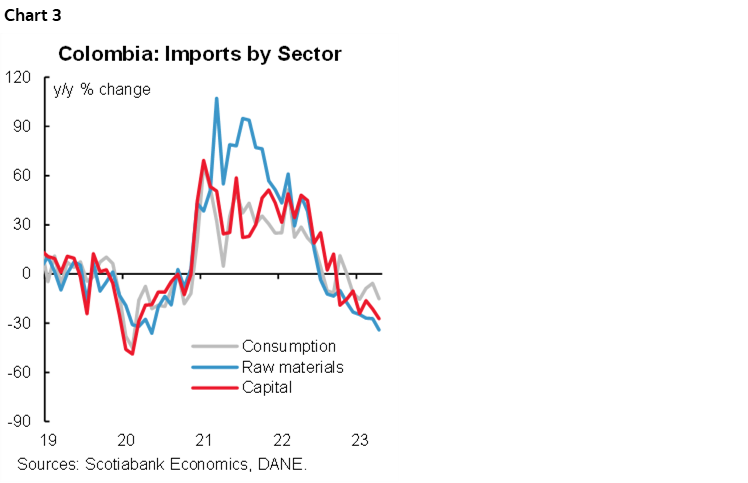
- Imports of consumer goods amounted to USD 1.13 billion CIF in July 2023, down 15.0% y/y. Non-durable consumer goods fell by 8.0% y/y, driven by declines in clothing (-27.6% y/y) and food (-22.4% y/y), which contributed negatively to the group’s variation with -0.3 pp and -0.9 pp respectively. These declines were offset by beverages (+58.1% y/y) and pharmaceuticals & toiletries (+7.6% y/y), which made positive contributions of 0.2 pp and 0.3 pp, respectively. Durable consumer goods fell 23.3% y/y in July, mainly due to a fall in household machinery and appliances (-54.4% y/y and contributing -0.9 pp to the overall variation in the group), followed by transport equipment (-17.1% y/y and contributing -0.9 pp). Likewise, “household appliances” and “furniture and other equipment for the home” registered annual falls of -32% y/y and -20.2% y/y respectively, in contrast to the annual growth shown by the latter in the previous month. However, weapons and military equipment grew by 148% and contributed +0.1 pp to the total variation.
- Imports of raw materials and intermediate goods amounted to USD 2.26 bn CIF in July 2023, a decrease of 34.1% y/y and a negative contribution of -17 pp to the total variation (the largest contributor). This was due to a 50% y/y decrease and a negative contribution of -2.6 pp in imports of raw materials and intermediate goods for agriculture, followed by fuels, lubricants, and related materials with a 43.1% y/y decrease in July and a contribution of -4.7 pp to the total. As for the group of raw materials and intermediate goods for industry (excluding construction), they registered a year-on-year decline of -28.6% in June 2022 and a contribution of -9.6 pp.
- Imports of capital goods reached a value of USD 1.54 billion, registering a decrease of 27.2% y/y in July 2023. This decrease was due to a decline in imports of construction materials (-34.1% y/y and a contribution of -0.9 pp), capital goods for industry (-28.2% y/y and the largest negative contributor to the variation with -4.8 pp in July) and imports of transport equipment with an annual variation of -25.3% y/y in July and a contribution of -2.7 pp. On the other hand, imports of capital goods for agriculture registered a growth of 54.5% y/y and contributed +0.1 pp in July 2023.
Concluding remarks
July’s import contraction is mirroring the weaker economic activity performance. However, trade deficit didn’t improve as exports in previous reports are also contracting versus one year ago. Either way, a lower trade deficit is a tailwind for the currency. In forthcoming months we don’t expect significant deficit reductions. Previous result also is aligned with our call for rate stability at the BanRep meeting on September 29th. We expect the first rate cut by the BanRep board to take place until December.
—Sergio Olarte, Jackeline Piraján & Santiago Moreno
PERU: GREATER AVAILABILITY OF IMPORTED CARS BOOST AUTO SALES IN JULY
Sales of light vehicles rose 10% y/y in July, according to figures by the Automobile Association of Peru (Asociación Automotriz del Perú, AAP). This was above our expectations, and was the second highest growth rate so far this year. In part this reflected a base effect, given that July sales last year were the lowest monthly register in 2022 (chart 4).
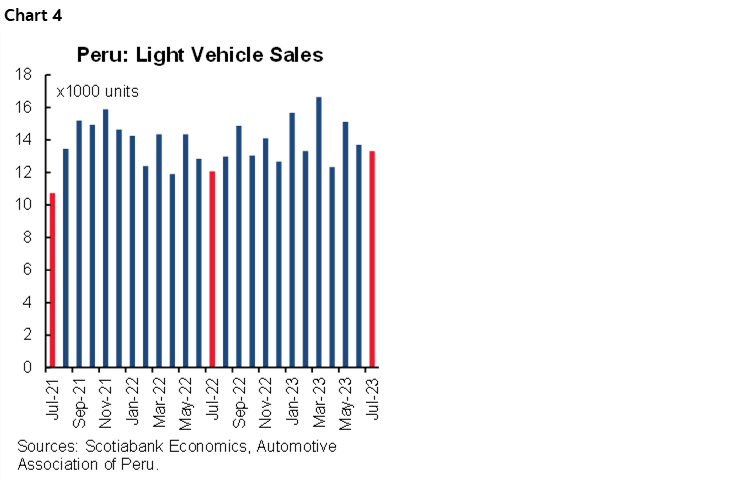
Before July, sales had been hampered by low availability due to problems with global supply chains. This was largely solved in July, which, coupled with promotional campaigns by dealers, drove sales. Another factor that we believe may have influenced the results is the progressive decline in the sol/dollar exchange rate since the end of 2022, as well as the relative political stability of the last few months.
Car sales between January and July rose 9% y/y. For the second half of the year, we expect light vehicle sales to continue rising, albeit at a slower pace than in previous months. For 2023, we maintain our forecast of 5% growth in light vehicle sales versus 2022, with some upward bias due to the results of the last few months.
—Carlos Asmat
DISCLAIMER
This report has been prepared by Scotiabank Economics as a resource for the clients of Scotiabank. Opinions, estimates and projections contained herein are our own as of the date hereof and are subject to change without notice. The information and opinions contained herein have been compiled or arrived at from sources believed reliable but no representation or warranty, express or implied, is made as to their accuracy or completeness. Neither Scotiabank nor any of its officers, directors, partners, employees or affiliates accepts any liability whatsoever for any direct or consequential loss arising from any use of this report or its contents.
These reports are provided to you for informational purposes only. This report is not, and is not constructed as, an offer to sell or solicitation of any offer to buy any financial instrument, nor shall this report be construed as an opinion as to whether you should enter into any swap or trading strategy involving a swap or any other transaction. The information contained in this report is not intended to be, and does not constitute, a recommendation of a swap or trading strategy involving a swap within the meaning of U.S. Commodity Futures Trading Commission Regulation 23.434 and Appendix A thereto. This material is not intended to be individually tailored to your needs or characteristics and should not be viewed as a “call to action” or suggestion that you enter into a swap or trading strategy involving a swap or any other transaction. Scotiabank may engage in transactions in a manner inconsistent with the views discussed this report and may have positions, or be in the process of acquiring or disposing of positions, referred to in this report.
Scotiabank, its affiliates and any of their respective officers, directors and employees may from time to time take positions in currencies, act as managers, co-managers or underwriters of a public offering or act as principals or agents, deal in, own or act as market makers or advisors, brokers or commercial and/or investment bankers in relation to securities or related derivatives. As a result of these actions, Scotiabank may receive remuneration. All Scotiabank products and services are subject to the terms of applicable agreements and local regulations. Officers, directors and employees of Scotiabank and its affiliates may serve as directors of corporations.
Any securities discussed in this report may not be suitable for all investors. Scotiabank recommends that investors independently evaluate any issuer and security discussed in this report, and consult with any advisors they deem necessary prior to making any investment.
This report and all information, opinions and conclusions contained in it are protected by copyright. This information may not be reproduced without the prior express written consent of Scotiabank.
™ Trademark of The Bank of Nova Scotia. Used under license, where applicable.
Scotiabank, together with “Global Banking and Markets”, is a marketing name for the global corporate and investment banking and capital markets businesses of The Bank of Nova Scotia and certain of its affiliates in the countries where they operate, including; Scotiabank Europe plc; Scotiabank (Ireland) Designated Activity Company; Scotiabank Inverlat S.A., Institución de Banca Múltiple, Grupo Financiero Scotiabank Inverlat, Scotia Inverlat Casa de Bolsa, S.A. de C.V., Grupo Financiero Scotiabank Inverlat, Scotia Inverlat Derivados S.A. de C.V. – all members of the Scotiabank group and authorized users of the Scotiabank mark. The Bank of Nova Scotia is incorporated in Canada with limited liability and is authorised and regulated by the Office of the Superintendent of Financial Institutions Canada. The Bank of Nova Scotia is authorized by the UK Prudential Regulation Authority and is subject to regulation by the UK Financial Conduct Authority and limited regulation by the UK Prudential Regulation Authority. Details about the extent of The Bank of Nova Scotia's regulation by the UK Prudential Regulation Authority are available from us on request. Scotiabank Europe plc is authorized by the UK Prudential Regulation Authority and regulated by the UK Financial Conduct Authority and the UK Prudential Regulation Authority.
Scotiabank Inverlat, S.A., Scotia Inverlat Casa de Bolsa, S.A. de C.V, Grupo Financiero Scotiabank Inverlat, and Scotia Inverlat Derivados, S.A. de C.V., are each authorized and regulated by the Mexican financial authorities.
Not all products and services are offered in all jurisdictions. Services described are available in jurisdictions where permitted by law.