- Chile: August GDP (-0.9% y/y; -0.5 m/m) disappoints market expectations
- Peru: Lower inflation surprises but El Niño is coming
CHILE: AUGUST GDP (-0.9% Y/Y; -0.5 M/M) DISAPPOINTS MARKET EXPECTATIONS
- Close to seeing a technical recession in the third quarter
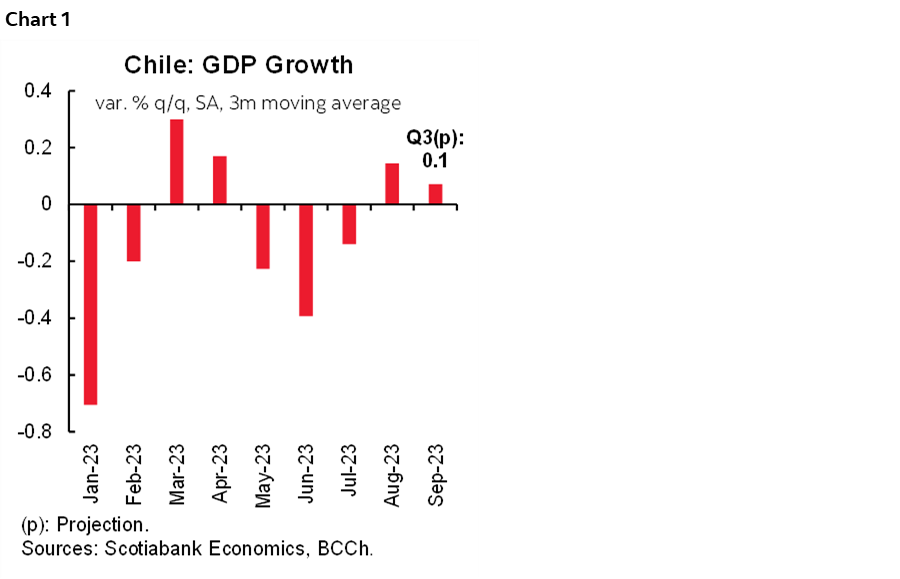
On Monday, October 2nd, the central bank (BCCh) released August GDP, which fell 0.9% y/y, below market expectations (Economist Survey: -0.2%; Bloomberg: -0.1%), but very close to ours (-0.6%), the most pessimistic in the market. We expect the consensus to move towards our projection of annual GDP contraction for 2023 of 0.5%, at the floor of the range of the last BCCh IPoM and far from the MoF’s zero growth projection. We reiterate a likely scenario of technical recession in Q3-23 as, with a moderate contraction of 0.3% m/m in September, we would have a seasonally adjusted decline in Q3 coming on the heels of the 0.4% q/q decline in Q2-23.
Non-mining activity performed poorly as it contracted by 0.5% m/m, mainly due to a 0.9% m/m drop in the services sector (45% of total GDP). Although we expected a drop in personal services activity (education), due to the weather effects during the month in some regions, this decline could reveal a more generalized weakness in other services sectors linked to the slow execution of public and private investment. With this, the services aggregate fell to its lowest GDP level of the year, the lowest since December 2022 (in seasonally adjusted terms, chart 1).
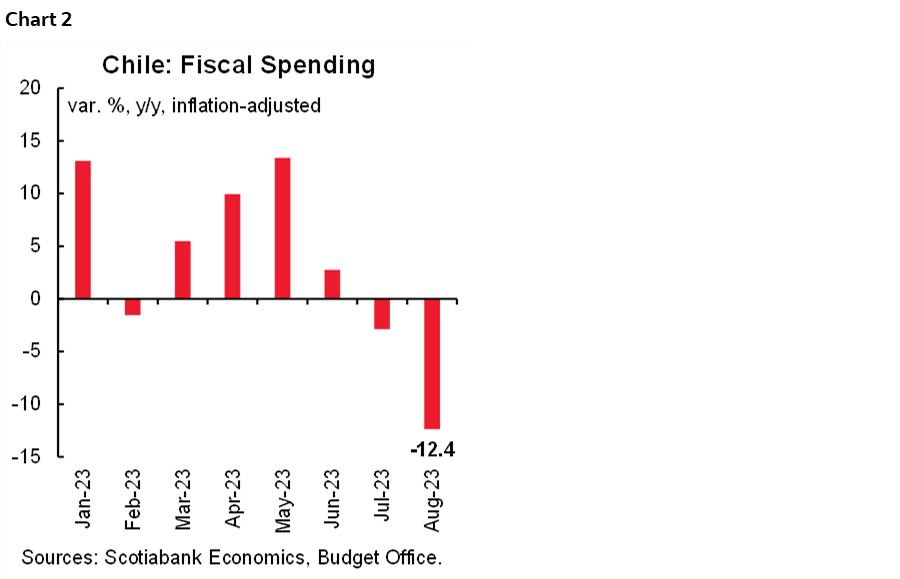
The contribution of public spending was negative in August and would continue to be so in the coming months. Total spending contracted by 12.4% y/y, with a 14% drop in current spending due to lower subsidies and a 0.9% drop in capital spending due to lower housing subsidies. With this, public spending accumulated an increase of 2.9% y/y between January and August (adjusted for inflation), and is expected to continue falling in the last 4 months of the year, considering the fiscal adjustment announced by the government a few weeks ago and the strong increase observed in the first part of the year (chart 2).
—Aníbal Alarcón
PERU: LOWER INFLATION SURPRISES BUT EL NIÑO IS COMING
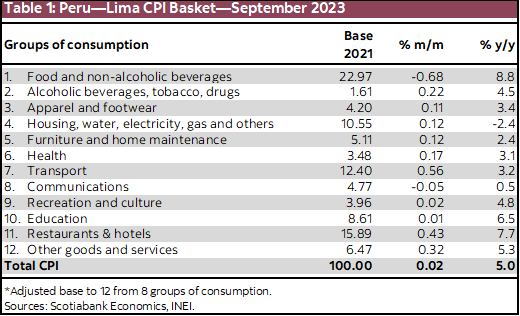
Inflation continues to surprise. This time it surprised on the downside, unlike August, which went up. The Lima CPI was practically zero (+0.02% m/m), below all forecasts, including the market consensus (according to a Bloomberg survey) and Scotiabank (0.25%); the historical average of the last 20 years (0.22%), and even official estimates. With this, year-on-year inflation continued to slow, going from 5.6% to 5.0%, reaching our forecast for the year-end, ahead of time.
The inflation surprise in September came from the price reversal of some perishable foods and the sharp decline in poultry prices (post avian flu), which together contributed to a decrease of 0.35 percentage points. This made it possible to offset the sharp rise practically completely in citrus and fuel prices.
The El Niño effects were observed in the sharp rise in the price of lemons (which contributed 0.30 percentage points) and tubers (which contributed 0.05 percentage points). Adverse weather conditions have continued to affect the supply of perishable products, as well as transportation problems, reflected in the number of roads with restricted traffic, which continued to increase, going from 42 in August to 55 in September, on average. The probabilities of El Niño have been increasing month by month. The latest reading confirms a moderate/strong scenario as the most likely for Q1-2024.
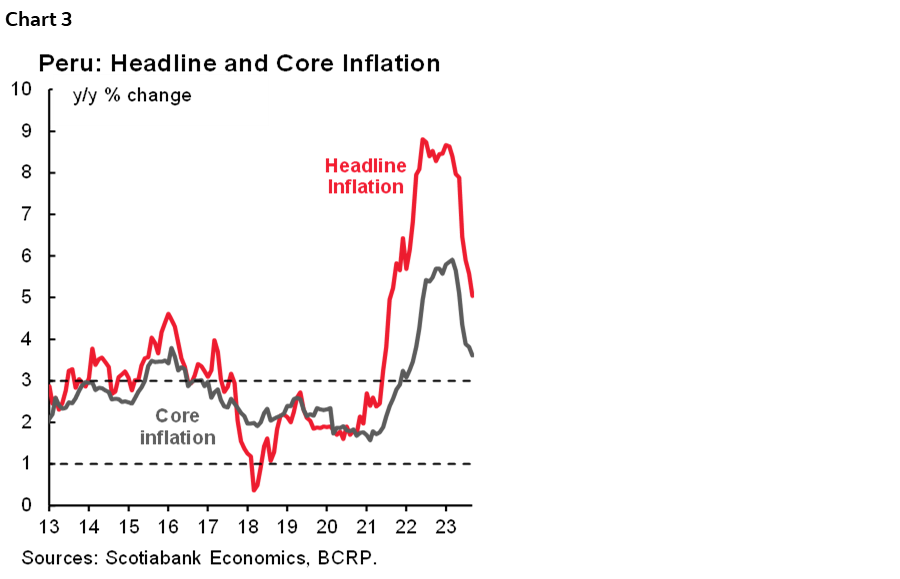
With inflation data from September, there are 28 months in which inflation remains above the upper limit of 3% of the inflation target (table 1). Inflation at the national level (not just in Lima) went from 5.8% to 5.3%, exceeding Lima’s inflation for 25 consecutive months. In September, of the 586 products that make up the consumption basket (2021 base), 315 increased (54%), 153 decreased (26%) and 118 remained unchanged (20%). This composition shows that the slowdown in inflation remains structurally slow. Core inflation rose 0.13%, slightly above its historical average (0.10%, last 20 years). In year-on-year terms it went from 3.8% to 3.6%, slowing for the sixth consecutive month (chart 3). Cost pressures remained low, with year-on-year variations close to zero. The PEN continued to depreciate in September, although in year-on-year terms it accumulated an appreciation of 5%, which helped keep the imported component of inflation low.
Looking ahead, we expect inflation to stabilize around 5% in October, due to a comparison base effect, since October 2022 inflation (0.35%) was the lowest in Q4-2022. With these results, we would be tempted to reduce our inflation forecast of 5.0% for end-2023, if not for the caution produced by the proximity of a strong El Niño scenario, recently warned by the governor of the central bank, who also pointed out which expects the agricultural sector to record its worst performance in 30 years. Therefore, our 5% forecast has a downward bias, depending on the intensity of El Niño in the last three months of the year. The BCRP indicated that El Niño could imply an impact on prices that renews inflationary pressures on the supply side, delaying reaching the inflation goal, initially planned by the BCRP for the first months of 2024, for a few more months.
—Mario Guerrero
DISCLAIMER
This report has been prepared by Scotiabank Economics as a resource for the clients of Scotiabank. Opinions, estimates and projections contained herein are our own as of the date hereof and are subject to change without notice. The information and opinions contained herein have been compiled or arrived at from sources believed reliable but no representation or warranty, express or implied, is made as to their accuracy or completeness. Neither Scotiabank nor any of its officers, directors, partners, employees or affiliates accepts any liability whatsoever for any direct or consequential loss arising from any use of this report or its contents.
These reports are provided to you for informational purposes only. This report is not, and is not constructed as, an offer to sell or solicitation of any offer to buy any financial instrument, nor shall this report be construed as an opinion as to whether you should enter into any swap or trading strategy involving a swap or any other transaction. The information contained in this report is not intended to be, and does not constitute, a recommendation of a swap or trading strategy involving a swap within the meaning of U.S. Commodity Futures Trading Commission Regulation 23.434 and Appendix A thereto. This material is not intended to be individually tailored to your needs or characteristics and should not be viewed as a “call to action” or suggestion that you enter into a swap or trading strategy involving a swap or any other transaction. Scotiabank may engage in transactions in a manner inconsistent with the views discussed this report and may have positions, or be in the process of acquiring or disposing of positions, referred to in this report.
Scotiabank, its affiliates and any of their respective officers, directors and employees may from time to time take positions in currencies, act as managers, co-managers or underwriters of a public offering or act as principals or agents, deal in, own or act as market makers or advisors, brokers or commercial and/or investment bankers in relation to securities or related derivatives. As a result of these actions, Scotiabank may receive remuneration. All Scotiabank products and services are subject to the terms of applicable agreements and local regulations. Officers, directors and employees of Scotiabank and its affiliates may serve as directors of corporations.
Any securities discussed in this report may not be suitable for all investors. Scotiabank recommends that investors independently evaluate any issuer and security discussed in this report, and consult with any advisors they deem necessary prior to making any investment.
This report and all information, opinions and conclusions contained in it are protected by copyright. This information may not be reproduced without the prior express written consent of Scotiabank.
™ Trademark of The Bank of Nova Scotia. Used under license, where applicable.
Scotiabank, together with “Global Banking and Markets”, is a marketing name for the global corporate and investment banking and capital markets businesses of The Bank of Nova Scotia and certain of its affiliates in the countries where they operate, including; Scotiabank Europe plc; Scotiabank (Ireland) Designated Activity Company; Scotiabank Inverlat S.A., Institución de Banca Múltiple, Grupo Financiero Scotiabank Inverlat, Scotia Inverlat Casa de Bolsa, S.A. de C.V., Grupo Financiero Scotiabank Inverlat, Scotia Inverlat Derivados S.A. de C.V. – all members of the Scotiabank group and authorized users of the Scotiabank mark. The Bank of Nova Scotia is incorporated in Canada with limited liability and is authorised and regulated by the Office of the Superintendent of Financial Institutions Canada. The Bank of Nova Scotia is authorized by the UK Prudential Regulation Authority and is subject to regulation by the UK Financial Conduct Authority and limited regulation by the UK Prudential Regulation Authority. Details about the extent of The Bank of Nova Scotia's regulation by the UK Prudential Regulation Authority are available from us on request. Scotiabank Europe plc is authorized by the UK Prudential Regulation Authority and regulated by the UK Financial Conduct Authority and the UK Prudential Regulation Authority.
Scotiabank Inverlat, S.A., Scotia Inverlat Casa de Bolsa, S.A. de C.V, Grupo Financiero Scotiabank Inverlat, and Scotia Inverlat Derivados, S.A. de C.V., are each authorized and regulated by the Mexican financial authorities.
Not all products and services are offered in all jurisdictions. Services described are available in jurisdictions where permitted by law.