- Chile: Non-mining economic activity remains resilient, rising 0.2% m/m driven by trade
- Colombia: Current account deficit narrows with financing coming mainly from FDI
- Peru: Inflation in May presages possible peak
CHILE: NON-MINING ECONOMIC ACTIVITY REMAINS RESILIENT, RISING 0.2% M/M DRIVEN BY TRADE
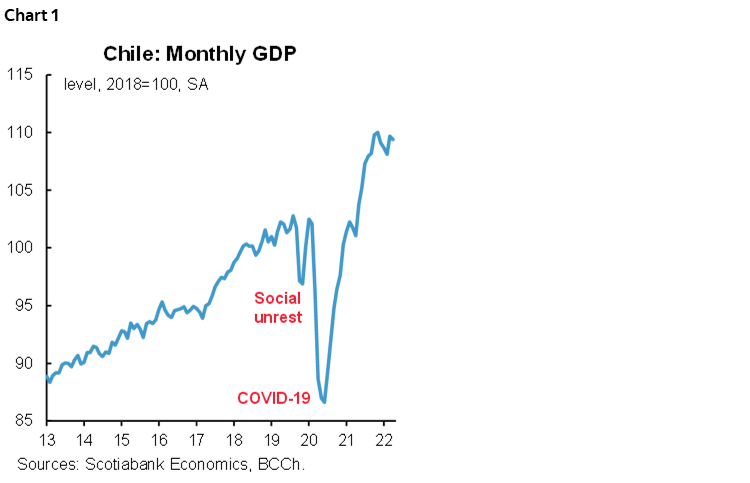
On Wednesday, June 1, the central bank released monthly GDP for April (chart 1), which rose 6.9% y/y (-0.3% m/m), in line with our expectation (6.5% y/y) and below Bloomberg’s market consensus (8.5%). Activity continued to moderate, especially in the commerce sector, and was supported by the recovery of mobility and the liquidity still available in households resulting from pension withdrawals and fiscal aid, complemented by a slow but favourable rate of job creation.
There was a rebound in trade, closely associated with the automotive sector. In seasonally adjusted terms, commercial activity grew 1.8% m/m, standing out as the only sector that showed an increase in April (chart 2). The rebound was explained by a positive performance of the automotive sector, which according to the figures showed by the statistical agency (INE) released yesterday, experienced a 12% y/y increase in sales. Despite this rebound, trade is likely to continue to the slowing trend that began a few months ago, which has been gradual thanks to the support of abundant liquidity in debit and checking accounts.
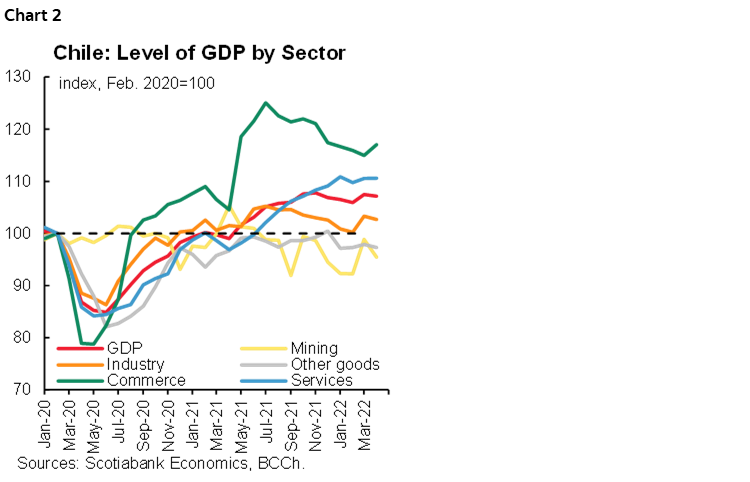
In contrast, the persistent weakness shown by mining stands out, which again reduced copper production, offsetting the expansion that lithium production has been generating for some months. The poor performance of other sectors also stands out, mainly construction, which continues below its pre-COVID-19 levels, revealing for now a slow progress in investment, mainly public.
Public investment was muted in April. Fiscal expenditures showed a 23% y/y drop, explained by a high comparison base for current spending and a 5.6% y/y drop in capital spending, mainly owing to reduced execution of investment projects in housing, reflecting the increase in costs. Some projects have experienced delays in their implementation resulting from cost overruns. To unblock these projects, the government is exceptionally approving cost overruns of up to 20%, which will accelerate the pace of execution in the coming months.
We maintain our projection of GDP growth of 3% for this year, well above the 1.5% growth forecast in the Economic Expectations Survey. However, we anticipate a convergence of market expectations towards our forecast in the coming months given the continued resilience in the economy, dispelling expectations of an abrupt adjustment in activity.
—Jorge Selaive, Anibal Alarcón, & Waldo Riveras
COLOMBIA: CURRENT ACCOUNT DEFICIT NARROWS WITH FINANCING COMING MAINLY FROM FDI
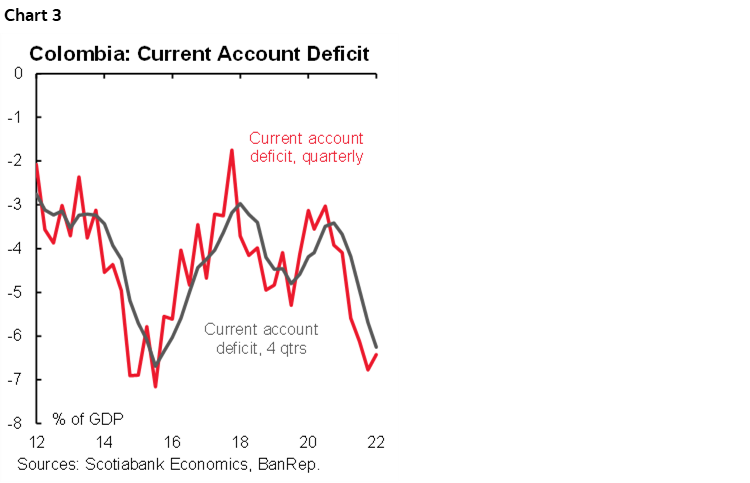
On Wednesday, June 1, the central bank (BanRep) released Q1-2022 current account data showing a quarterly deficit of USD 5.37 bn, equivalent to 6.4% of GDP (chart 3), down somewhat from the Q4-2021 figure but near the 2015 high. Exports benefited from higher commodity prices, while imports remained broadly stable compared with the previous quarter. Remittances helped narrow the deficit, while income account outflows weighed against further declines. As a percentage of the GDP, the deficit fell from 6.8% to 6.4%, reflecting stronger economic activity at the start of 2022.
We expect the current account deficit will remain broadly stable over the balance of 2022, as the economic recovery fuels import demand and exports continue to be driven by higher commodity prices. However, as a share of GDP, we estimate the deficit to shrink to 5% of GDP or less as economic growth increases the denominator. All in all, the current account deficit will continue to affect the currency, which from the perspective of flows would impede the FX to return to pre-pandemic levels.
Additional information with respect to the balance of payments accounts:
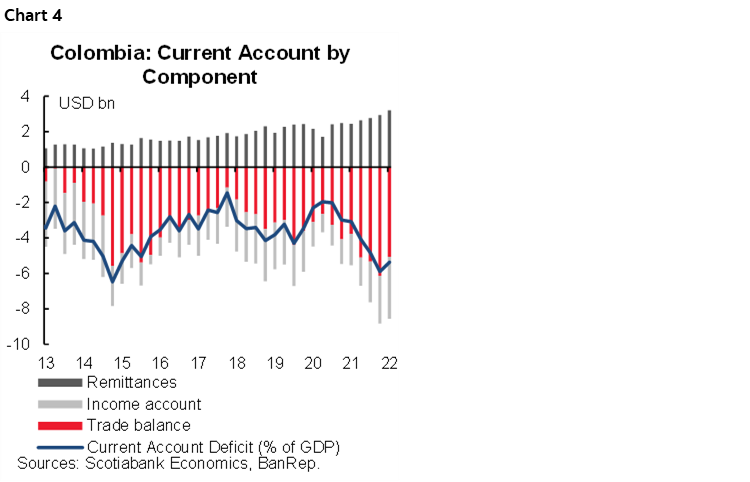
- Current account: The current account deficit stood at USD 5.37 bn in Q1-2022. While the trade deficit accounted for most of the current account deficit (USD 3.56 bn), income account outflows (USD 3.52 bn) added to the deficit (chart 4). Inflows from transfers (mainly remittances), partially offset the former two effects, reaching a historic high of USD 3.2 bn.
- Trade balance: Exports expanded on higher commodity prices, which in the case of coffee and coal offset the contraction of exported volumes. In the case of oil-related products, prices rose (+60.4%) but also quantities exported (+10.1% y/y). On the import side, Colombia’s purchases were concentrated in inputs for the industrial sector (+41.1% y/y), fuel oil (+146.1% y/y), and consumption goods (+25.1% y/y).
- Income account: Net outflows stood at USD 3.50 bn, increasing by USD 1.73 bn, as profits rebounded across Colombia’s economic sectors, especially those sectors with high FDI, such as oil and mining, transport, communication, and financial services.
- Net current transfer inflows stood at USD 3.2 bn (+30.5% y/y), the highest level since 2000 according to BanRep statistics. Net remittances inflows represented 2.4% of GDP and 9.5% of the current income of the balance of payments, which would explain why households’ consumption remains strong despite the fact that employment hasn’t recovered domestically.
Financing side:
FDI inflows (USD 5.19 bn) reached the highest level since 2005, mainly concentrated in financial services (40%) and the oil and mining sector (23%). On a net basis, FDI inflows were USD 3.85 bn in Q1-2022, up USD 2.36 bn y/y (chart 5), reflecting the effect of the Gilinski's COP 2.4 bn takeover of Nutresa and Sura. According to BanRep’s report, 40% of total FDI was allocated to the financial sector, 23% in oil and mining sector, and 13% in transport and communications. Roughly 45% of FDI was on new capital investments, while 30.5% represented reinvestment, and 24.1% of the debt with parent companies. We expect FDI to continue to recover in 2022, with a surge in H2-2022, following the final results of the presidential elections.
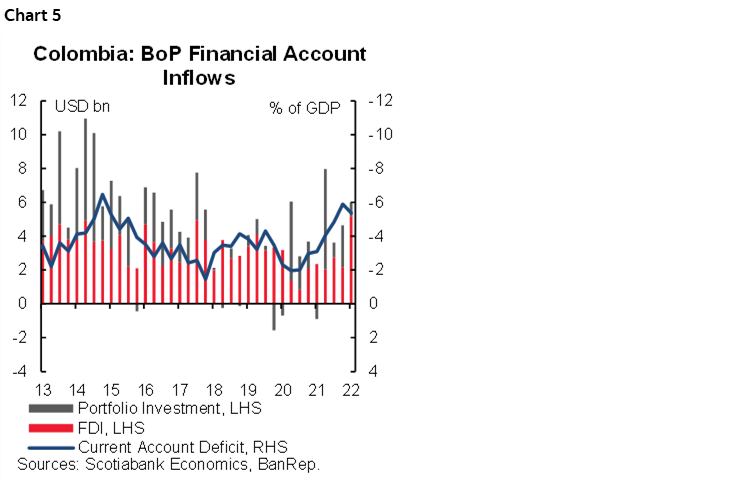
Portfolio inflows (USD 800.4 mn) were down from the previous quarter (USD 2.47 bn). On a net basis, portfolio investment recorded an outflow of USD 1.80 bn. Total inflows were USD 800 million, below the mark in the previous quarter (USD 2.80 bn), and mostly explained by inflows to the COLTES market. Outflows totaled USD 2.60bn, the highest level since Q3 2020, mainly on private investments abroad. Most of this is related to agents such as Pension Funds increasing their offshore positioning, though some outflows reflect individual accounts, possibly associated with a pre-electoral strategy.
For 2022, we are not expecting movements such as those observed in a previous couple of years, which featured extraordinary amounts of external financing, and the use of the IMF SDR credit lines. From this perspective, we expect the financial account to reflect the financing of real-side economic activity, which is leading to sustainable wide current account deficit.
—Sergio Olarte, Maria (Tatiana) Mejía & Jackeline Piraján
PERU: INFLATION IN MAY PRESAGES POSSIBLE PEAK
Inflation was 0.38% m/m in May, in line with our own forecast of 0.3%, but below the Bloomberg market consensus (0.6%). While this was the highest m/m rate in 6 years for the month of May, it nevertheless confirms that the monthly pace of inflation is slowing, after the increases in March (1.48% m/m) and April (0.96% m/m); moreover, it is possible that inflation will peak in June.
Year-on-year inflation accelerated marginally from 8.0% y/y to 8.1% y/y (chart 6), with May marking the 12th consecutive month that inflation exceeded the upper limit of the central bank’s target range (between 1% and 3%).
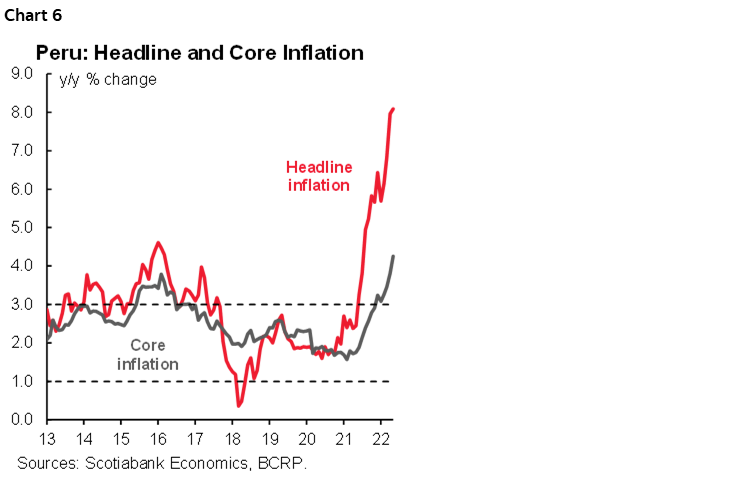
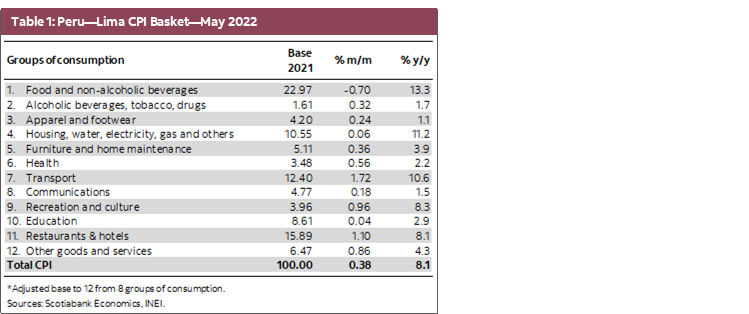
May inflation reflected a moderation of food prices, which had risen significantly in April. Of the 586 products that make up the consumer basket (base 2021), 405 (69%) rose, 109 (19%) fell, and 72 (12%) remained unchanged (table 1). Core inflation went from 3.8% y/y in April to 4.3% y/y in May, above the upper limit of the target range (3%) for the sixth consecutive month.
Wholesale inflation, linked to production costs, went from 13.1% in April to 13.7% in May, the highest rate since November 2021. Meanwhile, the USDPEN exchange rate, which depreciated 1.9% y/y in April, appreciated 3.2% y/y in May, helping to contain the pace of inflation.
For June, we expect inflation between 8.0% y/y and 8.3% y/y, driven by the recent rise in the price of poultry products and by expected increases in local gasoline prices, given the upward trend in the international price of gasoline. These pressures could be contained by a somewhat higher base of comparison, as June 2021 inflation was 0.52% m/m. The government has announced a temporary VAT reduction for a set of products such as chicken, eggs, milk, meat, wheat, pasta, and sugar until July, although the impact of this measure on prices seems to be marginal. There is also a reduction in taxes on fuels, such as diesel and gasoline, in effect until the end of June.
In our Latam Weekly of May 27, 2022, we maintained our inflation forecast for 2022 at 6.4% and for 2023 at 4.0%, with the caveat that inflation is likely to prove persistent so that inflation would not return to the target range until 2024. From 2000 to now, the longest period with inflation above 3% was 21 months (between October 2007 and June 2009). With the May result, there are already 12 consecutive months in which inflation exceeded 3%.
Over the last ten months, the central bank raised its benchmark rate by 475 basis points to 5.00% and increased reserve requirements three times. We believe that further increases in the policy rate are necessary to avoid major deviations in inflation expectations (4.62% in 12 months according to the BCRP April survey, the highest level since August 2008) away from the target range. Accordingly, we expect a 50 bps hike at its meeting on Thursday, June 9.
—Mario Guerrero
DISCLAIMER
This report has been prepared by Scotiabank Economics as a resource for the clients of Scotiabank. Opinions, estimates and projections contained herein are our own as of the date hereof and are subject to change without notice. The information and opinions contained herein have been compiled or arrived at from sources believed reliable but no representation or warranty, express or implied, is made as to their accuracy or completeness. Neither Scotiabank nor any of its officers, directors, partners, employees or affiliates accepts any liability whatsoever for any direct or consequential loss arising from any use of this report or its contents.
These reports are provided to you for informational purposes only. This report is not, and is not constructed as, an offer to sell or solicitation of any offer to buy any financial instrument, nor shall this report be construed as an opinion as to whether you should enter into any swap or trading strategy involving a swap or any other transaction. The information contained in this report is not intended to be, and does not constitute, a recommendation of a swap or trading strategy involving a swap within the meaning of U.S. Commodity Futures Trading Commission Regulation 23.434 and Appendix A thereto. This material is not intended to be individually tailored to your needs or characteristics and should not be viewed as a “call to action” or suggestion that you enter into a swap or trading strategy involving a swap or any other transaction. Scotiabank may engage in transactions in a manner inconsistent with the views discussed this report and may have positions, or be in the process of acquiring or disposing of positions, referred to in this report.
Scotiabank, its affiliates and any of their respective officers, directors and employees may from time to time take positions in currencies, act as managers, co-managers or underwriters of a public offering or act as principals or agents, deal in, own or act as market makers or advisors, brokers or commercial and/or investment bankers in relation to securities or related derivatives. As a result of these actions, Scotiabank may receive remuneration. All Scotiabank products and services are subject to the terms of applicable agreements and local regulations. Officers, directors and employees of Scotiabank and its affiliates may serve as directors of corporations.
Any securities discussed in this report may not be suitable for all investors. Scotiabank recommends that investors independently evaluate any issuer and security discussed in this report, and consult with any advisors they deem necessary prior to making any investment.
This report and all information, opinions and conclusions contained in it are protected by copyright. This information may not be reproduced without the prior express written consent of Scotiabank.
™ Trademark of The Bank of Nova Scotia. Used under license, where applicable.
Scotiabank, together with “Global Banking and Markets”, is a marketing name for the global corporate and investment banking and capital markets businesses of The Bank of Nova Scotia and certain of its affiliates in the countries where they operate, including; Scotiabank Europe plc; Scotiabank (Ireland) Designated Activity Company; Scotiabank Inverlat S.A., Institución de Banca Múltiple, Grupo Financiero Scotiabank Inverlat, Scotia Inverlat Casa de Bolsa, S.A. de C.V., Grupo Financiero Scotiabank Inverlat, Scotia Inverlat Derivados S.A. de C.V. – all members of the Scotiabank group and authorized users of the Scotiabank mark. The Bank of Nova Scotia is incorporated in Canada with limited liability and is authorised and regulated by the Office of the Superintendent of Financial Institutions Canada. The Bank of Nova Scotia is authorized by the UK Prudential Regulation Authority and is subject to regulation by the UK Financial Conduct Authority and limited regulation by the UK Prudential Regulation Authority. Details about the extent of The Bank of Nova Scotia's regulation by the UK Prudential Regulation Authority are available from us on request. Scotiabank Europe plc is authorized by the UK Prudential Regulation Authority and regulated by the UK Financial Conduct Authority and the UK Prudential Regulation Authority.
Scotiabank Inverlat, S.A., Scotia Inverlat Casa de Bolsa, S.A. de C.V, Grupo Financiero Scotiabank Inverlat, and Scotia Inverlat Derivados, S.A. de C.V., are each authorized and regulated by the Mexican financial authorities.
Not all products and services are offered in all jurisdictions. Services described are available in jurisdictions where permitted by law.