- Brazil: BCB delivers expected rate hike
- Colombia: Activity indicator shows strength, while BanRep inflation expectations survey points to persistent inflation
- Peru: April GDP growth—another strong, er… weak, er… let’s call it lukewarm, month
BRAZIL: BCB DELIVERS EXPECTED RATE HIKE
The BCB delivered the 50 bps hike expected by most analysts, to 13.25% (chart 1), we were outliers, expecting +75 bps. The Board painted a mixed picture for forward decisions, highlighting a deteriorating growth outlook offset by stronger-than-anticipated domestic economic activity. The Copom took note of rising global risk aversion, which to us is one of the biggest risks to some Latin American yield curves that are pricing in the start of easing cycles ahead of the Fed. This could prove a challenge, particularly for those markets most reliant on foreign investors (i.e. Mexico and Brazil).

Similar to the Fed, the BCB noted that longer end inflation expectations remain anchored, which could be one of the arguments for the BCB to reverse its tightening relatively soon, but to us the key is global risk appetite.
The BCB’s central scenario assumes the Selic will sit at 13.25% at the end of 2022, falling to 10% in 2023, and 7.50% in 2024. However, the BCB signaled that for the next meeting, the Board will likely decide on a similar or smaller hike (i.e. +50 bps or +25 bps). The DI curve is currently pricing in a terminal rate somewhere between 13.75% and 14.00% (about 50/50 odds for either).
Our current forecast is for the SELIC to close Q2 at 13.50 (which will no longer be the case), and for it to remain at that level till year-end. As we now know, the Selic will close Q2 at 13.25%, but whether the terminal rate is 13.50% or 13.75% will likely depend on how Brazilian markets perform over the coming weeks. And while we agree that Brazil’s neutral rate will likely sit around 7.5%, the pace of moving in that direction should take financial market dynamics into account.
—Eduardo Suárez
COLOMBIA: ACTIVITY INDICATOR SHOWS STRENGTH, WHILE BANREP INFLATION EXPECTATIONS SURVEY POINTS TO PERSISTENT INFLATION
I. Economic activity in April supports expectations of solid growth
On Wednesday, June 15, the Statistical Agency of Colombia (DANE) published its monthly survey of economic activity for April. Manufacturing output and retail sales recorded stronger-than-expected expansions despite the inflationary context. In addition, DANE published confidence figures that showed companies remaining optimistic but with growing concerns about possible weaker demand owing to high inflation. In addition, some companies related to construction projects have observed a lower dynamic of investment resulting from political uncertainty and problems in input supply.
Retail sales in April had extraordinary results explained in part by a base effect reflecting lower mobility a year ago, but also continuing solid levels of consumption from the opening of the economy. Our current GDP growth forecast of 6.3% in 2022 is consistent with previous results, since the economy shows a greater momentum arising from consumption, while strong tax collection reveals a healthy diagnosis with respect to activity.
Manufacturing Production
Manufacturing production increased by 13.5% year-on-year, above market consensus (+10.3% y/y) and our expectation (11.7% y/y), though the month-on-month increase of 0.2% m/m sa is less strong than in the previous month (chart 2). Manufacturing activity was negatively impacted by Easter holidays owing to fewer days of operation in the reporting period. In the current year, production has grown 12.7% y/y, strongly propelled by activities now finding stronger demand due to the total reopening.
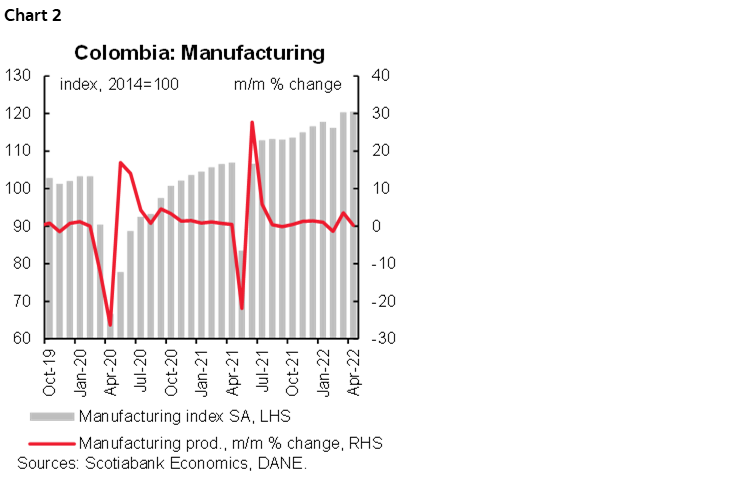
On a y/y basis, the best performing sectors were beverages (+19.5% y/y), clothing (32.8% y/y), and paper and cardboard-related products (+22.1% y/y), which contributed 4.5 ppts (33% of total expansion). The performance of these sectors is explained by the return to normality. Sectors that subtracted from the performance, in contrast, include coffee threshing (-20.6%y/y), manufacture of parts and pieces for vehicles (-5.6%y/y), processing of milling products (-4.6%y/y), and the processing of sugar and panela (-8.1%y/y) due to high input costs which affect production, added to the winter season that has particularly affected the sugar and panela sector.
Employment grew 4.3% y/y. On a monthly basis, employment increased by 0.3% m/m. This is a positive sign for the recovery of the labour market, and we highlight that manufacturing sector already surpasses pre-pandemic employment levels.
Retail Sales
Retail sales showed a 23.3% y/y increase in April, well above the Bloomberg survey (+19.1% y/y and our expectation of 15% y/y), (chart 3), while employment increased by 2.8% y/y. On a seasonally adjusted basis, retail sales (excluding other vehicles) contracted -5.5% m/m, showing some moderation as an effect of extraordinary purchases in March due to the VAT holiday. In annual terms, retail sales increased, in part on a statistical base effect since one year ago restrictions on mobility were in place as a consequence of the third wave of infections, as well as the National Strike. But it is worth noting that for this year the opening of the economy and the return to offices, schools, and universities implies that consumption levels remain at solid levels, added to the holidays (Easter) effect that reinforces a greater demand for consumption goods.
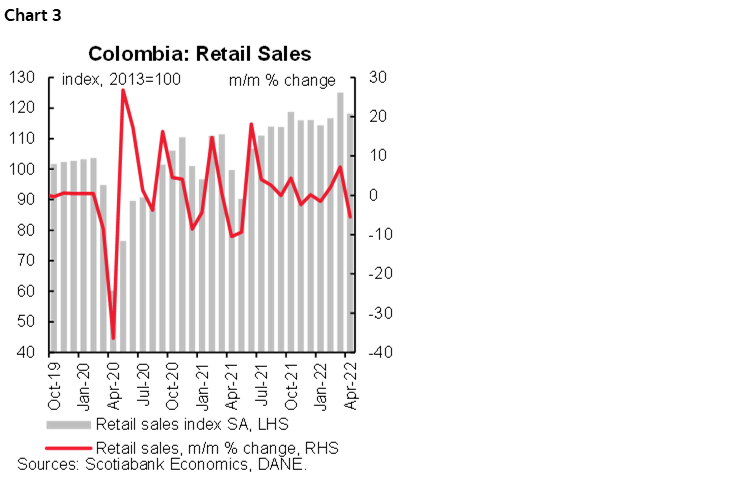
Compared to April 2021, the expansion of retail sales was explained by sales of clothing (+104.9% y/y), footwear (+86.5% y/y), and technology products (+45.5%y/y) which contributed by around 5.3 ppts to the total expansion. The only activity thar made a negative contribution was pharmaceutical and medicinal products (-1.2% y/y) explained by lower demand for COVID-19 vaccines.
Looking ahead to the full year 2022, and especially for the second half of the year, we expect some slowdown in private consumption towards healthier expansion rates as the impacts of inflation and a rise in credit cost due to a tighter monetary policy begin to bind.
Services & Hotels
In April 2022, all service activities showed positive expansion, with the most robust growth in the film and television-related industry (+344.2% y/y). In terms of employment, editing activity continues to lag (-2.8% y/y), while employment growth was concentrated especially in activities related to IT, restaurants and bars, and advertising-related activities, partially explained by the election season.
In the hotels sector, revenue in April 2022 showed an increase of 108.9% y/y, and employment increased by 30% y/y. Hotel occupancy reached 54.8%, above pre-pandemic levels of 48.1%. Business trips continued on the path to recovery this month, accounting for 34.4% of total occupancy, and leisure travel accounted for 57.4% mainly explained for this month by Easter week.
DANE also released data on the performance of online commerce, which in April fell by -11.4% y/y, explained by the fact that people are now going in-person to warehouses, as well as the comparison of a year ago, when lower mobility implied greater demand for digital purchases.
All in all, although activity indicators showed a positive surprise in April amid a further consolidation of the dynamics of the new normal, confidence surveys show that companies are cautious about the future due to the impact of inflation on their margins and lower levels of demand added to problems in inputs due to the international context and the uncertainty that derives from the electoral scenario.
Our base case scenario remains that the economy will continue to put in a robust performance, growing by 6.3% in 2022. However, in H2-2022 we expect more moderate private consumption as a result of restrictive monetary policy. That said, we expect BanRep to increase by 150 bps the monetary policy rate at the June 30 meeting to reach a 7.5% rate.
II. BanRep’s survey show inflation expectations keep increasing, while the terminal rate is now expected to be 8.50%
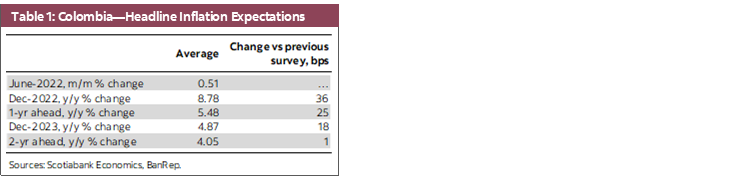
On Wednesday afternoon, June 15, the central bank, BanRep, published its monthly survey of economic expectations. Inflation expectations for the end of 2022 increased by 36 bps, despite May’s inflation coming in close to expectations (table 1). In the same vein, by the end of 2023, the survey showed inflation expectations further deviated from the ceiling of the target range (4.87%), signaling that current high inflation will continue having indexation effects in the future. At Scotiabank Economics, we expect June inflation above the market consensus (0.71% m/m), with inflation closing the year at 9.10%.
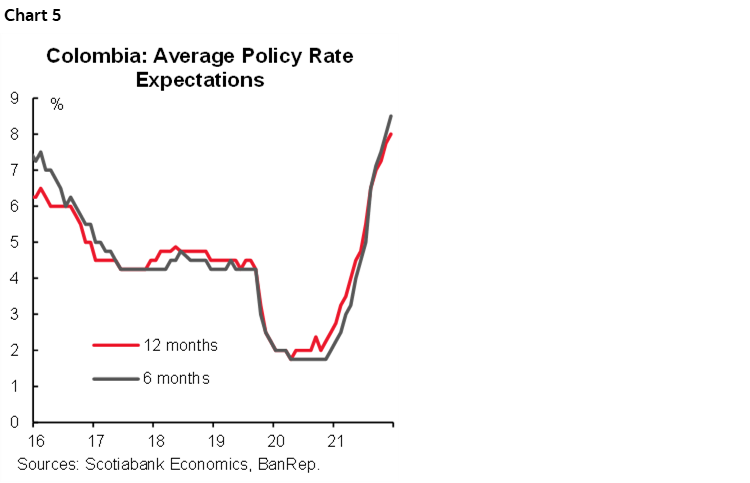
The hiking cycle is expected to continue in 2022, with 100 bps hikes in June and July, and an additional increase of 50 bps in September, to reach 8.50% as the terminal rate (+25 bps compared to the previous survey). Scotiabank Economics Colombia anticipates a 150 bps hike in the June 30 meeting, while July’s meeting is expected to deliver a final move of 100 bps. The higher rate is expected to last around one year before starting to reverse.
- Short-term inflation expectation. For May, the consensus is 0.51% m/m, which places annual inflation at 9.67% year-on-year (from 9.07% in May). That said, the dispersion of the survey remains high with a minimum expectation of 0.23% m/m and a maximum of +0.85% m/m. Scotiabank Economics expects monthly inflation for June to be +0.71% m/m and 9.89% y/y. In June, we will have offsetting effects from still high food inflation and a negative contribution due to the VAT holiday.
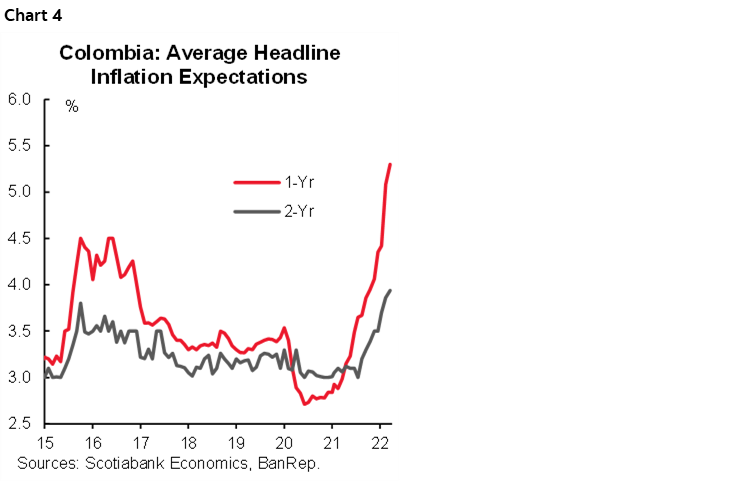
- Medium-term inflation. Inflation expectations rose to 8.78% y/y for December 2022, 36 basis points above last month’s survey (table 1 again). High input prices remain the main risk for headline inflation. Inflation expectations for one-year ahead stood at 5.23% y/y (above last month’s reading of 5.23% y/y); while the two-year forward increased 1 bps to 4.05% y/y, showing that there is still uncertainty regarding the achievement of the inflation target range in the medium term (chart 4).
- Policy rate. Despite increasing inflation expectations, on average, the consensus still expects a 100 bps rate hike in June and July’s meetings, to leave the rate at 8% (from the current 6%), with a new hike of 50 bps in September to reach a terminal rate of 8.50% (chart 5). Scotiabank Economics expects 150 bps hikes in June and +100 bps in July. That said, the monetary policy rate is expected to close at 8.50% in 2022, and at 6.50% in 2023, which point that monetary policy will become contractive in the future.
- FX. The USDCOP projections for the end of 2022 were located at 3,838 pesos (close to the previous survey 3,852 pesos). By December 2023, respondents think, on average, that the peso will end the year at USDCOP 3,743, and in 2024 at 3,695. We believe that the USDCOP is likely to close 2022 at 3,755.
—Sergio Olarte, Maria (Tatiana) Mejía & Jackeline Piraján
PERU: APRIL GDP GROWTH—ANOTHER STRONG, ER… WEAK, ER… LET’S CALL IT LUKEWARM, MONTH
On the face of it, 3.7% y/y growth in April looks like a robust figure, nearly matching first quarter growth of 3.8% y/y. And yet, it is down 1.0% m/m from March, the second consecutive m/m decline (-1.3 m/m in March). Seasonally-adjusted GDP has slipped below its pre-COVID-19 level (chart 6), after having surpassed that level for seven months, between August 2021 and February 2022.

In part, anomalies during the COVID-19 lockdown and aftermath are still affecting growth in different ways (table 2). The 8.0% decline y/y (and -0.5% m/m) in financial services reflects the lagging effect of the government-sponsored Reactiva loans program, as these loans are prepaid or mature. The strong growth in hotels & restaurants and transportation, which together represented 1.6 ppts of the 3.7% total growth, is the late rebound from COVID-19 mobility restrictions which were only gradually lifted throughout 2021. The figures suggest these two sectors may underpin growth for a while yet, but increasingly less so over time.
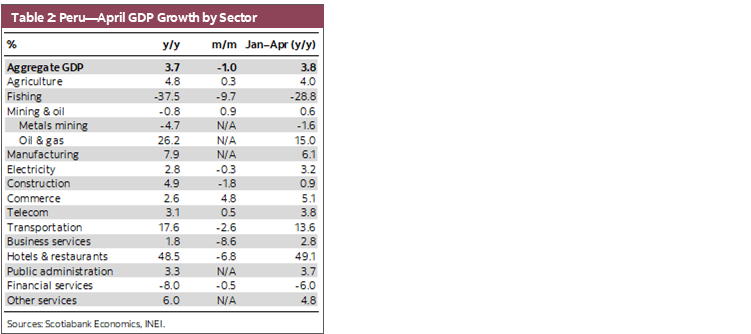
April mining GDP growth (-4.7% y/y) also reflects the impact of the halt in output at the Las Bambas copper mine owing to social protests. The brighter spot is manufacturing (non-resource processing), up a hefty 7.9%, in line with consumption, although part may reflect increasing textiles exports. Oil & gas, up 26% y/y, is also notable, as greater output is in response to higher demand both outside and inside the country.
So, is the glass half full, or is it half empty? Both. GDP growth continues to be mildly above what we were expecting when we initially made our forecast of 2.6% for full-year 2022, albeit not by enough to lead us to revise our forecast (at least not yet), and manufacturing growth is definite positive. At the same time, it is disappointing that GDP cannot seem to keep its head above the pre-COVID-19 waterline, that the drivers of growth are largely rebound sectors, and that even these sectors haven’t performed will in m/m terms in April.
These caveats lead us to wonder what the BCRP makes of the country’s GDP growth trend? Will it take heart in the robust y/y growth trend to justify a more aggressive monetary policy? Or will it take a good look under the hood to see if the factors driving the economy are really as sturdy as the headline figures suggest? We’re biased to the latter, and expect the BCRP to avoid being much more aggressive in raising its reference rate than it already has been, and for it to end cycle of reference rate increases soon.
—Guillermo Arbe
DISCLAIMER
This report has been prepared by Scotiabank Economics as a resource for the clients of Scotiabank. Opinions, estimates and projections contained herein are our own as of the date hereof and are subject to change without notice. The information and opinions contained herein have been compiled or arrived at from sources believed reliable but no representation or warranty, express or implied, is made as to their accuracy or completeness. Neither Scotiabank nor any of its officers, directors, partners, employees or affiliates accepts any liability whatsoever for any direct or consequential loss arising from any use of this report or its contents.
These reports are provided to you for informational purposes only. This report is not, and is not constructed as, an offer to sell or solicitation of any offer to buy any financial instrument, nor shall this report be construed as an opinion as to whether you should enter into any swap or trading strategy involving a swap or any other transaction. The information contained in this report is not intended to be, and does not constitute, a recommendation of a swap or trading strategy involving a swap within the meaning of U.S. Commodity Futures Trading Commission Regulation 23.434 and Appendix A thereto. This material is not intended to be individually tailored to your needs or characteristics and should not be viewed as a “call to action” or suggestion that you enter into a swap or trading strategy involving a swap or any other transaction. Scotiabank may engage in transactions in a manner inconsistent with the views discussed this report and may have positions, or be in the process of acquiring or disposing of positions, referred to in this report.
Scotiabank, its affiliates and any of their respective officers, directors and employees may from time to time take positions in currencies, act as managers, co-managers or underwriters of a public offering or act as principals or agents, deal in, own or act as market makers or advisors, brokers or commercial and/or investment bankers in relation to securities or related derivatives. As a result of these actions, Scotiabank may receive remuneration. All Scotiabank products and services are subject to the terms of applicable agreements and local regulations. Officers, directors and employees of Scotiabank and its affiliates may serve as directors of corporations.
Any securities discussed in this report may not be suitable for all investors. Scotiabank recommends that investors independently evaluate any issuer and security discussed in this report, and consult with any advisors they deem necessary prior to making any investment.
This report and all information, opinions and conclusions contained in it are protected by copyright. This information may not be reproduced without the prior express written consent of Scotiabank.
™ Trademark of The Bank of Nova Scotia. Used under license, where applicable.
Scotiabank, together with “Global Banking and Markets”, is a marketing name for the global corporate and investment banking and capital markets businesses of The Bank of Nova Scotia and certain of its affiliates in the countries where they operate, including; Scotiabank Europe plc; Scotiabank (Ireland) Designated Activity Company; Scotiabank Inverlat S.A., Institución de Banca Múltiple, Grupo Financiero Scotiabank Inverlat, Scotia Inverlat Casa de Bolsa, S.A. de C.V., Grupo Financiero Scotiabank Inverlat, Scotia Inverlat Derivados S.A. de C.V. – all members of the Scotiabank group and authorized users of the Scotiabank mark. The Bank of Nova Scotia is incorporated in Canada with limited liability and is authorised and regulated by the Office of the Superintendent of Financial Institutions Canada. The Bank of Nova Scotia is authorized by the UK Prudential Regulation Authority and is subject to regulation by the UK Financial Conduct Authority and limited regulation by the UK Prudential Regulation Authority. Details about the extent of The Bank of Nova Scotia's regulation by the UK Prudential Regulation Authority are available from us on request. Scotiabank Europe plc is authorized by the UK Prudential Regulation Authority and regulated by the UK Financial Conduct Authority and the UK Prudential Regulation Authority.
Scotiabank Inverlat, S.A., Scotia Inverlat Casa de Bolsa, S.A. de C.V, Grupo Financiero Scotiabank Inverlat, and Scotia Inverlat Derivados, S.A. de C.V., are each authorized and regulated by the Mexican financial authorities.
Not all products and services are offered in all jurisdictions. Services described are available in jurisdictions where permitted by law.