- Colombia: Imports up in December; economic activity strong at year-end
COLOMBIA: IMPORTS UP IN DECEMBER; ECONOMIC ACTIVITY STRONG AT YEAR-END
I. December’s imports rose 49.9% y/y; trade deficit remains high
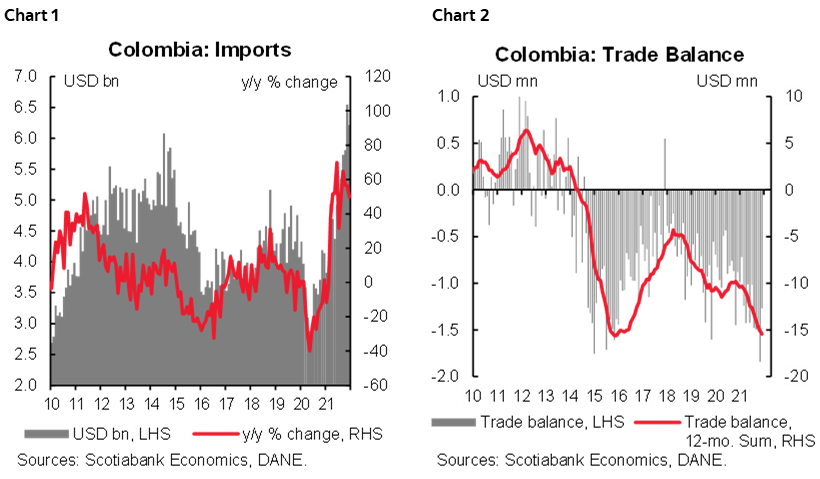
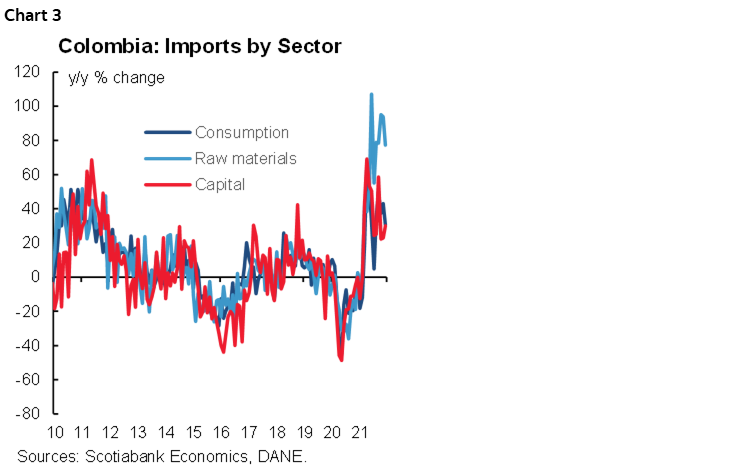
Import data for December’s released by DANE on Monday, February 14, came in at USD 6.21 bn (CIF terms), expanding 49.9% y/y (chart 1), down from November’s level of USD 6.55 bn. The monthly trade deficit stood at USD 1.27 bn, also moderating somewhat from November’s figure (chart 2). The 2021 trade deficit stood at USD 15.42 bn, the widest since 2015.
December’s imports slightly decreased from November mainly on lower durable goods, fuel, and transport equipment purchases. Raw materials for the agricultural sector and non-durable goods imports remained strong. Manufacturing imports grew by 44.5% y/y accounting for the strongest positive contribution to annual imports growth, while agriculture-related imports increased by 51.2% y/y and mining-related imports grew by 137.3% y/y.
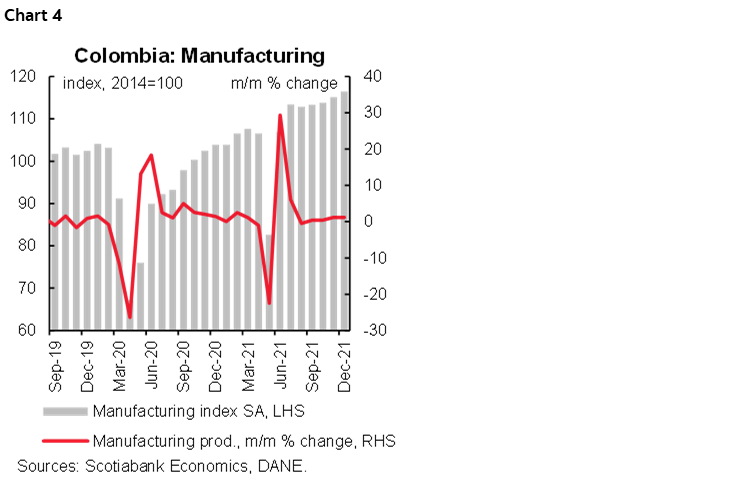
By use, three major segments showed strong increases (chart 3):
- Consumption goods imports increased +30.6% y/y, at USD 1.39 bn; for the year as a whole, imports of consumption goods totaled 13.496 bn USD (+25.9% y/y). Durable goods imports, meanwhile, grew by 42.3% y/y over the year, contributing 64% to the overall increase. By year end, however, durable goods purchases slowed, especially vehicle purchases, reflecting negative effects of international logistic bottlenecks. In contrast, non-durable goods purchases remained strong, especially foodstuffs.
- Raw material imports grew by 77.3% y/y to USD 3.07 bn (USD 30.23 bn, +56.4% y/y, for the year as a whole). Industrial sector input purchases (+69.5% y/y) and fuel imports (+226.2% y/y) moderated from previous months. Agricultural purchases remained strong (+46.6% y/y).
- Capital-goods imports were up 30.1% y/y to USD 1.75 bn in December and USD 17.36 bn (+29.3% y/y) for the year as a whole. Investment goods led the gains in 2021 (+21.3% y/y), followed by transport equipment (+38% y/y). However, by the end of 2021, transport equipment purchases moderated, which should be followed closely to monitor the evolution of investment dynamics.
Imports in 2021 reflect a positive demand effect due to the economic recovery and the effect of higher international prices. Imports also reflects government deficits. Regardless of their source, high imports have widened the trade deficit. Looking ahead, a high current account deficit will likely persist for a while, raising possible financing concerns. In 2022, however, especially after elections, we expect FDI to finance the highest share of this deficit.
II. Economic indicators show a robust close of 2021, while employment remained below pre-pandemic level
DANE also released its monthly economic activity survey for December 2021 on Monday, February 14. Indicators showed better-than-expected results, pointing to a strong end to 2021. Manufacturing and retail sales surprised on the upside, while services and hotels continued to improve. In contrast, employment continues to lag the recovery, especially services-related sectors. DANE will release GDP data for 2021 Q4 on February 15; we expect to affirm our forecast for 2021 of 10.2%, but acknowledge that the balance of risks are skewed to the upside.
Employment
Employment contracted 1.1% relative to 2020 and remains 4.6% below pre-pandemic (2019) levels, with job losses concentrated in the clothing sector (-8.0%) and the vehicles manufacturing sector (-9.0% y/y). The only sector that showed a rebound in the labour force was pharma (+0.3% y/y). Regarding employment by job quality, the main lag is on permanent and direct employment (-2.1% and -7.7 compared to pre-pandemic levels, respectively). Equally worrisome, employment gains in 2021 were concentrated in temporary jobs, which accounted for 73% of job creation in the year, also showing that working hours per worker increased.
Manufacturing Production
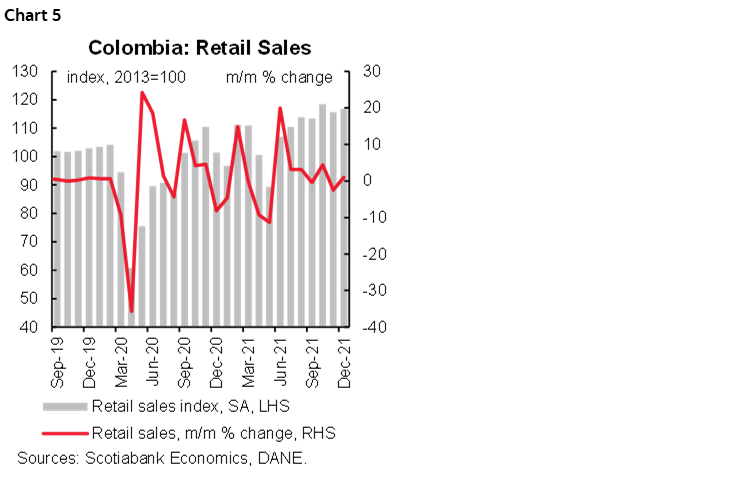
Manufacturing production increased by 13.1% y/y (above the market consensus +9.2%) and 1.2% m/m sa (chart 4). Compared to the pre-pandemic level (December 2019), the index grew by an equally strong 14.8%. All in, manufacturing grew by 15.9% as compared to 2020 and is now 6.6% above pre-pandemic levels (2019). However, manufacturing employment remains down, with employment 3.3% below its 2019 level.
The best performing sectors in 2021 were beverages (+21.6% y/y), clothing (+43.7% y/y), construction-related materials (+43.7% y/y) and oil refining (+14.8% y/y).
In contrast, vehicle production contracted (-19.3% y/y) due to supply bottlenecks in international logistics and microchip production. Food-related industries also contracted, especially in sugar & panela (-6.3% y/y) and milling (-3.6% y/y) due to higher input costs.
The manufacturing sector continues to face a challenging environment in 2022, since higher international input prices and logistical issues impair manufacturing chains, especially during H1-2022. Meanwhile, employment recovery is a critical factor determining the sustainability of the recovery.
Retail Sales
Retail sales expanded in December by 15.9% y/y, above Bloomberg’s survey (+12% y/y); compared to pre-pandemic levels (December 2019), retail sales are now 13% higher (chart 5). For the whole of 2021, retail sales expanded +8.9% as compared to the pre-pandemic (2019) level.
In December, retail sales (excluding other vehicles) expanded by +1.0% m/m, led by the effect of the VAT holiday, which boosted consumption of non-durable goods and electronic devices. However, Colombian households are moderating their consumption of some items, especially foodstuffs, due to the impact of inflation on prices. Moreover, in December a contraction in sales volumes of vehicles for households use (-2.5% y/y) and food (-1.3% y/y), was due to logistical bottlenecks that are reducing supply.
DANE calculated the impact of the VAT holidays and showed that the positive effect on consumption was stronger in December than in November, and October, especially for non-durable and semidurable items.
For all 2021, retail sales expanded 17.8% in annual terms and 8.9% compared to pre-pandemic levels. In 2021 sales of items affected by the reduction in mobility restrictions and in-person activities rebounded the most, with the strongest contributions from vehicle sales (+41.8% y/y), clothing (+49.2% y/y), and electronic devices (+41.3% y/y).
In 2022, we expect a slowdown in household consumption to more healthy expansion rates, though a challenge would come if the impact of the inflation deteriorates further than expected the consumption capacity.
Services & Hotels
While the film making and TV show sector posted the strongest recovery among services sectors in 2021, employment was still below the pre-pandemic level by –37% y/y. Employment also remains under pre-pandemic levels in restaurants (-6.4%), private education (-9.1% y/y) and edition activities (-17.9%).
The hotels sector doubled its income in 2021 compared to 2020, though income was 25% below and employment 37% below pre-pandemic levels. In December 2021, hotel occupancy reached 54.4%, above from December 2019 levels of 49.8%. However, business trips still lag the recovery, and domestic tourism is leading to better performance in the sector.
With activity levels now recovered, pre-pandemic production levels are no longer the relevant benchmark. Instead, sustainability of growth is the key metric, with employment recovery the key for sustainability. And ahead of today’s GDP data, we expect a positive result for 2021 showing a double-digit expansion. However, economic growth is likely to moderate in H1-2022 due to the uncertainty surrounding the elections and also because of the challenging environment with respect to inflation and employment. Accordingly, we estimate that if Colombia’s economic activity repeats the average performance of the previous three months (September–November), economic growth will come in at least 3.6%, confirming our expectation of a 4.5% expansion for 2022.
—Sergio Olarte & Jackeline Piraján
DISCLAIMER
This report has been prepared by Scotiabank Economics as a resource for the clients of Scotiabank. Opinions, estimates and projections contained herein are our own as of the date hereof and are subject to change without notice. The information and opinions contained herein have been compiled or arrived at from sources believed reliable but no representation or warranty, express or implied, is made as to their accuracy or completeness. Neither Scotiabank nor any of its officers, directors, partners, employees or affiliates accepts any liability whatsoever for any direct or consequential loss arising from any use of this report or its contents.
These reports are provided to you for informational purposes only. This report is not, and is not constructed as, an offer to sell or solicitation of any offer to buy any financial instrument, nor shall this report be construed as an opinion as to whether you should enter into any swap or trading strategy involving a swap or any other transaction. The information contained in this report is not intended to be, and does not constitute, a recommendation of a swap or trading strategy involving a swap within the meaning of U.S. Commodity Futures Trading Commission Regulation 23.434 and Appendix A thereto. This material is not intended to be individually tailored to your needs or characteristics and should not be viewed as a “call to action” or suggestion that you enter into a swap or trading strategy involving a swap or any other transaction. Scotiabank may engage in transactions in a manner inconsistent with the views discussed this report and may have positions, or be in the process of acquiring or disposing of positions, referred to in this report.
Scotiabank, its affiliates and any of their respective officers, directors and employees may from time to time take positions in currencies, act as managers, co-managers or underwriters of a public offering or act as principals or agents, deal in, own or act as market makers or advisors, brokers or commercial and/or investment bankers in relation to securities or related derivatives. As a result of these actions, Scotiabank may receive remuneration. All Scotiabank products and services are subject to the terms of applicable agreements and local regulations. Officers, directors and employees of Scotiabank and its affiliates may serve as directors of corporations.
Any securities discussed in this report may not be suitable for all investors. Scotiabank recommends that investors independently evaluate any issuer and security discussed in this report, and consult with any advisors they deem necessary prior to making any investment.
This report and all information, opinions and conclusions contained in it are protected by copyright. This information may not be reproduced without the prior express written consent of Scotiabank.
™ Trademark of The Bank of Nova Scotia. Used under license, where applicable.
Scotiabank, together with “Global Banking and Markets”, is a marketing name for the global corporate and investment banking and capital markets businesses of The Bank of Nova Scotia and certain of its affiliates in the countries where they operate, including; Scotiabank Europe plc; Scotiabank (Ireland) Designated Activity Company; Scotiabank Inverlat S.A., Institución de Banca Múltiple, Grupo Financiero Scotiabank Inverlat, Scotia Inverlat Casa de Bolsa, S.A. de C.V., Grupo Financiero Scotiabank Inverlat, Scotia Inverlat Derivados S.A. de C.V. – all members of the Scotiabank group and authorized users of the Scotiabank mark. The Bank of Nova Scotia is incorporated in Canada with limited liability and is authorised and regulated by the Office of the Superintendent of Financial Institutions Canada. The Bank of Nova Scotia is authorized by the UK Prudential Regulation Authority and is subject to regulation by the UK Financial Conduct Authority and limited regulation by the UK Prudential Regulation Authority. Details about the extent of The Bank of Nova Scotia's regulation by the UK Prudential Regulation Authority are available from us on request. Scotiabank Europe plc is authorized by the UK Prudential Regulation Authority and regulated by the UK Financial Conduct Authority and the UK Prudential Regulation Authority.
Scotiabank Inverlat, S.A., Scotia Inverlat Casa de Bolsa, S.A. de C.V, Grupo Financiero Scotiabank Inverlat, and Scotia Inverlat Derivados, S.A. de C.V., are each authorized and regulated by the Mexican financial authorities.
Not all products and services are offered in all jurisdictions. Services described are available in jurisdictions where permitted by law.