

ON DECK FOR TUESDAY, OCTOBER 13th

KEY TOPICS:
- Bond rally greets Canadians and Americans returning from long weekends
- Canada needs an external review of Statcan’s jobs methodologies
- The BoC should fade jobs, remain focused upon inflation
- Alberta’s advance voting begins; key will be turn-out
- Mixed US bank earnings to start the Q3 line-up
- Light US data: US home resales, weekly ADP
- Global Week Ahead –– Immaculate Disinflation (reminder here)
Canadians and Americans are returning from long weekends to greet rallies across global sovereign bonds that are pushing yields lower everywhere. Lower oil prices are one driver of this, but I don’t think markets are listening and observing to the signs that tensions are likely to boil over again in coming weeks especially after US midterms. One sign is Trump’s constant guidance he won’t escalate before the midterms, ‘before’ being the operative word. Another sign is force movements as well as rising conflict between the Saudis and Houthis.
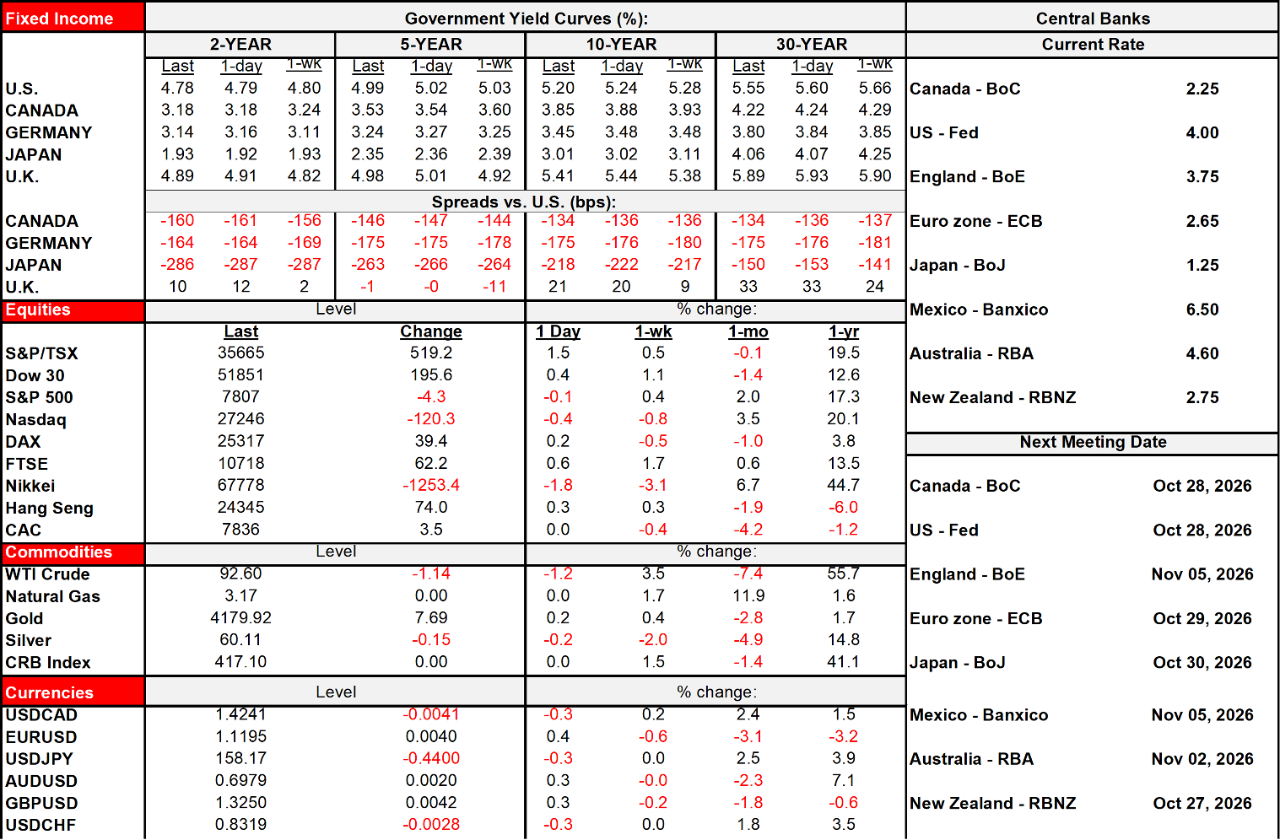
Equities are little changed on balance with lower US futures, higher TSX futures and mixed European cash markets. The dollar is broadly softer against multiple crosses including CAD.
Light global data only offers up US existing home sales during September (10amET) and ADP’s unreliable weekly jobs gauge that registered a four-week moving average w/w gain of about 25k.
MIXED US BANK EARNINGS
Here is a summary of US bank earnings releases this morning (chart 1).
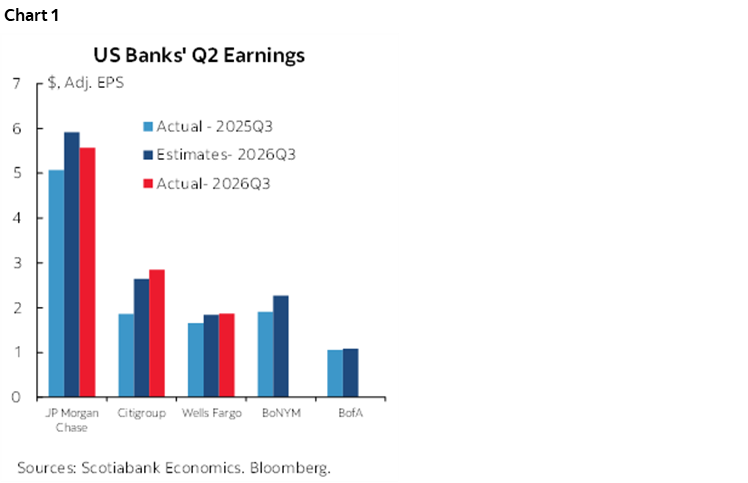
Goldman Sales stomped all over the others and posted a strong beat. Adjusted EPS of US$17.01 beat expectations for $12.82 with both FICC and equity revenues beating expectations.
Citigroup beat expectations with EPS of US$2.85 (consensus $2.65) as FICC revenues beat but equity revenues missed.
JP Morgan missed expectations with adjusted EPS of US$5.57 (consensus $5.92). FICC revenues missed, equity revenues beat.
Wells Fargo underwhelmed with EPS of US$1.87 (consensus $1.86) and a miss on net interest income.
WATCH ALBERTA’S ADVANCE TURNOUT
Advance voting begins today on Alberta’s 10 Questions––key being the one on separation. This piece summarizes them. The rest are dominated by questions on various issues concerning immigration and access to public programs. Key will be turnout figures; as
former Alberta Premier Jason Kenney put it, low turnout under 40% could tip the balance in favour of separatists even though polls show overwhelming opposition to separating and it would make zero sense to do so.
CANADA SHOULD LAUNCH AN EXTERNAL REVIEW OF STATCAN’S LABOUR READINGS
Doves quickly pounced on Canada’s job loss on Friday to boldly declare that does it, no BoC hikes because the world is ending. They’re gullible. They didn’t do their jobs. I’ll offer a different response in addition to the section in my weekly that argued the BoC has strong reason to remain focused upon inflation.
Canada needs better quality job market readings and should follow Australia’s path that launched an independent technical review of its official employment figures in that country’s Labour Force Survey back in 2014 after a series of wonky readings. It was conducted by former ABS statistician Paul McCarthy in 2014. It led to 16 recommendations that were all accepted by the ABS including revised seasonal adjustment methods. It did not settle the issue, however, since about a year later, a former head of the Australian Bureau of Statistics said in October 2015 that the figures “aren’t worth the paper they’re written on, so why are we wasting millions of taxpayers’ money on the survey?” Australia struggled with low-quality job readings for years. In February 2016, former RBA Governor Stevens said “let’s discount them to some extent perhaps for the quality issues.”
BoC Governor Macklem should perhaps roll-out the same quote when he twice comments in Bangkok this week. Ottawa is too cozy, so maybe he’ll defer, but he shouldn’t.
It’s not just that I flat out don’t believe Friday’s job market readings from Statistics Canada as argued here and in my weekly, but I don’t. I just don’t accept that suddenly 70,000 public sector employees lost jobs in September of which 58k were in health and education––not the civil service––and concentrated in Quebec with those two sectors losing 46k jobs. 10% of all Quebec education sector employees lost their jobs in a single month, we’re asked to believe. In an election campaign. The CAQ was smoked in the election results, but presumably not entirely incompetent as to fire off tens of thousands of public sector workers weeks before the vote. While I’m aware of limited nationwide cuts across school boards and hospitals, I’d like a full accounting of the reductions benchmarked to what LFS is telling us and seasonally adjusted; my inclination is to believe that public sector jobs are not the riskiest forms of employment in the country and so why are they among the most volatile? Was it mass labour force exits due to huge numbers of retirements and discouraged workers with reliable data to back that up, a wonky survey, or something else? Whatever the case, I suspect October and onward will bounce back.
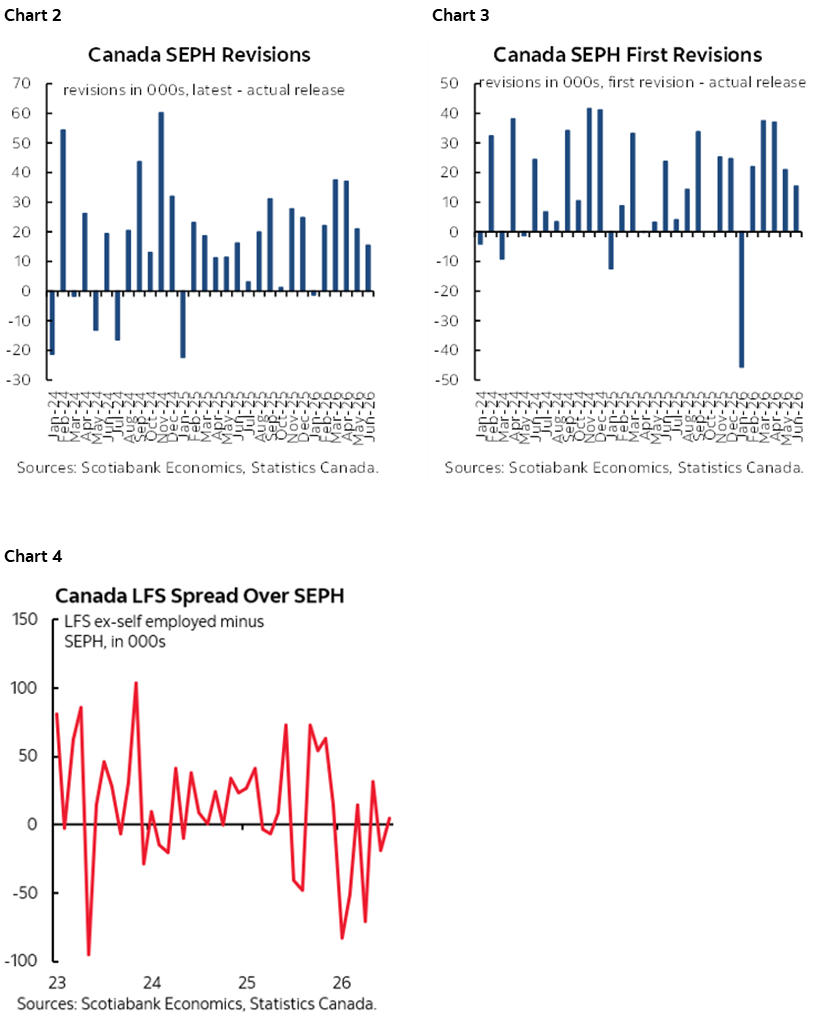
It’s also that the country’s payrolls survey is totally unreliable given large first-pass revisions (chart 2) and final revisions (chart 3) that very frequently number in the tens of thousands of positions each month. What SEPH reports happened to changes in payroll employment and what the LFS reports happened to changes in payroll employment commonly deviate by tens of thousands of jobs per month (chart 4). SEPH is a low-quality report that should be higher quality by relying upon payroll data and that lags LFS by two months––in contrast to simultaneous releases in the US––such that by the time we get the first SEPH reading and then massive revisions it’s too late to be of any use.
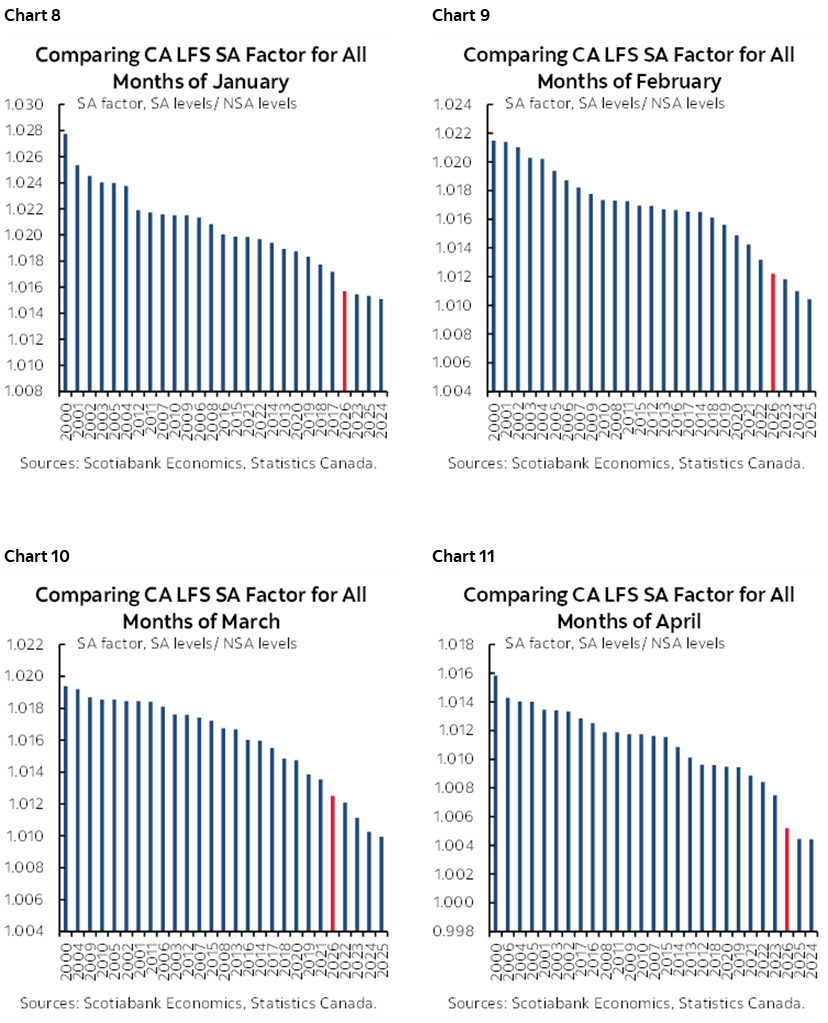
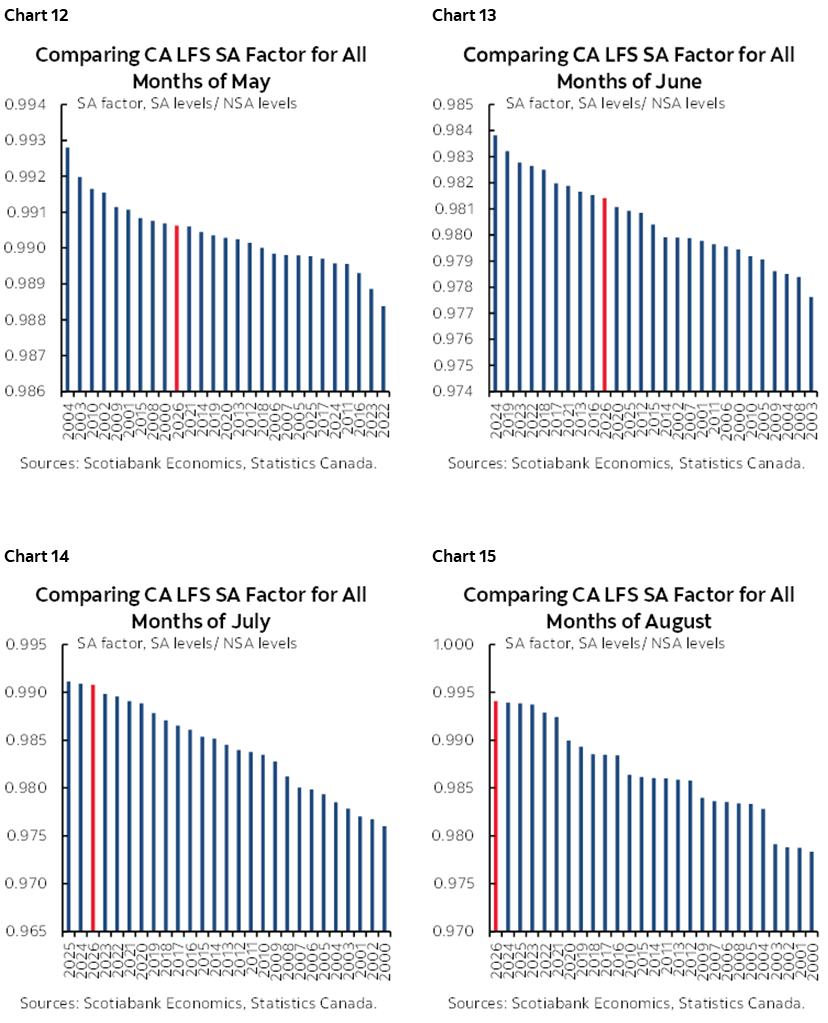
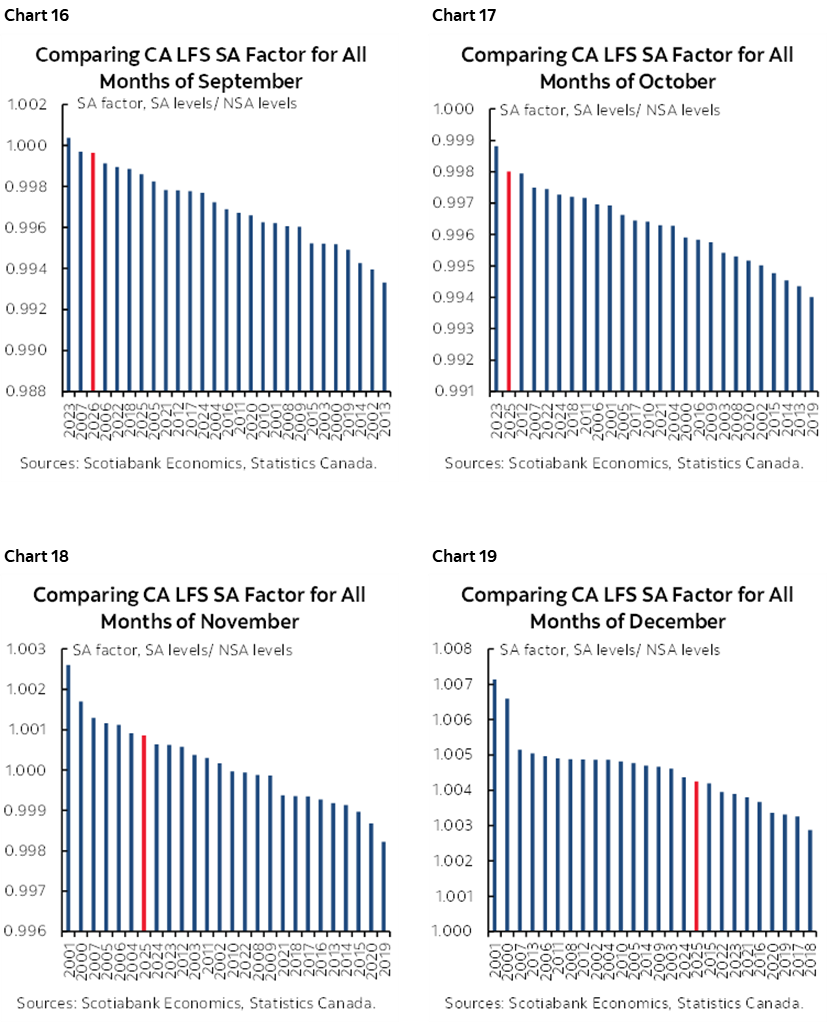
Statcan’s LFS invokes seasonal adjustments that can massively swing the figures because of a recency bias to how they are calculated which might exaggerate shifts in seasonal patterns or take too long to pivot away from sudden shocks like the pandemic’s seasonal distortions. I’ve included a bunch of charts at the back of this note showing this year’s SA factors by month compared to like months in history. Historically low SA factors tend to be used from January through April, then they shift toward the middle, before shifting toward unusually high SA factors over most of the second half of the year.
The six-month panel rotation method should be revisited. That’s the LFS approach that samples the same households over a six-month period of time while only rotating out the first month’s households as a new month’s additions are incorporated.
Response rates remain a challenge as they have yet to recover to pre-pandemic levels. The 2019 response rate of 87% compares against 70–73% rates since then (chart 5). Statcan published an effort to improve response rates about a year ago, allowing more online data collection among other things, but we can’t find a 2026 response rate to date at the time of writing.
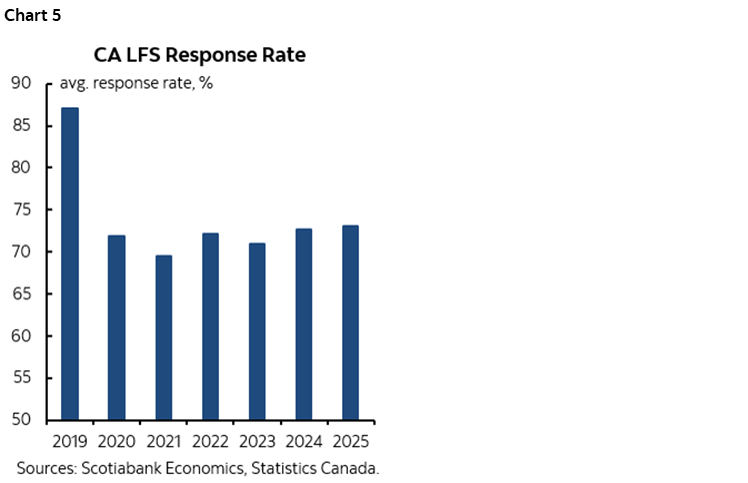
Statcan’s methodology around the temporary residents category applies a smoothed twelve-month rolling average that may be too slow to turn when sudden immigration shifts occur. There have been large revisions to the temps category over recent years (chart 6). Statcan has struggled with meaningful population revisions for several years (chart 7).
Statcan has done audits and reviews in the past, but they’ve lacked full transparency and were conducted by staffers. The nation’s leading, independent experts on labour markets and survey methods should be called upon to do a thorough examination. International experts familiar with debates in places like Australia and now the US given Warsh’s task forces may also be pulled in. A review should not be conducted by the BoC given Ottawa’s tight connections, although going the route of one of the Fed’s five taskforces that looks at data quality and is being led by external experts could be one such model.
If such an external review concluded that everything is about as good as it gets, warts an all, then ok, but healthy scepticism will persist and it’s possible that meaningful suggestions could arise in a way that over time strengthens the public’s confidence in Canadian job market readings.
DISCLAIMER
This report has been prepared by Scotiabank Economics as a resource for the clients of Scotiabank. Opinions, estimates and projections contained herein are our own as of the date hereof and are subject to change without notice. The information and opinions contained herein have been compiled or arrived at from sources believed reliable but no representation or warranty, express or implied, is made as to their accuracy or completeness. Neither Scotiabank nor any of its officers, directors, partners, employees or affiliates accepts any liability whatsoever for any direct or consequential loss arising from any use of this report or its contents.
These reports are provided to you for informational purposes only. This report is not, and is not constructed as, an offer to sell or solicitation of any offer to buy any financial instrument, nor shall this report be construed as an opinion as to whether you should enter into any swap or trading strategy involving a swap or any other transaction. The information contained in this report is not intended to be, and does not constitute, a recommendation of a swap or trading strategy involving a swap within the meaning of U.S. Commodity Futures Trading Commission Regulation 23.434 and Appendix A thereto. This material is not intended to be individually tailored to your needs or characteristics and should not be viewed as a “call to action” or suggestion that you enter into a swap or trading strategy involving a swap or any other transaction. Scotiabank may engage in transactions in a manner inconsistent with the views discussed this report and may have positions, or be in the process of acquiring or disposing of positions, referred to in this report.
Scotiabank, its affiliates and any of their respective officers, directors and employees may from time to time take positions in currencies, act as managers, co-managers or underwriters of a public offering or act as principals or agents, deal in, own or act as market makers or advisors, brokers or commercial and/or investment bankers in relation to securities or related derivatives. As a result of these actions, Scotiabank may receive remuneration. All Scotiabank products and services are subject to the terms of applicable agreements and local regulations. Officers, directors and employees of Scotiabank and its affiliates may serve as directors of corporations.
Any securities discussed in this report may not be suitable for all investors. Scotiabank recommends that investors independently evaluate any issuer and security discussed in this report, and consult with any advisors they deem necessary prior to making any investment.
This report and all information, opinions and conclusions contained in it are protected by copyright. This information may not be reproduced without the prior express written consent of Scotiabank.
™ Trademark of The Bank of Nova Scotia. Used under license, where applicable.
Scotiabank, together with “Global Banking and Markets”, is a marketing name for the global corporate and investment banking and capital markets businesses of The Bank of Nova Scotia and certain of its affiliates in the countries where they operate, including; Scotiabank Europe plc; Scotiabank (Ireland) Designated Activity Company; Scotiabank Inverlat S.A., Institución de Banca Múltiple, Grupo Financiero Scotiabank Inverlat, Scotia Inverlat Casa de Bolsa, S.A. de C.V., Grupo Financiero Scotiabank Inverlat, Scotia Inverlat Derivados S.A. de C.V. – all members of the Scotiabank group and authorized users of the Scotiabank mark. The Bank of Nova Scotia is incorporated in Canada with limited liability and is authorised and regulated by the Office of the Superintendent of Financial Institutions Canada. The Bank of Nova Scotia is authorized by the UK Prudential Regulation Authority and is subject to regulation by the UK Financial Conduct Authority and limited regulation by the UK Prudential Regulation Authority. Details about the extent of The Bank of Nova Scotia's regulation by the UK Prudential Regulation Authority are available from us on request. Scotiabank Europe plc is authorized by the UK Prudential Regulation Authority and regulated by the UK Financial Conduct Authority and the UK Prudential Regulation Authority.
Scotiabank Inverlat, S.A., Scotia Inverlat Casa de Bolsa, S.A. de C.V, Grupo Financiero Scotiabank Inverlat, and Scotia Inverlat Derivados, S.A. de C.V., are each authorized and regulated by the Mexican financial authorities.
Not all products and services are offered in all jurisdictions. Services described are available in jurisdictions where permitted by law.