ON DECK FOR THURSDAY, MAY 21st
KEY POINTS:
- Gyrating oil prices move up, driving mostly cheaper bonds…
- ...with the notable post-jobs exception of Australian yields
- Global PMIs — Slower growth, higher inflation
- FOMC minutes—what surprised, and what headlines missed
- The importance of coming annual benchmarking revisions to nonfarm payrolls
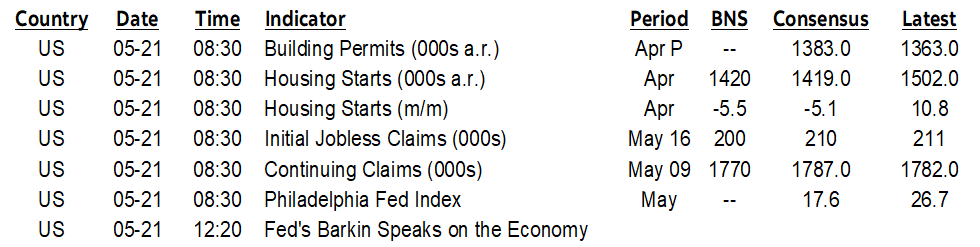
- US claims stable, housing starts slipped and the Philly Fed gauge fell
Oil remains on a rollercoaster ride. Prices are up by about 2% this morning. That’s contributing to robot trading that is putting mild upward pressure on sovereign yields, but we’re only talking about 1–4bps across western benchmarks while Antipodean yields fell sharply after Aussie jobs (see below). Canada’s curve is slightly outperforming after a weak CFIB small business confidence reading accompanied by ongoing plans to raise prices above the top end of the BoC’s 1–3% inflation target range. The A$ is among the weakest crosses within broad US strength. Equities are in the red across N.A. futures and European cash.
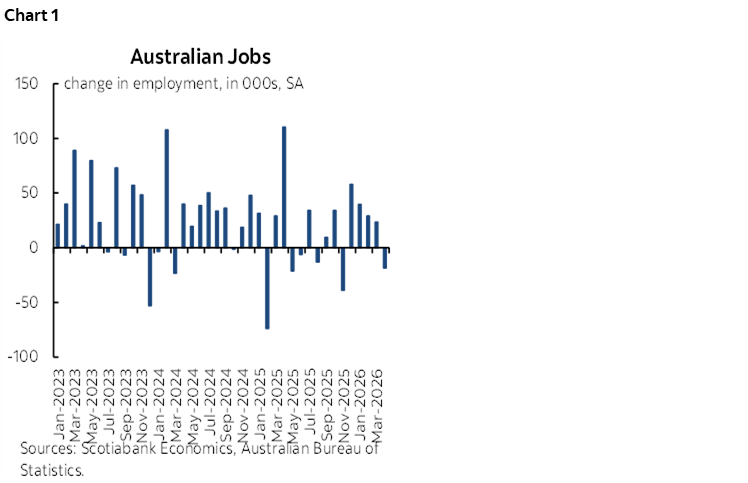
AUSTRALIAN RATES DROP AS JOB MARKET WEAKENS
Australia lost 18,600 jobs in April with a mixture between -10,700 lost full-time jobs and -7,900 lost part-time jobs. Fewer people counted themselves in the workforce as either employed or seeking employment as the participation rate slipped by a tenth to 66.7%. The unemployment rate edged up two-tenths to 4.5%. There were small positive revisions to March (23.3k jobs instead of 17.9k) due to higher full-time job revisions. Year-to-date employment is still up by 73k.
It was the first drop after four consecutive monthly gains in employment (chart 1) which makes the market reaction a bit overdone in my view. Aussie 2s rallied by about 9bps overnight.
GLOBAL PMIS — WEAKER GROWTH, HIGHER INFLATION
Global purchasing managers’ indices decelerated everywhere except India that remains in steady expansion, and Germany an unchanged pace of contraction (charts 2, 3). Softer growth reflects combinations of prior order front-running ahead of expected price increases, the effects of the war with Iran and a mixture of other idiosyncratic factors such as UK political instability and policy concerns. Inflation’s acceleration was a common theme across markets.
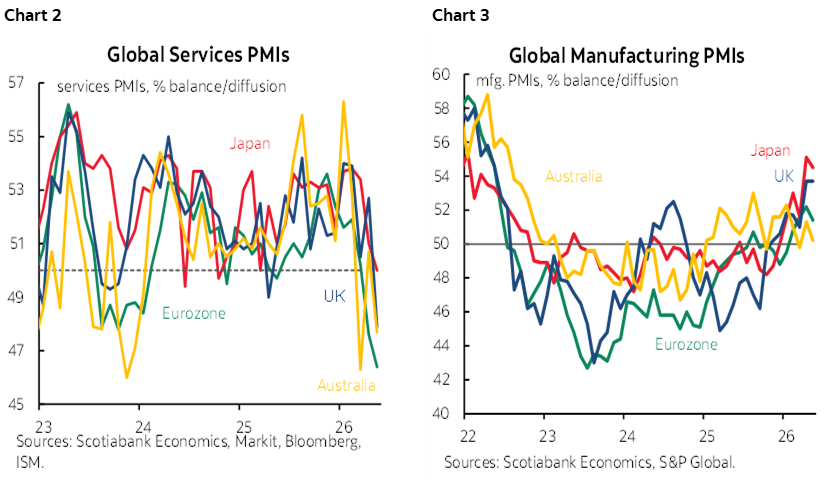
- Australia’s composite PMI fell by 2.6 points to 47.8 which puts it into sub-50 contraction territory for the economy. That was mostly due to services (47.7 from 50.7) as manufacturing edged 1.1 points lower to 50.2. S&P indicated that new orders declined at the quickest pace since September 2021 but parsing what happened to prices is made difficult by an unclear write-up.
- Japan’s composite PMI slipped by 1.1 points to 51.5 with services decelerating to 50.0 from 51.0 and manufacturing easing (54.5, 55.1). Details noted that selling prices climbed at the fastest pace ever.
- The UK composite PMI fell by 4.1 points to 48.5 and entirely due to a drop in services (47.9, 52.7 prior) as manufacturing remained in steady expansion (53.7). The report indicated that prices continue to surge, led by manufacturers driving the fastest output price increases since July 2022.
- The Eurozone composite PMI fell by 1.3 points to 47.5 and remains in contraction as both services (46.4, 47.6 prior) and manufacturing (51.4, 52.2 prior) retreated. Details point to accelerating prices, as output prices for combined goods and services climbed at the fastest pace in 38 months.
- Within the Eurozone, we only get a breakout for Germany and France, and it was France that shattered the wine glass. France’s composite PMI fell by 4.1 points to 43.5 and hence deeply into contraction as both services (42.9, 46.5 prior) and manufacturing (48.9, 52.8 prior) retreated.
- Germany, however, held steady, with a composite PMI of 48.6 (48.4 prior) as a deceleration in manufacturing (49.9, 51.4 prior) offset a pick-up in services (47.8, 46.9 prior) that nevertheless had both sectors slightly contracting.
- India’s composite PMI held steady in solid growth territory (58.1, 58.2 prior) as both services (58.9, 58.8 prior) and manufacturing (58.1, 58.2 prior) held up. Here the inflation story is one of absorbing some of the pressures in margins as output prices reportedly climbed at the softest pace since January before the war broke out.
The US will release its version of the PMIs this morning (9:45amET) so we’ll see if they follow the general global pattern of softer growth and higher inflation. Before we get to that, the US will update weekly jobless claims (8:30amET) and housing starts in April (8:30amET).
Canada’s calendar is quiet today. S&P doesn’t update its Canadian PMIs until June 1st.
FOMC MINUTES — WHAT SURPRISED, WHAT COULD YET SURPRISE
In the wake of yesterday’s FOMC minutes, markets are still pricing the next move to be up but not for a while. There hasn’t really been much of a reaction to the minutes despite a generally more hawkish feel, and that’s perhaps because markets were already leaning in that direction. October is 50–50, the chance at a hike by December is priced at about 20bps of a quarter point, and then early next year clings to a quarter point and part of another hike.
The part of the minutes that surprised this passage:
“A majority of participants highlighted, however, that some policy firming would likely become appropriate if inflation were to continue to run persistently above 2 percent. To address this possibility, many participants indicated that they would have preferred removing the language from the postmeeting statement that suggested an easing bias regarding the likely direction of the Committee’s future interest rate decisions. Participants noted that monetary policy was not on a preset course and that future policy decisions would be made on a meeting-by-meeting basis.”
The surprising part to me was that “many” preferred to strike out the statement line “In considering the extent and timing of additional adjustments to the target range for the federal funds rate…” which is the bias that still leaned toward further easing. We knew there were three voting dissenters who preferred doing so (Logan, Kashkari, Hammack) and one nonvoting member (Collins) who revealed her stance afterward, but that should have resulted in a reference to “some” or “several” or maybe even “a few.” Clearly there were some silent opposers who plugged their noses and then kept quiet about it after the communications blackout lifted.
That fed the “majority” who—very conditionally—said they would lean toward hiking if inflation “persistently” exceeded the target. And so we’re left with assessing how they define “persistently” which is back to the whole temporary or permanent debate on inflation risk stemming from pre-war and war influences. Regardless, on inflation risk, the knives have been drawn on incoming Chair Warsh.
As far as the other side of the dual mandate is concerned, “most” participants noted that “risks to the employment side of the Committee’s dual mandate were tilted to the downside.” On where the balance lies, the minutes noted “both upside risks to inflation and downside risks to employment remained elevated” and “participants generally observed that the conflict in the Middle East could have significant implications for the balance of these risks and for the appropriate path of monetary policy.”
That latter part didn’t get splashed on newswire screens like Bloomberg. Yet it’s critically important.
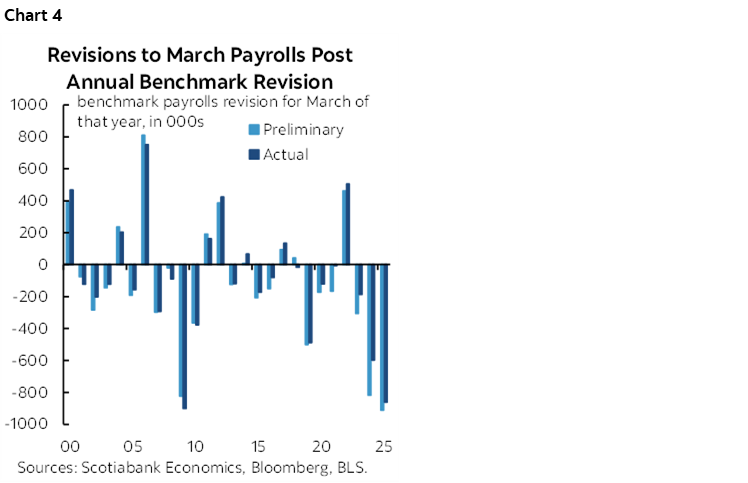
ANNUAL NONFARM REVISIONS WILL HIT JUST BEFORE THE SEPTEMBER FOMC
In fact, bear in mind that we’re probably dealing with overstated job gains and will find out by how much when the preliminary annual benchmarking revisions arrive in September, likely about one week before the September FOMC meeting.
The past couple of years have seen blow outs in terms of negative revisions (chart 4). Last year’s revisions that apply to March payroll levels and prior months stretching back to the prior April took monthly payrolls down by an average of about 70k. This time around, it would take monthly average revisions of about -60k over April 2025 to March 2026 in this September’s revisions to wipe out 2026Q1 nonfarm payroll gains.
Chair Powell used to say he thought monthly negative revisions this time would be around –60k. He stopped repeating this a few press conferences ago. Yet if this were to happen, then chart 5 shows that payrolls would go from a tepid trend to a clear downward trend.
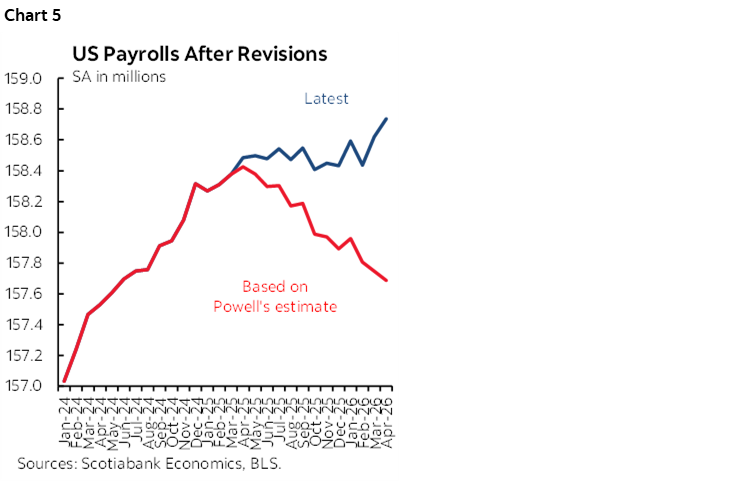
The FOMC would face a real policy conundrum in that context with probably rising inflation and probably negative payroll revisions alongside what may be weak hiring as the shock effects ripple through the labour market over coming months and quarters.
We don’t have much ability to assess the potential size of this year’s benchmarking payroll revisions since its based off quarterly state level data that lags and that is heavily subject to its own revisions. Further, the BLS has tweaked some of its methodologies.
Yet if material negative revisions land right before the September FOMC then there is the potential to restore greater balance between upside risk to inflation and downside risk to jobs that may mean a more cautious Committee regarding which direction to lean toward.
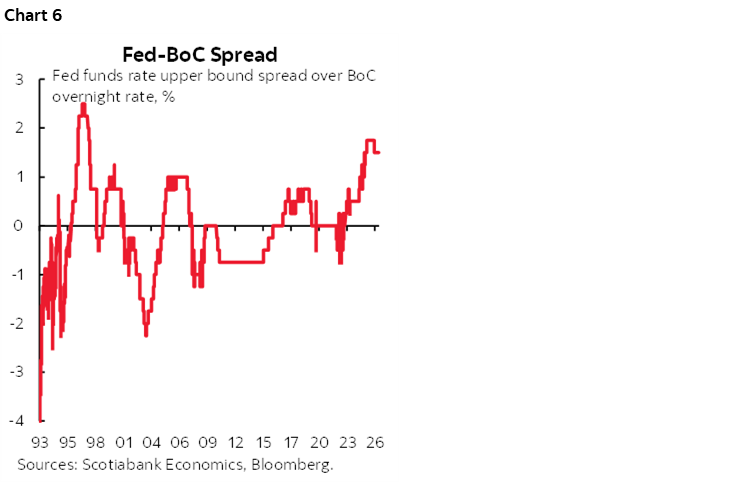
As for spillover effects, should the Fed truly move toward hiking, then presumably to make it worthwhile we’d be talking a minimum of 50bps and perhaps more. If that were to happen, the Fed versus BoC spread would hit new wides (chart 6). The currency implications combined with the cover of the Fed tightening could further raise the risk of BoC tightening. We’re nowhere near such a connection until we see what the Fed does, but bear it in mind as an additional argument potentially affecting the BoC.
US CLAIMS STEADY, HOUSING STARTS SLIPPED
Other minor data this morning included US initial jobless claims that held steady at 209k last week while continuing jobless claims also held steady at 1.782 million.
Housing starts slipped by 2.8% m/m SA in April (consensus –5.3%).
Also, the Philly Fed’s regional manufacturing gauge ebbed to –0.4 in May from 26.7, indicating a reversal of the prior month’s expansion. Order front-running ahead of expected price increases may have become exhausted.
DISCLAIMER
This report has been prepared by Scotiabank Economics as a resource for the clients of Scotiabank. Opinions, estimates and projections contained herein are our own as of the date hereof and are subject to change without notice. The information and opinions contained herein have been compiled or arrived at from sources believed reliable but no representation or warranty, express or implied, is made as to their accuracy or completeness. Neither Scotiabank nor any of its officers, directors, partners, employees or affiliates accepts any liability whatsoever for any direct or consequential loss arising from any use of this report or its contents.
These reports are provided to you for informational purposes only. This report is not, and is not constructed as, an offer to sell or solicitation of any offer to buy any financial instrument, nor shall this report be construed as an opinion as to whether you should enter into any swap or trading strategy involving a swap or any other transaction. The information contained in this report is not intended to be, and does not constitute, a recommendation of a swap or trading strategy involving a swap within the meaning of U.S. Commodity Futures Trading Commission Regulation 23.434 and Appendix A thereto. This material is not intended to be individually tailored to your needs or characteristics and should not be viewed as a “call to action” or suggestion that you enter into a swap or trading strategy involving a swap or any other transaction. Scotiabank may engage in transactions in a manner inconsistent with the views discussed this report and may have positions, or be in the process of acquiring or disposing of positions, referred to in this report.
Scotiabank, its affiliates and any of their respective officers, directors and employees may from time to time take positions in currencies, act as managers, co-managers or underwriters of a public offering or act as principals or agents, deal in, own or act as market makers or advisors, brokers or commercial and/or investment bankers in relation to securities or related derivatives. As a result of these actions, Scotiabank may receive remuneration. All Scotiabank products and services are subject to the terms of applicable agreements and local regulations. Officers, directors and employees of Scotiabank and its affiliates may serve as directors of corporations.
Any securities discussed in this report may not be suitable for all investors. Scotiabank recommends that investors independently evaluate any issuer and security discussed in this report, and consult with any advisors they deem necessary prior to making any investment.
This report and all information, opinions and conclusions contained in it are protected by copyright. This information may not be reproduced without the prior express written consent of Scotiabank.
™ Trademark of The Bank of Nova Scotia. Used under license, where applicable.
Scotiabank, together with “Global Banking and Markets”, is a marketing name for the global corporate and investment banking and capital markets businesses of The Bank of Nova Scotia and certain of its affiliates in the countries where they operate, including; Scotiabank Europe plc; Scotiabank (Ireland) Designated Activity Company; Scotiabank Inverlat S.A., Institución de Banca Múltiple, Grupo Financiero Scotiabank Inverlat, Scotia Inverlat Casa de Bolsa, S.A. de C.V., Grupo Financiero Scotiabank Inverlat, Scotia Inverlat Derivados S.A. de C.V. – all members of the Scotiabank group and authorized users of the Scotiabank mark. The Bank of Nova Scotia is incorporated in Canada with limited liability and is authorised and regulated by the Office of the Superintendent of Financial Institutions Canada. The Bank of Nova Scotia is authorized by the UK Prudential Regulation Authority and is subject to regulation by the UK Financial Conduct Authority and limited regulation by the UK Prudential Regulation Authority. Details about the extent of The Bank of Nova Scotia's regulation by the UK Prudential Regulation Authority are available from us on request. Scotiabank Europe plc is authorized by the UK Prudential Regulation Authority and regulated by the UK Financial Conduct Authority and the UK Prudential Regulation Authority.
Scotiabank Inverlat, S.A., Scotia Inverlat Casa de Bolsa, S.A. de C.V, Grupo Financiero Scotiabank Inverlat, and Scotia Inverlat Derivados, S.A. de C.V., are each authorized and regulated by the Mexican financial authorities.
Not all products and services are offered in all jurisdictions. Services described are available in jurisdictions where permitted by law.