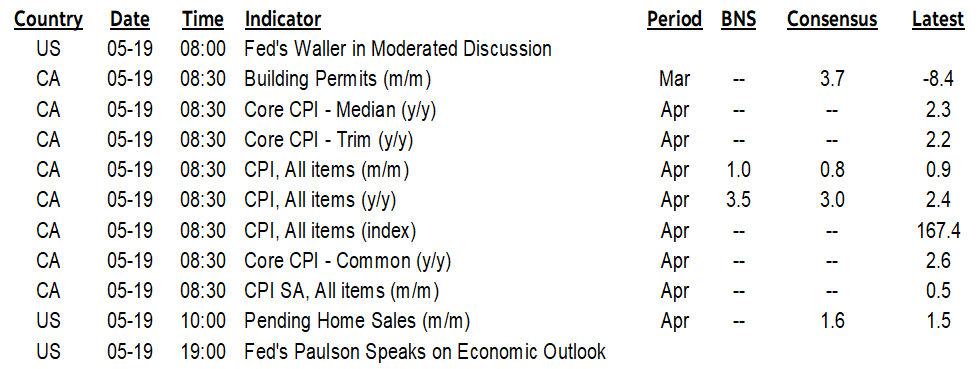
ON DECK FOR TUESDAY, MAY 19th
KEY POINTS:
- Oil’s two-day rise on Iran fears continues to drive higher bond yields
- Canadian CPI due shortly
- Why the BoE should ignore UK payrolls
- Japan’s economy outperformed with an asterisk
- Global Week Ahead — Joined at the Hip (reminder here)
Oil prices are gyrating between yesterday's increase after tough talk from Trump over the weekend and today's slight pullback after Trump said he held off on launching additional attacks on Iran following appeals from Gulf states. The net effect is that oil prices have been higher since Friday and this reflects the general perception that there is no traction in negotiations. Nor should any progress be expected in what is likely to be a stalemate. To me, the main signal from developments since the weekend is that the risk of renewed conflict remains material and both sides have dug in such that the commodities shock will persist.
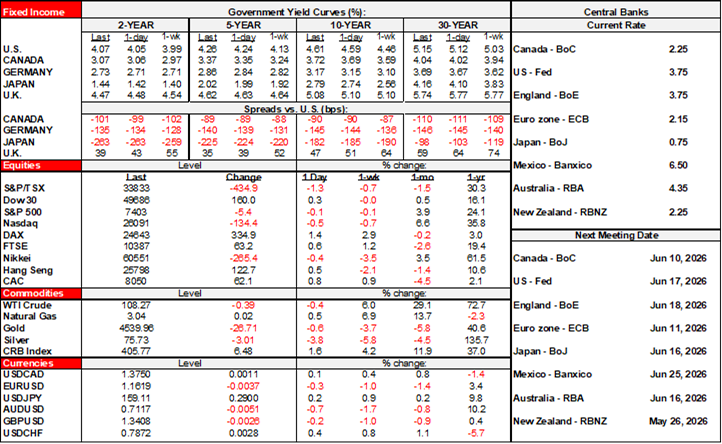
All of which is why bonds continue to cheapen. The US Treasury curve is up by 2–3bps across maturities in a slight bear flattener. Gilts are slightly outperforming after mixed job market readings and even that may be an overreaction (see below). EGB yields are higher by about 2bps across everywhere and anything. US equity futures are down by about ½% (¾% for the Nasdaq) with the TSX up by over ¼% –½% and European equities are gaining by up to 1½%. Currencies are broadly lower to the USD with slight outperformance by the petro-aligned crosses.
CANADIAN INFLATION—LOOK BENEATH THE HEADLINE
CPI for April lands this morning (8:30amET). See my weekly that was sent on Friday for a full preview that I won’t repeat here given that we get the numbers shortly.
Briefly, I've estimated a 1% m/m NSA rise with consensus at 0.7% and with a range from 0.6–1.0% but the consensus is somewhat thin. There is a reasonable range from 0.5–1.0%. You would get the bottom of that range solely on gas and average seasonality. Then layer on several other drivers that I wrote about.
Key may be breadth and whether the trimmed mean and weighted median CPI gauges continue to build traction in m/m SAAR terms after a prior soft patch (chart 1).
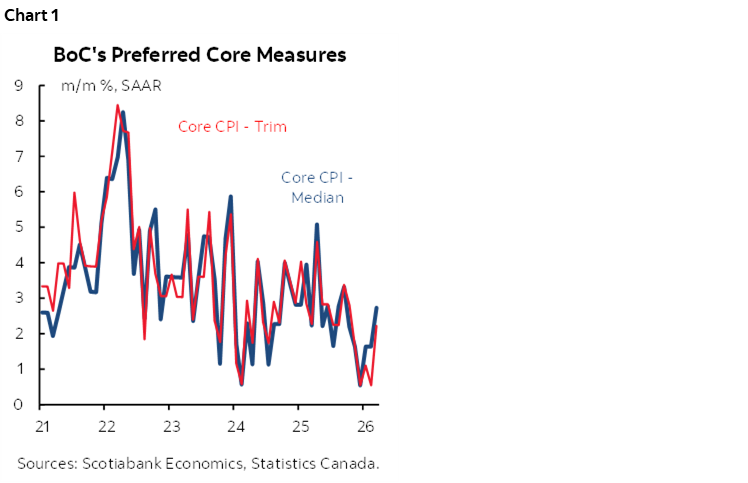
Recall that the BoC's hawkish scenario in the April MPR that was predicated on higher for longer oil prices is getting a boost from higher for longer oil prices.
UK LABOUR MARKET—MIXED REVIEWS
UK markets paid more attention to the sticker shock of a drop in payrolls that may be low quality while ignoring total employment gains. Still, decelerating wage gains reinforce a cautious picture for the Bank of England in terms of passthrough concerns. I would think the bigger issue for the BoE is the tightened financial conditions as the 10-year gilt has moved up by about 85bps since the Iran war.
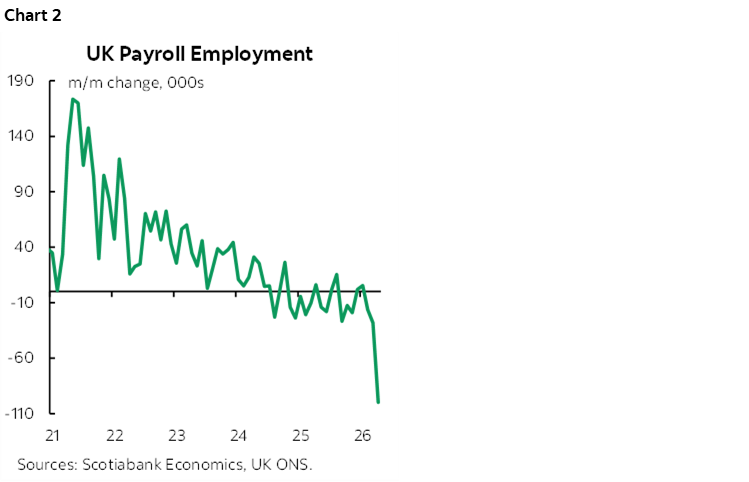
- Payroll jobs fell by 100k m/m in April. That's the worst reading since the start of the pandemic (chart 2). The Office of National Statistics warned, however, that incomplete data from this year's tax season could drive larger than normal revisions presumably in either direction. Here’s what they said: “Early months in the tax year typically carry a greater degree of uncertainty in their initial estimates, and such estimates in recent years have received larger-than-average upward revisions.”
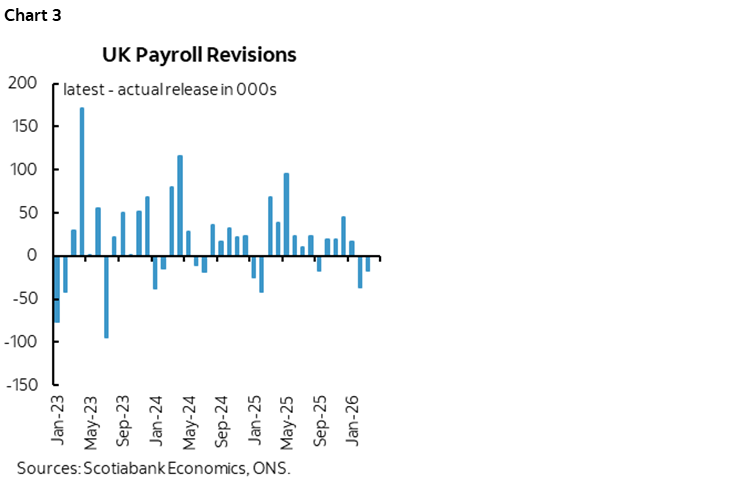
- As a case in point, the first few months of last year saw large and generally positive revisions to payrolls as shown in chart 3.
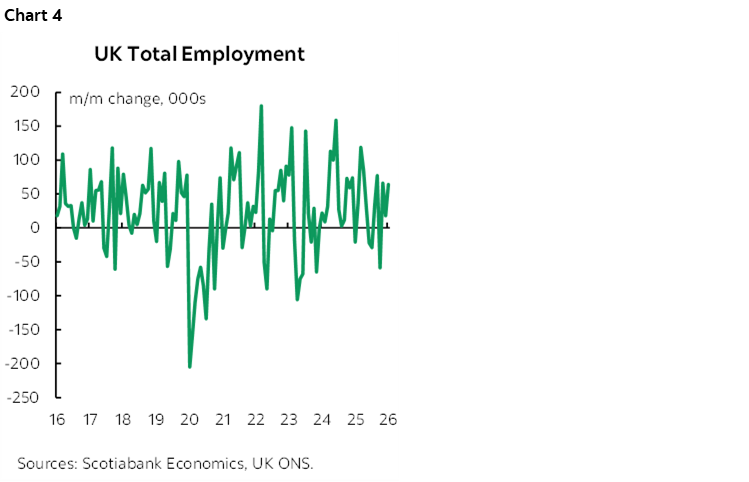
- Total employment was up by 64k m/m in March (chart 4). It was up by 148k year-to-date.
- The unemployment rate edged up to 5%.
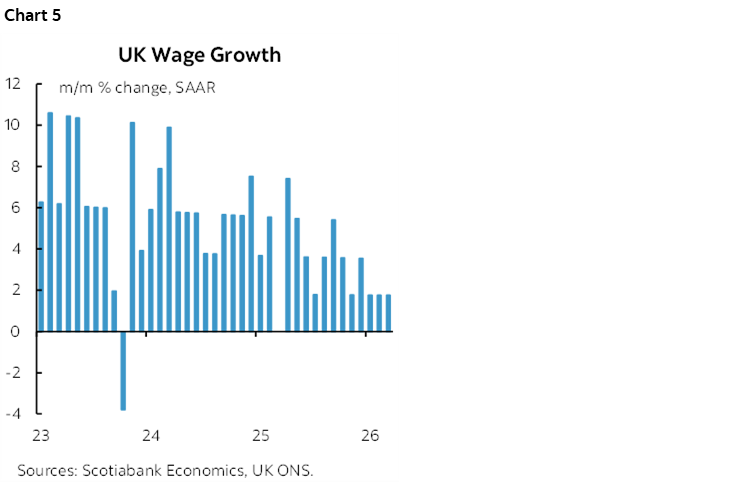
- Wage growth held at 1¾% m/m SAAR for the third month in a row as prior pressures eased (chart 5).
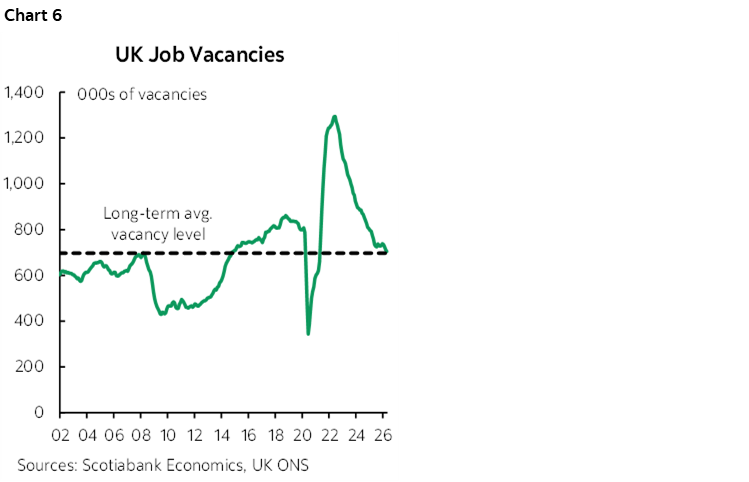
- Job vacancies edged a touch lower and are roughly at the long-term average (chart 6).
JAPAN'S ECONOMY OUTPERFORMED
Japanese Q1 GDP is somewhat of an artefact before the effects of an oil shock on the net importer. Still, it was doing better than expected in the early stages of the Iran war. Q1 GDP was up by 2.1% q/q SAAR (1.7% consensus) but the beat was significantly due to a downward revision to Q4 (0.8% from 1.3%). Still, consumer spending and net exports drove the Q1 beat.
DISCLAIMER
This report has been prepared by Scotiabank Economics as a resource for the clients of Scotiabank. Opinions, estimates and projections contained herein are our own as of the date hereof and are subject to change without notice. The information and opinions contained herein have been compiled or arrived at from sources believed reliable but no representation or warranty, express or implied, is made as to their accuracy or completeness. Neither Scotiabank nor any of its officers, directors, partners, employees or affiliates accepts any liability whatsoever for any direct or consequential loss arising from any use of this report or its contents.
These reports are provided to you for informational purposes only. This report is not, and is not constructed as, an offer to sell or solicitation of any offer to buy any financial instrument, nor shall this report be construed as an opinion as to whether you should enter into any swap or trading strategy involving a swap or any other transaction. The information contained in this report is not intended to be, and does not constitute, a recommendation of a swap or trading strategy involving a swap within the meaning of U.S. Commodity Futures Trading Commission Regulation 23.434 and Appendix A thereto. This material is not intended to be individually tailored to your needs or characteristics and should not be viewed as a “call to action” or suggestion that you enter into a swap or trading strategy involving a swap or any other transaction. Scotiabank may engage in transactions in a manner inconsistent with the views discussed this report and may have positions, or be in the process of acquiring or disposing of positions, referred to in this report.
Scotiabank, its affiliates and any of their respective officers, directors and employees may from time to time take positions in currencies, act as managers, co-managers or underwriters of a public offering or act as principals or agents, deal in, own or act as market makers or advisors, brokers or commercial and/or investment bankers in relation to securities or related derivatives. As a result of these actions, Scotiabank may receive remuneration. All Scotiabank products and services are subject to the terms of applicable agreements and local regulations. Officers, directors and employees of Scotiabank and its affiliates may serve as directors of corporations.
Any securities discussed in this report may not be suitable for all investors. Scotiabank recommends that investors independently evaluate any issuer and security discussed in this report, and consult with any advisors they deem necessary prior to making any investment.
This report and all information, opinions and conclusions contained in it are protected by copyright. This information may not be reproduced without the prior express written consent of Scotiabank.
™ Trademark of The Bank of Nova Scotia. Used under license, where applicable.
Scotiabank, together with “Global Banking and Markets”, is a marketing name for the global corporate and investment banking and capital markets businesses of The Bank of Nova Scotia and certain of its affiliates in the countries where they operate, including; Scotiabank Europe plc; Scotiabank (Ireland) Designated Activity Company; Scotiabank Inverlat S.A., Institución de Banca Múltiple, Grupo Financiero Scotiabank Inverlat, Scotia Inverlat Casa de Bolsa, S.A. de C.V., Grupo Financiero Scotiabank Inverlat, Scotia Inverlat Derivados S.A. de C.V. – all members of the Scotiabank group and authorized users of the Scotiabank mark. The Bank of Nova Scotia is incorporated in Canada with limited liability and is authorised and regulated by the Office of the Superintendent of Financial Institutions Canada. The Bank of Nova Scotia is authorized by the UK Prudential Regulation Authority and is subject to regulation by the UK Financial Conduct Authority and limited regulation by the UK Prudential Regulation Authority. Details about the extent of The Bank of Nova Scotia's regulation by the UK Prudential Regulation Authority are available from us on request. Scotiabank Europe plc is authorized by the UK Prudential Regulation Authority and regulated by the UK Financial Conduct Authority and the UK Prudential Regulation Authority.
Scotiabank Inverlat, S.A., Scotia Inverlat Casa de Bolsa, S.A. de C.V, Grupo Financiero Scotiabank Inverlat, and Scotia Inverlat Derivados, S.A. de C.V., are each authorized and regulated by the Mexican financial authorities.
Not all products and services are offered in all jurisdictions. Services described are available in jurisdictions where permitted by law.