ON DECK FOR FRIDAY, MARCH 6th
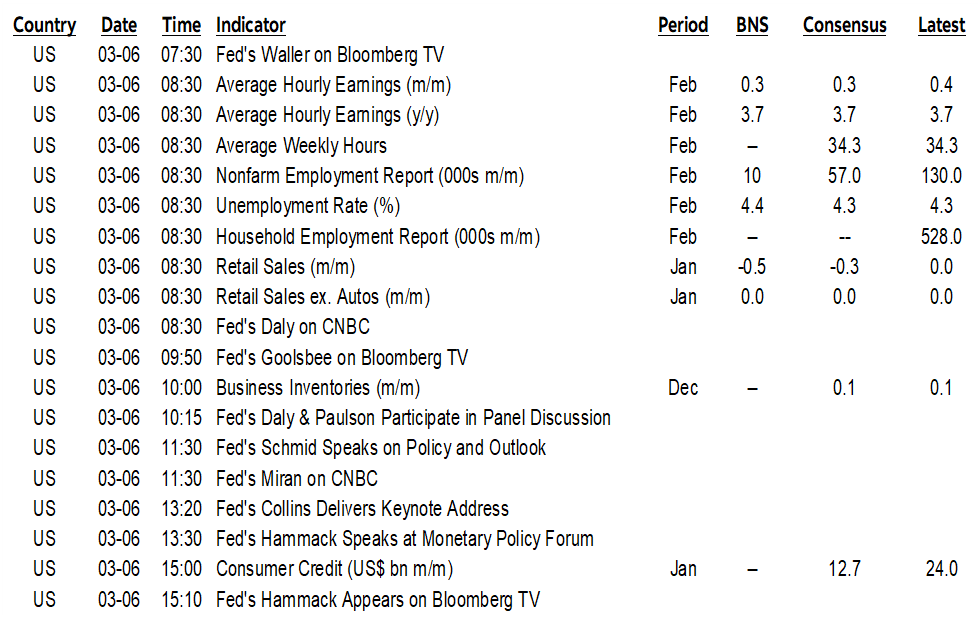
KEY POINTS:
- War’s effects and nonfarm expectations are driving bonds and equities lower
- Nonfarm preview—will health hiring tank after a record January?
- Key are the timing and gyrations of flu cases and health hiring this season
- Remember January’s drop in the US unemployment rate? Well, watch for major revisions to January’s US household survey today.
- US retail sales—upside to a stale consensus?
- FOMC officials to react to nonfarm
Alrighty we’ve got a cage match lined up for you this morning with Iran and the single most important macro indicator in the world competing for the market’s affections.
So far, Iran is winning at least judged by market effects. Oil is up a few bucks again with WTI at about US$84 and Brent at $87. Stocks are broadly lower with US and Canadian futures down about -½% and European cash markets down by a little more. Sovereign bond yields are up by a few points across curves with gilts underperforming by the most as BoE cut expectations get repriced over multiple future meetings. The dollar is firmer except against CAD and a couple of lesser plays. Gold is doing nothing.
NONFARM PAYROLLS PREVIEW
My nonfarm preview is available here as part of my weekly. It was very deliberately called ‘a sick call’ since the only thing that blew my zero call in January was a gusher of hiring in the health care sector specifically in jobs related to looking after the unusual timing and magnitude of respiratory virus cases this year. I expect that to reverse and went over the timing of related hiring in relation to the different timing and peaks of flu cases this year compared to prior years. Other arguments and drivers were also explored.
Chart 1 shows the timing and peaks of flu cases in the US; this year started a little slower than others but dramatically picked up into December and January and then fell off faster than most years.
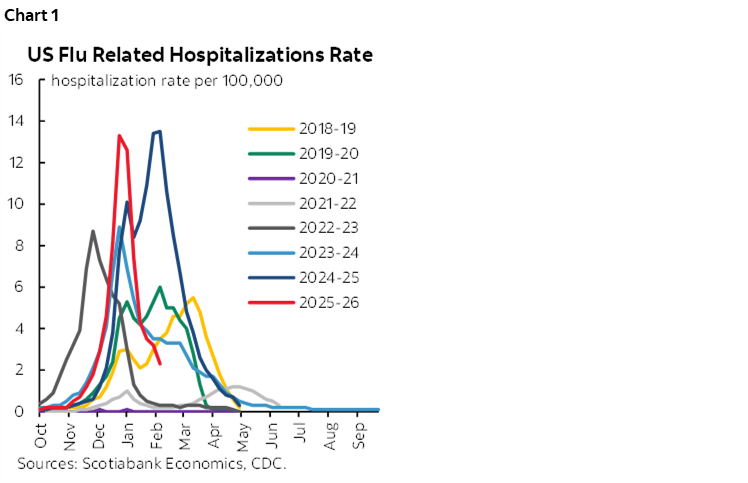
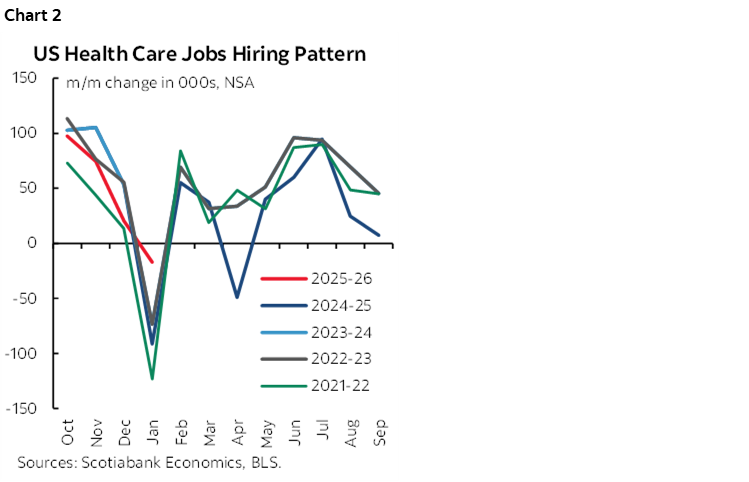
Chart 2 shows the pattern of health sector hiring year-by-year. It started high and then in January—when normally hiring is ebbing—it did so by much less than seasonally normal. Apply seasonal adjustments to the figures and January was a massive overshoot of health sector hiring in categories related to the sick season and the only major reason why nonfarm payrolls overshot estimates in January.
Another way of showing it is through charts 3–6 that track health hiring in seasonally unadjusted terms by month comparing like months across history. October and November started off relatively high in 2025 compared to past like months in history, then subsided in December before it was all hands on deck as workers were called in to deal with the massive surge of sickies.
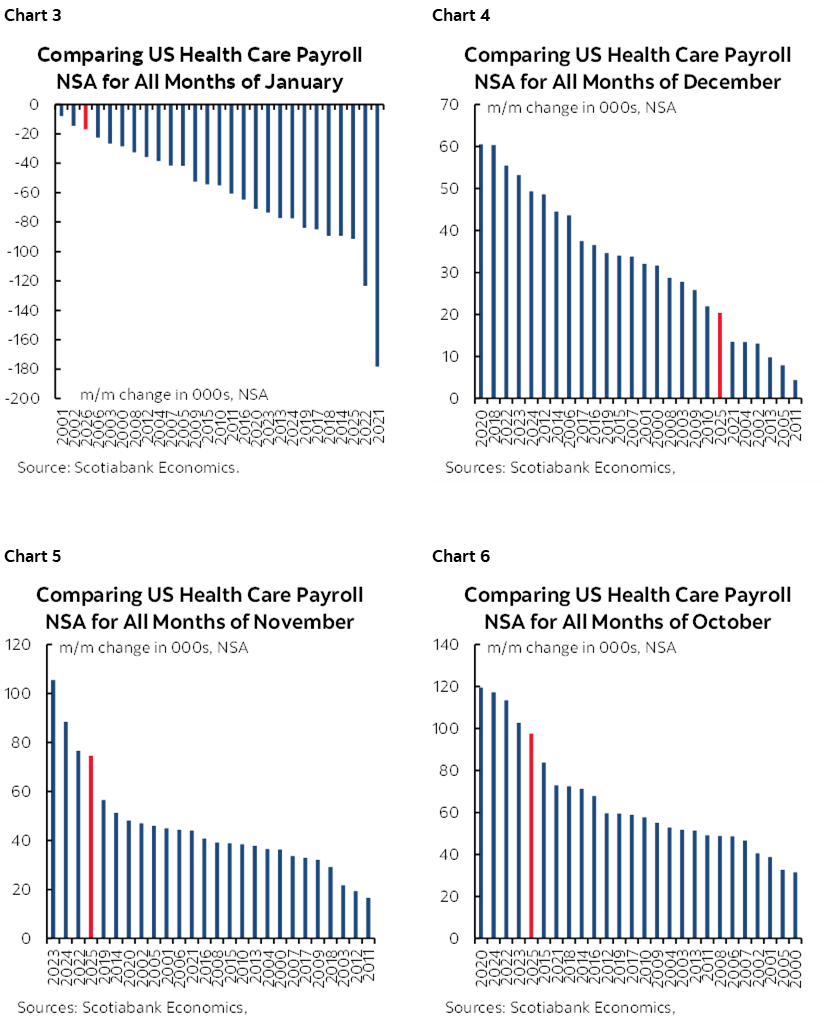
There are other parts of the call that were explored in my fuller preview, but a key one is that health sector hiring hit an all-time record for a month of January in seasonally adjusted terms and that’s expected to revert lower in February.
We learned nothing more to inform the call from the labour market readings we got this week. ADP? Pffft. At best it gives you probabilities of major surprises
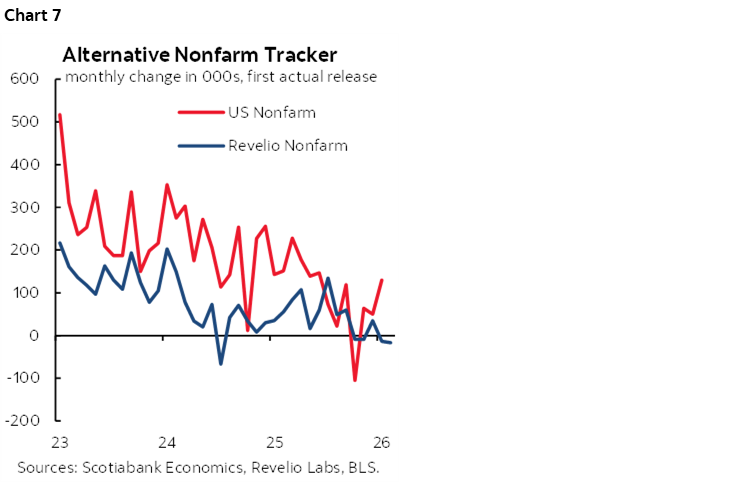
The dip by Revelio’s nonfarm proxy? Be careful with this gauge; it lines up ok after both it and nonfarm get revised a million times, but not at all on the first estimates (chart 7). It’s the same issue with ADP btw as you need to look at the initial ADP readings lined up with initial private nonfarm.
ISM employment gauges are weak guides to nonfarm. You’ll never get nonfarm right looking at claims data.
In short, nonfarm is its own beast with its own sample, its own methodology including birth-death models and SA factors etc, and its own approach to revisions and assorted other quirks.
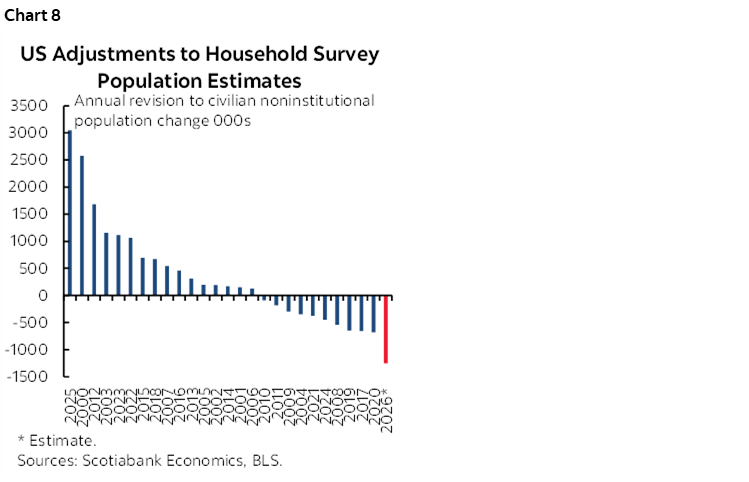
Also keep an eye on BLS incorporation of annual population benchmarking revisions to the household survey from which the unemployment rate is derived. They normally do this in January of each year but guided they’ll get to it asap until this note (scroll down to ‘population control adjustment’) said today is the day. Instead of incorporating them into February numbers that I had thought they might absent guidance, they will revise January’s household survey estimates of employment and the labour force. So, remember when markets loved the decline in the UR to 4.3% last month? That may very well have been totally fabricated as previously argued. My weekly went into the math behind why this year’s population revisions could be a record (chart 8). If so, then the math also went through what it could mean to the household survey’s employment and labour force counts.
WATCH FED REACTIONS
Several Fed-speakers will wrestle for the mic right after nonfarm hits. Given all of the inflation fears at the Fed even before the war broke out it may be a stretch to assume nonfarm disappointment will matter whereas bonds would feel no love from an upside surprise.
The Fed’s Daly (8:30amET) and then Daly and Paulson (10:15amET), Collins (1:20pmET), and Hammack (1:30pmET) are among the scheduled speakers and we may hear from more beyond the regional Presidents.
It would be surprising if officials signalled a material change in stance affecting their near-term views on the back of these numbers as war rages in the Middle East.
US RETAIL SALES UPSIDE?
US retail sales will also be refreshed at the same time as nonfarm and are expected to be soft, but most estimates were submitted before an upside surprise to vehicle sales that we got a few days ago. Key will be the control group that feeds into how consumption is captured in GDP accounts; it could rebound and be the detail that bites.
DISCLAIMER
This report has been prepared by Scotiabank Economics as a resource for the clients of Scotiabank. Opinions, estimates and projections contained herein are our own as of the date hereof and are subject to change without notice. The information and opinions contained herein have been compiled or arrived at from sources believed reliable but no representation or warranty, express or implied, is made as to their accuracy or completeness. Neither Scotiabank nor any of its officers, directors, partners, employees or affiliates accepts any liability whatsoever for any direct or consequential loss arising from any use of this report or its contents.
These reports are provided to you for informational purposes only. This report is not, and is not constructed as, an offer to sell or solicitation of any offer to buy any financial instrument, nor shall this report be construed as an opinion as to whether you should enter into any swap or trading strategy involving a swap or any other transaction. The information contained in this report is not intended to be, and does not constitute, a recommendation of a swap or trading strategy involving a swap within the meaning of U.S. Commodity Futures Trading Commission Regulation 23.434 and Appendix A thereto. This material is not intended to be individually tailored to your needs or characteristics and should not be viewed as a “call to action” or suggestion that you enter into a swap or trading strategy involving a swap or any other transaction. Scotiabank may engage in transactions in a manner inconsistent with the views discussed this report and may have positions, or be in the process of acquiring or disposing of positions, referred to in this report.
Scotiabank, its affiliates and any of their respective officers, directors and employees may from time to time take positions in currencies, act as managers, co-managers or underwriters of a public offering or act as principals or agents, deal in, own or act as market makers or advisors, brokers or commercial and/or investment bankers in relation to securities or related derivatives. As a result of these actions, Scotiabank may receive remuneration. All Scotiabank products and services are subject to the terms of applicable agreements and local regulations. Officers, directors and employees of Scotiabank and its affiliates may serve as directors of corporations.
Any securities discussed in this report may not be suitable for all investors. Scotiabank recommends that investors independently evaluate any issuer and security discussed in this report, and consult with any advisors they deem necessary prior to making any investment.
This report and all information, opinions and conclusions contained in it are protected by copyright. This information may not be reproduced without the prior express written consent of Scotiabank.
™ Trademark of The Bank of Nova Scotia. Used under license, where applicable.
Scotiabank, together with “Global Banking and Markets”, is a marketing name for the global corporate and investment banking and capital markets businesses of The Bank of Nova Scotia and certain of its affiliates in the countries where they operate, including; Scotiabank Europe plc; Scotiabank (Ireland) Designated Activity Company; Scotiabank Inverlat S.A., Institución de Banca Múltiple, Grupo Financiero Scotiabank Inverlat, Scotia Inverlat Casa de Bolsa, S.A. de C.V., Grupo Financiero Scotiabank Inverlat, Scotia Inverlat Derivados S.A. de C.V. – all members of the Scotiabank group and authorized users of the Scotiabank mark. The Bank of Nova Scotia is incorporated in Canada with limited liability and is authorised and regulated by the Office of the Superintendent of Financial Institutions Canada. The Bank of Nova Scotia is authorized by the UK Prudential Regulation Authority and is subject to regulation by the UK Financial Conduct Authority and limited regulation by the UK Prudential Regulation Authority. Details about the extent of The Bank of Nova Scotia's regulation by the UK Prudential Regulation Authority are available from us on request. Scotiabank Europe plc is authorized by the UK Prudential Regulation Authority and regulated by the UK Financial Conduct Authority and the UK Prudential Regulation Authority.
Scotiabank Inverlat, S.A., Scotia Inverlat Casa de Bolsa, S.A. de C.V, Grupo Financiero Scotiabank Inverlat, and Scotia Inverlat Derivados, S.A. de C.V., are each authorized and regulated by the Mexican financial authorities.
Not all products and services are offered in all jurisdictions. Services described are available in jurisdictions where permitted by law.