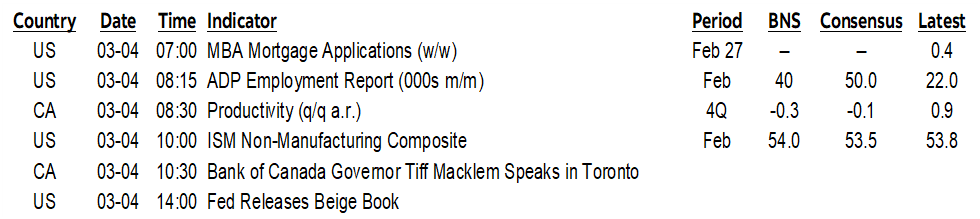
ON DECK FOR WEDNESDAY, MARCH 4th
KEY POINTS:
- Markets are a touch more optimistic on a weak rumour
- Oil futures markets don't think this is the Gulf War again
- What past oil shocks did to US macro variables and which one might apply to today
- Australian Q4 GDP growth ties for fastest in three years
- China SOE-heavy PMIs went nowhere…
- …but the private sector PMIs accelerated
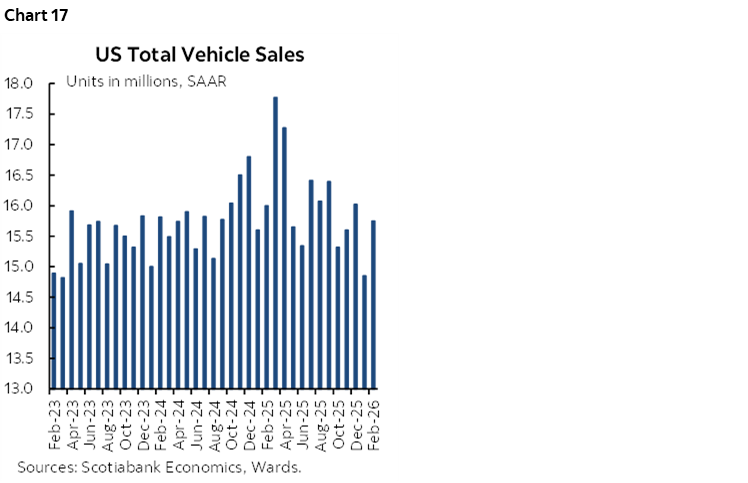
- US vehicle sales surprise higher
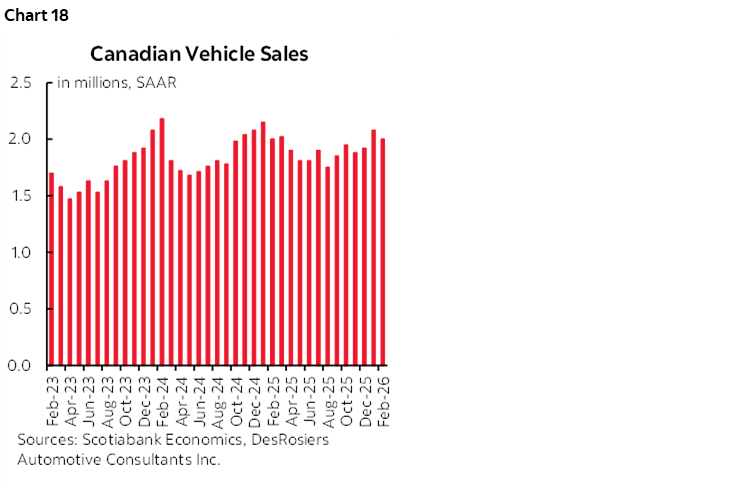
- Canadian vehicle sales slip to fourth highest of last year
- BoC's Macklem to speak—Q&A may be the key
- US to refresh ADP, ISM-services
The broad tone across global markets is a bit more positive this morning. Oil prices are up by either side of 1% for WTI and Brent, but slight optimism shines elsewhere. US equity futures are marginally positive, TSX futures more so, and European equity cash markets are up by 1%+ except London that’s up ½%. US Treasury and Canadian yields are up by only 1–2bp or so, while small rallies are occurring across short-dated gilts and EGBs that are picking up from rallies in JGBs and Australian bonds. The dollar is broadly softer against most of the majors; CAD is little changed, just as it has been throughout.
It seems the catalyst for a little more optimism is on shaky foundations. A rumoured Iranian offer to talk was batted away by the US administration for not being serious. Attacks continued in both directions overnight. Other developments were light and will be covered next before getting into how this geopolitical oil shock compares to others in the past four decades or so and what lessons can be learned from doing so.
Careful With Hasty Forecast Revisions on Middle East Developments
As businesses, markets, investors and economists grapple with the implications of the war with Iran, there is a temptation to invoke wholesale forecast revisions. Some revisions are necessary, especially to the nearer term, but the temptation to rewrite narratives over the medium- and longer-terms should be resisted. A lot could change from tentative developments thus far, but a comparison of this geopolitical-driven oil shock to ones of the past four decades is useful toward downplaying more extreme concerns about the implications for the outlook.
A key distinction between today and the worst oil shock of the past three decades is shown in chart 1. Oil futures markets are not signalling the elevated prices throughout future monthly contracts that was the case when the Gulf War struck. Today's futures curve is suggesting that the price surge will be much more temporary. There are multiple caveats and additional points to make about this.
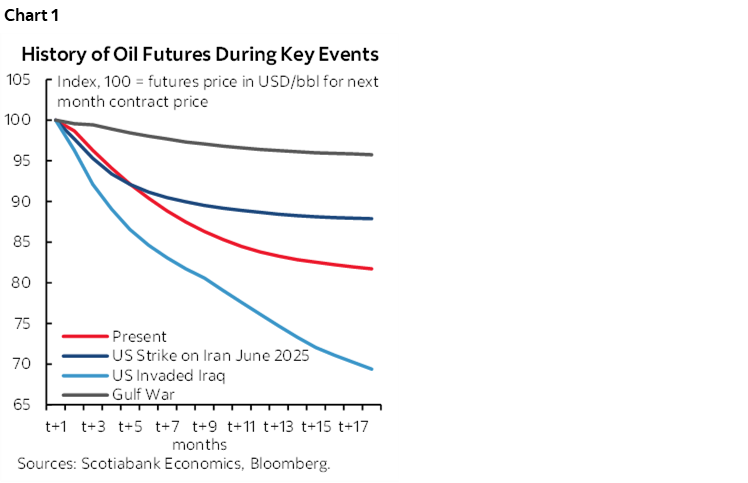
1. The evidence on how futures predict spot oil prices is mixed at best. Some research shows that the current spot price is the best predictor of future spot prices and not a terribly good one. Some research shows that futures add some explanatory power to forecasts in addition to spot prices. I’ll come back to why I think today’s futures curve is telling us something different than the curves during the Gulf War in the early 1990s when President Bush Sr led the invasion of Iraq to repel its attack on Kuwait.
2. Large industrial buyers of oil may not be experiencing the same price shock as retail buyers. Large buyers with constant needs—or anybody who wishes to hedge or speculate—are able to commit to futures contracts at lower than spot prices. That wasn't the case in the Gulf War. This observation limits the nature of the oil shock today. It’s a caution to forecasters not to just focus upon the macro effects of the surge in spot prices.
Another perspective is shown in chart 2 that looks at what happened to spot oil prices in each of the geopolitical oil shocks since 1990. Most of them saw oil prices come right back down in short order. Again, the Gulf War was the exception, but even the damage to energy infrastructure back then gave way to pre-war prices within about four months after peaking within two months.
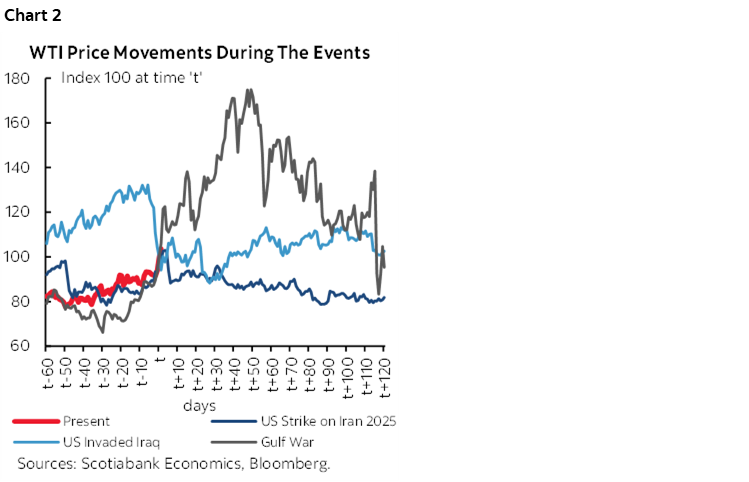
So now the question is how much damage to infrastructure is happening today and how bad it may get. For that, we need to monitor ongoing developments. What we can say is that today seems more like targeted and limited damage versus the Gulf War’s more profound effects on oil prices and the economy. Iraqi forces torched an estimated 80–90% of Kuwait’s oil fields and destroyed vast amounts of energy infrastructure that amounted to the worst oil driven environmental disaster on record. That’s not what we’re dealing with so far today and it’s not even close.
In terms of macroeconomic outcomes of past oil shocks, charts 3–10 (next page) trace GDP, inflation, core inflation and the unemployment rate leading up to and after each of the shocks. Again, the Gulf War was the exception because of the vast damage that was done to energy infrastructure, how long it took to bring back—measured in many months with years of clean up—and because this meant elevated oil futures prices for an extended period. There were also other drivers of a weakening US economy at the time.
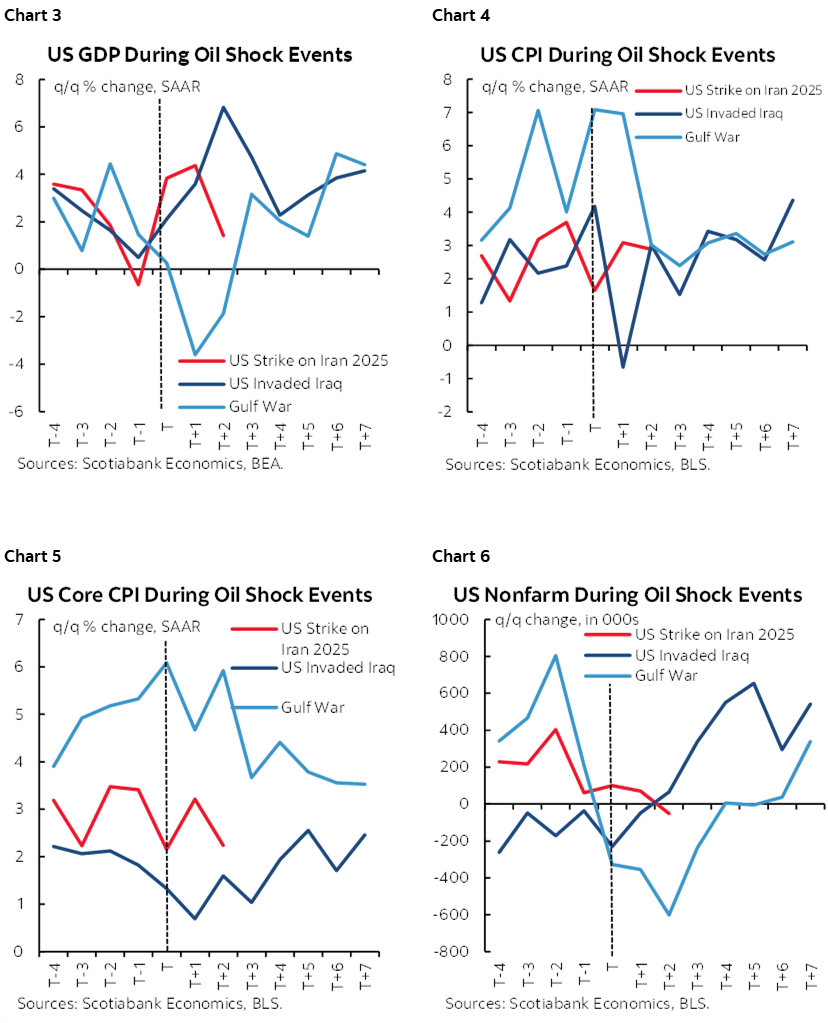
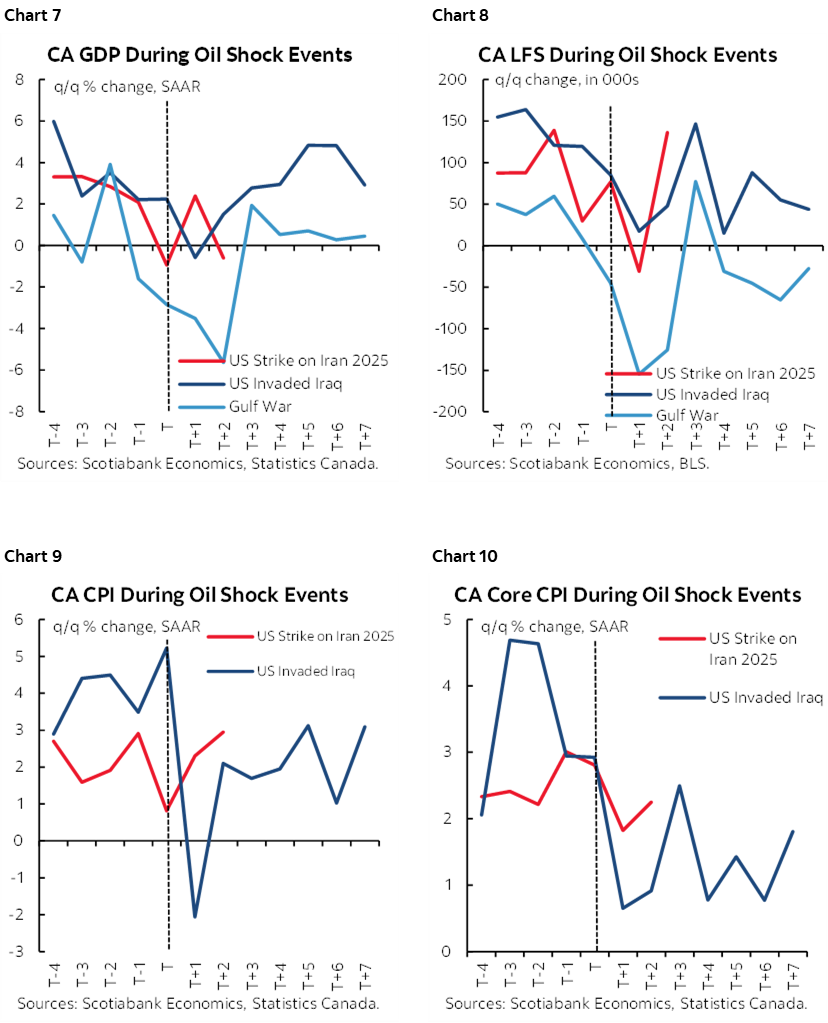
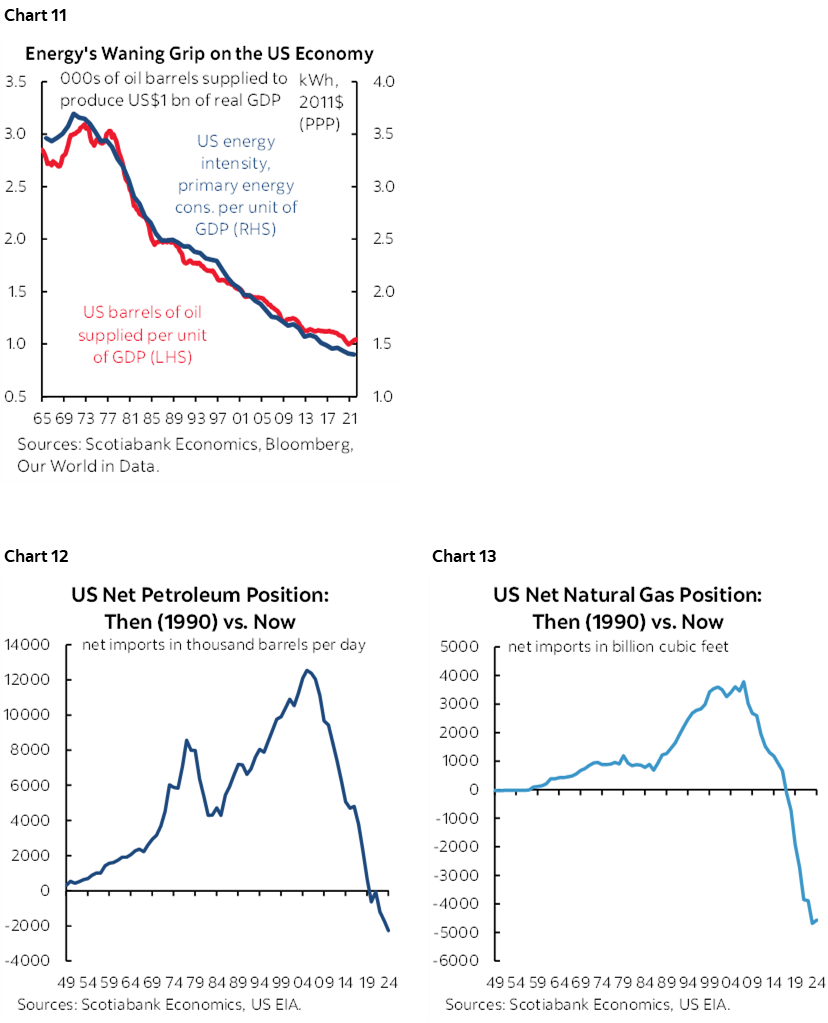
Then again, a lot has changed today versus back in the early 1990s. The US economy uses less oil (chart 11), and has swung from being heavily dependent upon imported oil and natural gas toward being a net exporter of both (charts 12, 13). That translates into a modestly positive income shock to the overall economy on net from higher energy prices this time. You might even get away with saying that the US has a perverse incentive to cause oil shocks today and to the benefit of its energy companies though voters would strongly disagree. Strategic oil reserves held by countries like the US and China are also much bigger today.
China’s State PMIs Underwhelmed, Private PMIs Accelerated
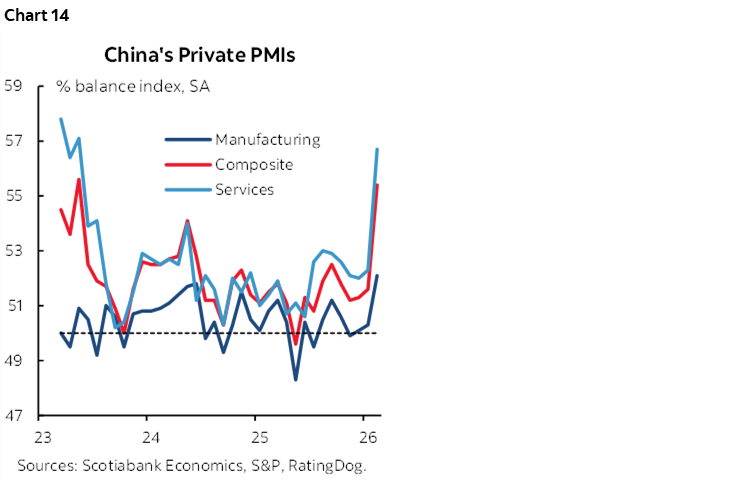
China’s state purchasing managers’ indices were little changed in February but the private sector versions strengthened. The state composite PMI is more skewed toward SOEs and was statistically unchanged (49.5, 49.8 prior) with the manufacturing and non-manufacturing PMIs also little changed at similar readings. The private composite PMI jumped by nearly four points to 55.4, signalling quicker growth with pick-ups in services (56.7, 52.3 prior) and manufacturing (52.1, 50.3 prior). Chart 14.
Australia Posts Fastest Growth in Three Years
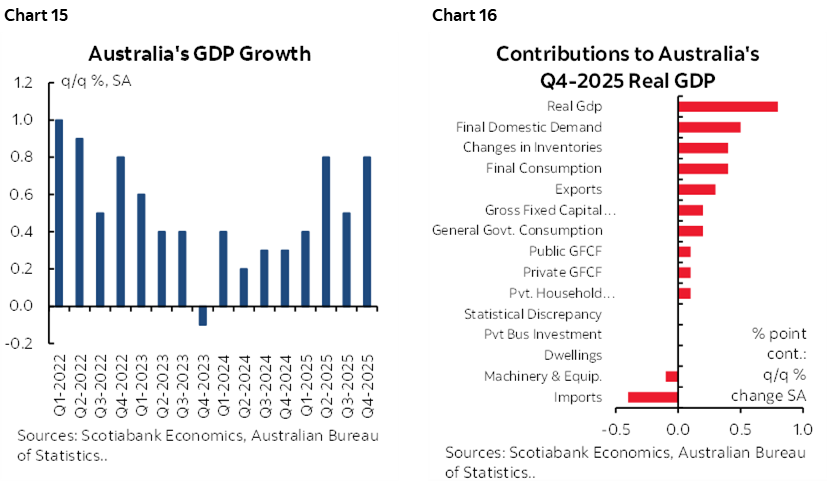
Australia’s GDP beat including revisions has little noticeable impact on Australian rates or the A$. Q4 GDP grew by 0.8% q/q SA, matching consensus, but was revised up a tick to 0.5% in Q3. Q4 matched Q2 net of revisions for the quickest quarterly growth since 2022Q4. (chart 15) with the drivers of Q4 GDP growth shown in chart 16.
Canada-US Economic Indicators
Last evening’s US vehicle sales surprised higher at 15.75 million units at a seasonally adjusted and annualized rate (15.37 consensus) from 14.85 million in January (chart 17). This is a solid contribution to retail sales.
Last evening’s Canadian new vehicle sales slipped a touch to still post the second highest number since February of last year (chart 18). Canadian vehicle sales are tracking about a 25% q/q annualized gain in Q1 which should support consumption growth.
The US updates ADP private payrolls (8:15amET) that are expected to be in the 40–50k range in m/m terms based on weekly tracking, and ISM-services (10amET) that is expected to be little changed but watch to see if prices paid jumps as much as it did for the ISM-manufacturing report.
BoC’s Macklem to Speak on Stability — May Broach Oil
BoC Governor Macklem speaks on ‘financial stability risks and vulnerabilities.’ How appropriate, but they set the speech topic long before the attacks on Iran. The speech embargo lifts at 10:20amET and there will be audience Q&A and a fireside chat but no press.
Watch for any comments from Macklem on oil price effects on Canada given the over US$20 rise in WTI and US$16 rise in the lagging WCS heavy crude benchmark since January. See Monday morning’s note for more on this.
It’s too early to hear anything on the BoC’s policy stance toward an oil shock, and he won’t signal anything material just yet and if anything is likely to say they expect the rise to be temporary. Still, if pressed on the issue, he may say that the longer an oil price shock goes on—which in turn partly depends upon how much damage is done to the energy infrastructure—the more likely the BoC could ultimately pivot. He could go textbook and remind folks how the BoC views material and sustained oil price increases/decreases as a terms of trade shock that, for a net energy exporter, serves as a positive/negative income shock with trickle down effects throughout the economy that add to inflation risk. I doubt he’ll even say that at this point though given it’s early and extremely tentative. Further, I would fully expect him to rightly say that the broad effects on financial market conditions have been pretty modest. Macklem will also be guarded ahead of next Friday’s Canadian jobs for which I’ve gone with a drop.
DISCLAIMER
This report has been prepared by Scotiabank Economics as a resource for the clients of Scotiabank. Opinions, estimates and projections contained herein are our own as of the date hereof and are subject to change without notice. The information and opinions contained herein have been compiled or arrived at from sources believed reliable but no representation or warranty, express or implied, is made as to their accuracy or completeness. Neither Scotiabank nor any of its officers, directors, partners, employees or affiliates accepts any liability whatsoever for any direct or consequential loss arising from any use of this report or its contents.
These reports are provided to you for informational purposes only. This report is not, and is not constructed as, an offer to sell or solicitation of any offer to buy any financial instrument, nor shall this report be construed as an opinion as to whether you should enter into any swap or trading strategy involving a swap or any other transaction. The information contained in this report is not intended to be, and does not constitute, a recommendation of a swap or trading strategy involving a swap within the meaning of U.S. Commodity Futures Trading Commission Regulation 23.434 and Appendix A thereto. This material is not intended to be individually tailored to your needs or characteristics and should not be viewed as a “call to action” or suggestion that you enter into a swap or trading strategy involving a swap or any other transaction. Scotiabank may engage in transactions in a manner inconsistent with the views discussed this report and may have positions, or be in the process of acquiring or disposing of positions, referred to in this report.
Scotiabank, its affiliates and any of their respective officers, directors and employees may from time to time take positions in currencies, act as managers, co-managers or underwriters of a public offering or act as principals or agents, deal in, own or act as market makers or advisors, brokers or commercial and/or investment bankers in relation to securities or related derivatives. As a result of these actions, Scotiabank may receive remuneration. All Scotiabank products and services are subject to the terms of applicable agreements and local regulations. Officers, directors and employees of Scotiabank and its affiliates may serve as directors of corporations.
Any securities discussed in this report may not be suitable for all investors. Scotiabank recommends that investors independently evaluate any issuer and security discussed in this report, and consult with any advisors they deem necessary prior to making any investment.
This report and all information, opinions and conclusions contained in it are protected by copyright. This information may not be reproduced without the prior express written consent of Scotiabank.
™ Trademark of The Bank of Nova Scotia. Used under license, where applicable.
Scotiabank, together with “Global Banking and Markets”, is a marketing name for the global corporate and investment banking and capital markets businesses of The Bank of Nova Scotia and certain of its affiliates in the countries where they operate, including; Scotiabank Europe plc; Scotiabank (Ireland) Designated Activity Company; Scotiabank Inverlat S.A., Institución de Banca Múltiple, Grupo Financiero Scotiabank Inverlat, Scotia Inverlat Casa de Bolsa, S.A. de C.V., Grupo Financiero Scotiabank Inverlat, Scotia Inverlat Derivados S.A. de C.V. – all members of the Scotiabank group and authorized users of the Scotiabank mark. The Bank of Nova Scotia is incorporated in Canada with limited liability and is authorised and regulated by the Office of the Superintendent of Financial Institutions Canada. The Bank of Nova Scotia is authorized by the UK Prudential Regulation Authority and is subject to regulation by the UK Financial Conduct Authority and limited regulation by the UK Prudential Regulation Authority. Details about the extent of The Bank of Nova Scotia's regulation by the UK Prudential Regulation Authority are available from us on request. Scotiabank Europe plc is authorized by the UK Prudential Regulation Authority and regulated by the UK Financial Conduct Authority and the UK Prudential Regulation Authority.
Scotiabank Inverlat, S.A., Scotia Inverlat Casa de Bolsa, S.A. de C.V, Grupo Financiero Scotiabank Inverlat, and Scotia Inverlat Derivados, S.A. de C.V., are each authorized and regulated by the Mexican financial authorities.
Not all products and services are offered in all jurisdictions. Services described are available in jurisdictions where permitted by law.