ON DECK FOR MONDAY, MARCH 2ND

KEY POINTS:
- So far, market reactions to Iranian developments are fairly small and markets are functioning well.
- Geopolitical risk to markets tends to quickly subside
- The reasons for why markets are not terribly fussed
- Risks aplenty
- Assessing the macroeconomic impact if developments were to intensify
- US ISM-mfrg and Canadian mfrg PMI on tap
- Peru CPI spike reinforces BCRP hold next week
- German consumers stumbled after sharp upward revision
- Chile’s economy slightly disappoints
- Global Week Ahead — The Three Bears (reminder here)
SMALL MARKET REACTIONS
Amid all of the shrill-sounding headlines, not one of them is calling it as it is: the market reactions to weekend developments are small and, in some cases—like CAD, or inflation expectations—not what you might expect. Liquidity is holding up and markets are engaged in small amounts of price discovery as opposed to severe ructions that imperil market functioning.
In any event, geopolitical shocks normally provide an opportunity to buy stocks at cheaper entry points because the risk-off effects tend to be temporary. Stocks went on to rally after the US invasion of Iraq in March 2003 and had recovered within about two months after the tragic events on 9/11/2001. Timing this is difficult, or you can engage in dollar cost averaging through smaller successive transactions rather than trying to time the exact bottom. Nevertheless, the small market moves so far provide only limited opportunity at best.
- Stocks are broadly lower with S&P futures down by about 1%, TSX futures are down by just over ½%, European cash markets off by 1–2% after Asian equities moved broadly lower by either side of 1% for the most part except for larger moves in Thailand and the Philippines.
- Index moves are modest but there are potentially greater sector plays within the mixture that can be somewhat offsetting to one another in the aggregate mixture. Negatives affect some shipping companies, insurers, and airlines, whereas positives may affect energy and precious metals, and defence companies.
- Sovereign bond yields are higher by 2–6bps across the US (about 4bps across the curve), Canada (about 3bps) and Europe (4–7bps) after JGBs and Aussie bond yields went the other direction overnight.
- Inflation expectations are a touch higher. The US 10-year inflation TIPS breakeven rate is up by about 4bps from Friday at just over 2¼% and the 2s breakeven is up by about 8bps at 2.90% which is the highest since April of last year. The impact on bonds is fairly muted perhaps because an alternative explanation may be that bonds are pleasantly surprised that the outcome isn’t worse after, for example, US 10s rallied by about 10bps over Thursday and Friday in anticipation of flaring tensions.
- The dollar is firmer, but by less than 1% in the case of all of the majors. CAD is holding firm to the dollar since Friday’s close despite being tagged as a petro currency which is probably because dented risk appetite is offsetting.
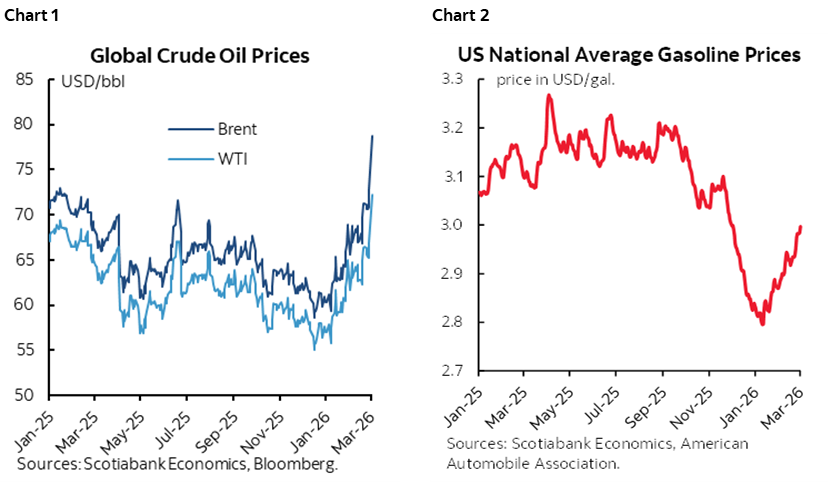
- Oil prices are up by about US$5–6/barrel (or about 8%) with Brent at about US$79 and WTI at just over US$72. Henry Hub natural gas is very little changed. European gas prices are up by over 50% after Qatari LNG production came to a grinding halt which exposes regional vulnerabilities. Oil and gasoline prices have been on an upward swing as anticipation of an attack built which has the dual effect of limiting the shock factor from this weekend and also meaning that assessing the effects of an energy price shock need to take into account the full moves that were expected and then realized (charts 1, 2).
- Gold is up by just over US$117/oz to US$5395.
- Crypto currencies trade throughout the weekend, and Bitcoin is about 1% higher than late Friday.
WHY ARE MARKET REACTIONS SMALL?
It’s entirely possible that further developments could either worsen or lighten market reactions that are being witnessed thus far. Yet here are some musings about why they are fairly contained.
- Markets often quickly look through geopolitical risks and get back to other considerations of which there are plenty today.
- Among those other more important factors are AI, and the sustainability of the US economy as a global growth engine and the state of its job market. This week's nonfarm payrolls and China's NPC and next week's major central banks offer a lot of other nearer term risk.
- some say geopolitical risk increased with a less stable Middle East. Alternatively, it’s entirely possible that crippling a terrorist, theocratic regime that was in pursuit of nuclear ballistic missiles reduces geopolitical and regional risk! Perhaps this is the real ‘Arab Spring’ which could embolden change in neighbouring countries. Yet as I was channel flipping over the weekend, all I heard from CNN was criticism that there was no imminent threat from Iran to justify the attack. Wait until you’re staring straight in the face of a real nuclear ballistic missile threat before you act I always say…..
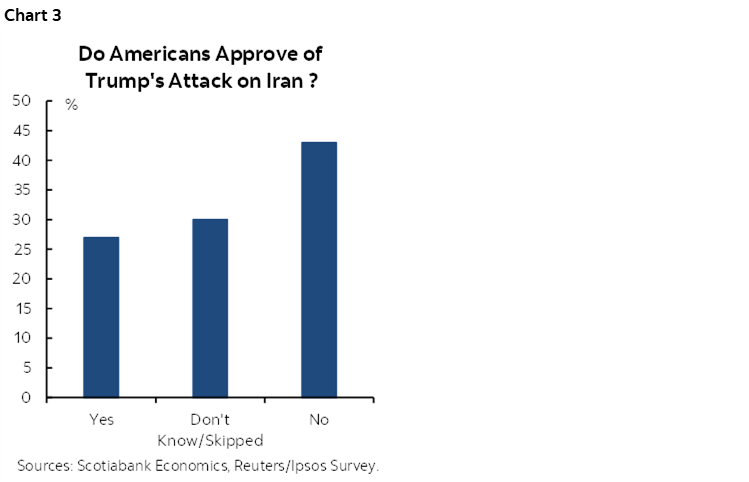
- some who oppose his policies and/or the man will say that if Trump's popularity falls further then that could be a positive in other areas like belligerent trade policies and foreign aggression against enemies and allies alike. If so, perhaps it motivates a more cautious Republican party faced with setbacks on November 7th and opens more constructive opportunities in other areas like more intelligent trade policies. Polls like this one yesterday from Reuters show a lack of support for war with Iran (chart 3). It’s the opposite start to polling in the Iraq War that began high and then plummeted (good recap here). Trump’s popularity may fall because a) Americans are more sceptical toward claims of imminent threats after the 2003 ‘Weapons of Mass Destruction’ farce, and because Trump did a total 180’ turn on everything he has previously said about not getting involved abroad.
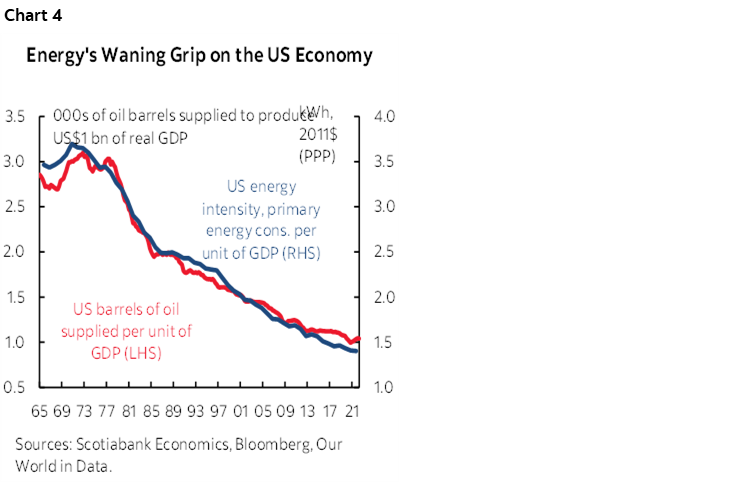
- the main concern is oil given the region doesn’t produce much of anything else. Yet oil is less of an effect on the economy today in terms of the amount used to produce a dollar of GDP (chart 4).
- Regional disparities in how oil affects things are bigger today. The US shift to being a net energy exporter makes it less vulnerable to oil shocks than in the past. Across NA, the abundance of oil including Canada and Mexico is an insulating consideration. India and China are in a different boat.
- there has been modest escalation thus far.
- markets were already priced for no action by most central banks for some time. Therefore, a minor oil shock does little to spark a sell off in bonds. That’s true for the Fed, BoC, ECB, BoE, etc.
- The US and Israel have had remarkably quick success thus far in no small part due to the blinding stupidity of the Iranian leaders who made themselves easy targets for Israeli and American intelligence.
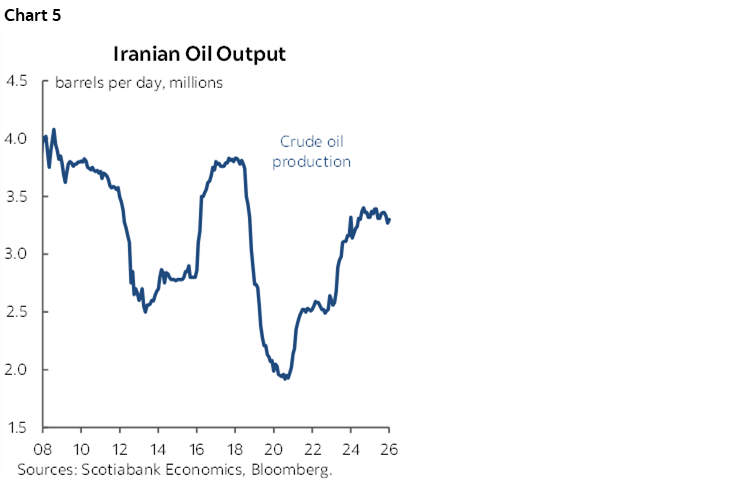
- OPEC announced yesterday that it will boost oil production by 206,000 bpd starting in April in order to help offset the supply shock from Iran. That’s small relative to the impact of Iran going fully offline should damage to energy infrastructure become intense (chart 5).
- Oil markets were over supplied going into the attacks on Iran. It’s not like a production disruption to an already tighter market as in past cases.
- Other oil market considerations include limited negative impact on regional energy infrastructure and stockpiles of crude in places like the US and China.
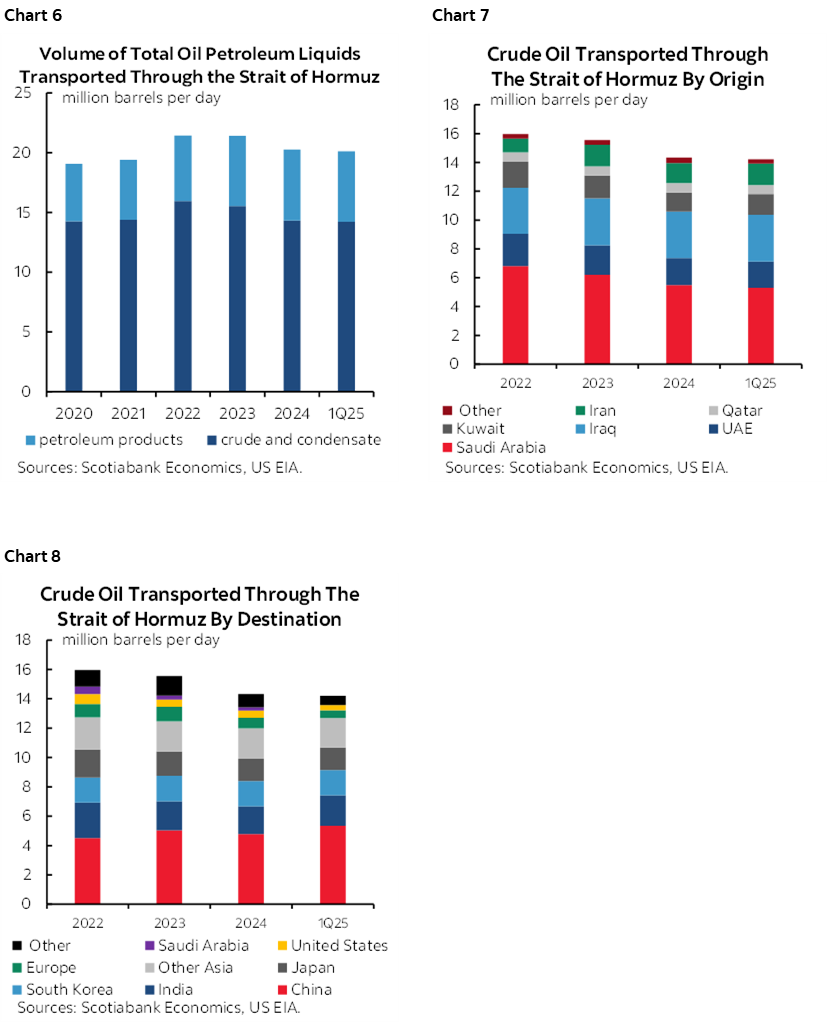
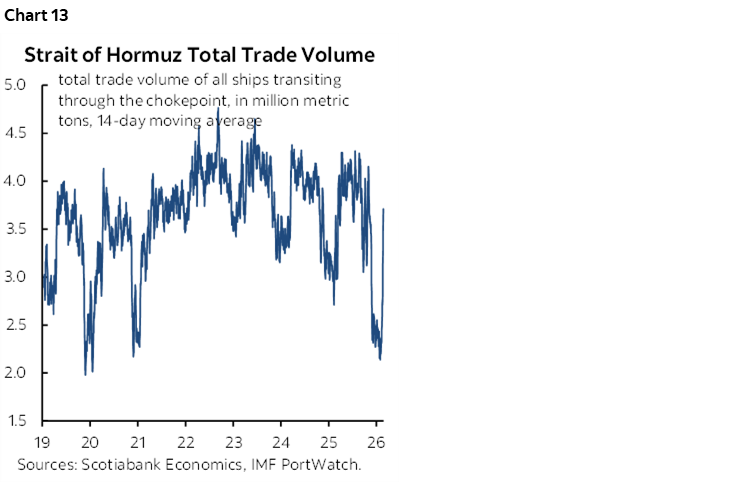
- Thus far, the Strait of Hormuz remains open but with a ‘you first’ attitude among shipping companies as insurers cancel or adjust coverage. This could change, but the large US naval presence and the air cover of US and Israeli forces is a different consideration than in past episodes. While much more limited in scale and scope, there are also alternative routes summarized here. Chart 6 shows what goes through the Strait. Charts 7 and 8 shows crude oil by origin and destination through the Strait.
There are nevertheless plenty of risks that merit continued caution:
- Developments in the Middle East and spillover abroad could escalate in unpredictable fashion.
- IF energy infrastructure becomes seriously damaged in the region then the oil price shock could rise from here.
- The US administration may feel further emboldened by any success it has in Iran. Cuba next? North Korea perhaps? Greenland, or others across the Americas?
- Assassinating or kidnapping foreign leaders puts us into uncharted waters by breaking the previous taboo and let’s just leave it at that.
ASSESSING THE POTENTIAL MACROECONOMIC IMPACT
Tentative contributions toward assessing the macroeconomic impact of the war between the US and Israel versus Iran are offered below.
Assessing the impact of the war with Iran is complicated by many factors. One is the clear potential for unpredictable events to follow the weekend attacks. Two is the duration of the conflict. Three is disentangling its effects from other moving parts of the overall picture.
An example of the latter point is that we’re going into a period of other forms of elevated risks with nonfarm on tap this Friday, China’s annual National People’s Congress later this week into next and the setting of macro and policy targets and political reactions, and then next week’s deluge of decisions and communications by all of the world’s most important central banks.
Another example of the latter point is that markets are probably more focused upon the ongoing technology shock by AI on markets, the future evolution of risks to trade policy, and US midterms come November. As much as I personally believe action against Iran was imperative, US voters might be more driven by what they pay at the pump.
Macroeconomic Impact on Canada and the US
When evaluating the impact of developments there are multiple channels to assess.
Oil prices
The impact of higher oil prices is relatively straightforward to assess. Canada is a net exporter of oil and so is the US.
If—and it’s a big ‘if’—the shock to oil prices is sustained, then the modelled effects are shown in chart 9 thanks to René Lalonde and Olivier Gervais on our team. For every sustained $10 bump higher (and the cumulative moves since January are a little larger than that), oil prices lift Canadian GDP by about ¼% to ½% in 2026 and 2027 respectively, while doing relatively little to US growth given its smaller net export status in relation to a much larger economy and falling energy use per dollar of GDP over time as previously noted. Such a shock adds a touch to headline inflation. Over the full horizon, both countries’ central bank policy rates are probably around a quarter point higher than would otherwise be the case after tracing the shock throughout 2026–27.

Canadian Federal budget assumptions of macro sensitivities yield a similar outcome. This is also where you, the reader, can explore your own scenarios with ChatGPT as a powerful tool readily accessible to non-specialists. The answers ChatGPT provides are similar.
The impact on the Canadian federal deficit is likely a reduction of about $2–5 billion or so per year.
Currency Effects
Standard modelling is that currencies of net oil exporters would benefit from a positive oil price shock whereas net oil importers would experience depreciation. CAD may be more positively exposed to higher oil prices than the US given the relative net export status of the two countries.
Yet how risk appetite evolves is at least as important which we are seeing this morning. Higher oil prices and weaker risk appetite are offsetting, although both moves are contained thus far.
Shipping Costs and Inflation
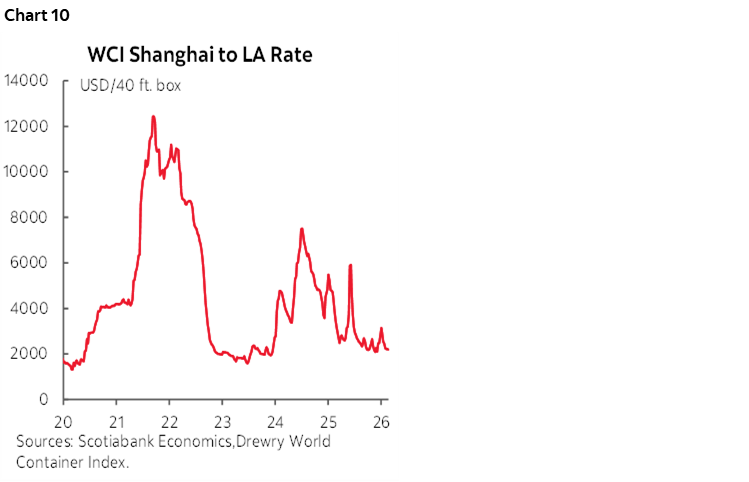
However, the shocks to shipping routes, shipping costs and hence supply chain drivers of inflation are likely to be lower this time around compared to 2024 and compared to the granddaddy of all supply chain shocks in the pandemic. There are two reasons for this.
One is excess capacity in global shipping that has been keeping global shipping costs relatively well behaved for some time now (chart 10).
Further, there have been major route adjustments over the past couple of years that reduce vulnerabilities to the affected region.
The Suez Canal was a major route for goods coming from Asia—particularly China—to Europe. Its role had already diminished because of developments since 2024. One was the US bombing of Syria and Iraq in February 2024 and then the other was the US bombing of Iran in June of 2025. Houthis flinging missiles into the Red Sea at the behest of the Iranians contributed to avoidance of the region. Avoidance of attacks and the impact of higher insurance costs and cancelled coverage drove a need to find other routes.
Instead, shipping companies took the long route around the Cape of Good Hope to dodge tensions. The seas are rougher, sans missiles. Chart 11 shows that the amount of cargo moving through the Suez Canal fell by about two-thirds over this period—mostly into early 2024—and has never recovered. Cargo transiting the Cape of Good Hope doubled at one point and remains nearly five times higher than cargo going through the Suez.
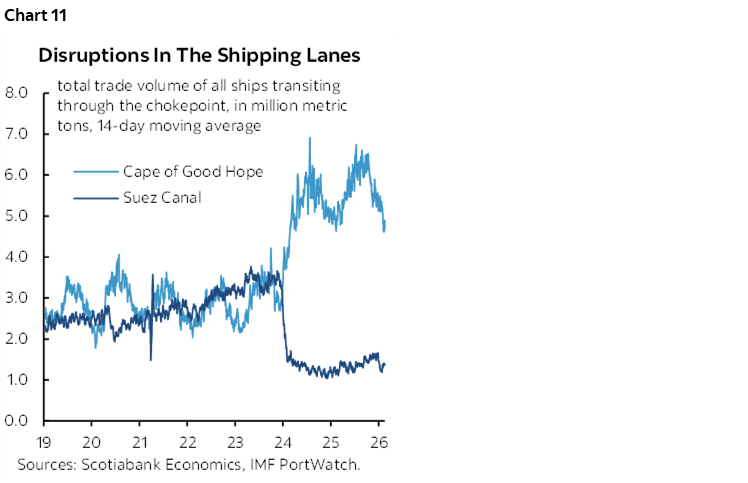
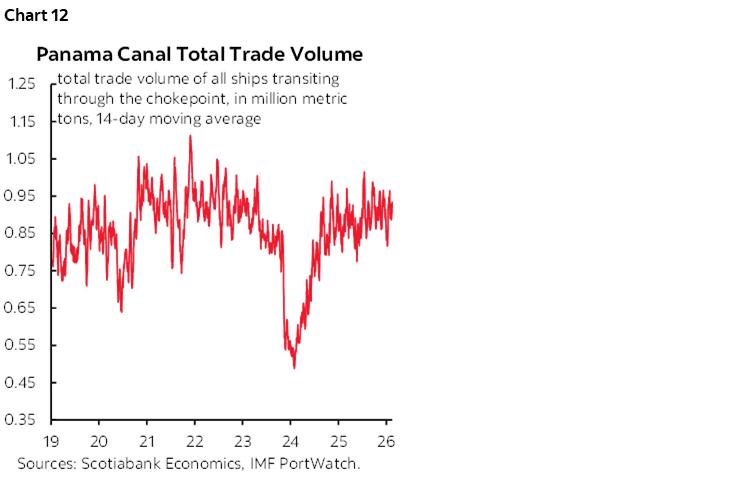
Further, the previously coincidental problems with the Panama Canal into early 2024 that dragged cargo transiting through that channel have since reversed. Chart 12 shows that the Panama Canal’s rebound helps with shipping volumes versus the correlated problems with the Suez canal in 2024. So far this is all a good thing for shipping costs and inflation risk.
Still, the shock risk to the Strait of Hormuz could be significant yet focused on oil with little effect on other goods in transit that take other routes.
Chart 13 shows that the Strait of Hormuz saw a reduction from about 4–4.5 million metric tons of cargo passing through it to around 2.0–2.5 million more recently. The Strait of Hormuz carries an estimated 20% of global oil production and a further 20% of LNG shipments. War risks shutting the Strait and hence clearly risks driving spikes in both prices which is very much opposed to Trump’s constant desire to secure lower energy prices.
OTHER GLOBAL DEVELOPMENTS
As for things other than Iran, there are a few considerations.
A pair of regional inflation readings surprised higher. Peru’s inflation rate sharply accelerated in February. Yesterday’s release jumped from 1.7% y/y to 2.2% (1.7% consensus). CPI was up 0.7% mm/m (0.2% consensus). Core CPI went from 1.8% y/y in December to 2% in December. Peru’s central bank is widely expected to remain on hold at 4.25% again on March 12th.
Indonesia’s CPI inflation rate also landed higher at 4.8% y/y (3.6% prior, 4.3% consensus) with core inflation up 0.2 to 2.6% y/y (2.5% consensus).
German retail sales volumes fell in January (-0.9% m/m, 0% consensus) because the prior month was revised sharply higher (1.2% m/m from 0.1%) and therefore posed a higher jumping off point into January.
Chile’s economy slightly disappointed in January’s economic activity index—a proxy for GDP growth. It was up 0.2% m/m (0.3% consensus) with the y/y rate at –00.1% (+1% consensus).
Canada updates the little-watched S&P manufacturing PMI for February (9:30amET). The reading moved out of contraction in January for the first time since the prior January.
The US updates ISM-manufacturing for February this morning (10amET). It’s likely to get lost behind Iran’s effects and ahead of bigger data over the week including ISM-services and nonfarm.
DISCLAIMER
This report has been prepared by Scotiabank Economics as a resource for the clients of Scotiabank. Opinions, estimates and projections contained herein are our own as of the date hereof and are subject to change without notice. The information and opinions contained herein have been compiled or arrived at from sources believed reliable but no representation or warranty, express or implied, is made as to their accuracy or completeness. Neither Scotiabank nor any of its officers, directors, partners, employees or affiliates accepts any liability whatsoever for any direct or consequential loss arising from any use of this report or its contents.
These reports are provided to you for informational purposes only. This report is not, and is not constructed as, an offer to sell or solicitation of any offer to buy any financial instrument, nor shall this report be construed as an opinion as to whether you should enter into any swap or trading strategy involving a swap or any other transaction. The information contained in this report is not intended to be, and does not constitute, a recommendation of a swap or trading strategy involving a swap within the meaning of U.S. Commodity Futures Trading Commission Regulation 23.434 and Appendix A thereto. This material is not intended to be individually tailored to your needs or characteristics and should not be viewed as a “call to action” or suggestion that you enter into a swap or trading strategy involving a swap or any other transaction. Scotiabank may engage in transactions in a manner inconsistent with the views discussed this report and may have positions, or be in the process of acquiring or disposing of positions, referred to in this report.
Scotiabank, its affiliates and any of their respective officers, directors and employees may from time to time take positions in currencies, act as managers, co-managers or underwriters of a public offering or act as principals or agents, deal in, own or act as market makers or advisors, brokers or commercial and/or investment bankers in relation to securities or related derivatives. As a result of these actions, Scotiabank may receive remuneration. All Scotiabank products and services are subject to the terms of applicable agreements and local regulations. Officers, directors and employees of Scotiabank and its affiliates may serve as directors of corporations.
Any securities discussed in this report may not be suitable for all investors. Scotiabank recommends that investors independently evaluate any issuer and security discussed in this report, and consult with any advisors they deem necessary prior to making any investment.
This report and all information, opinions and conclusions contained in it are protected by copyright. This information may not be reproduced without the prior express written consent of Scotiabank.
™ Trademark of The Bank of Nova Scotia. Used under license, where applicable.
Scotiabank, together with “Global Banking and Markets”, is a marketing name for the global corporate and investment banking and capital markets businesses of The Bank of Nova Scotia and certain of its affiliates in the countries where they operate, including; Scotiabank Europe plc; Scotiabank (Ireland) Designated Activity Company; Scotiabank Inverlat S.A., Institución de Banca Múltiple, Grupo Financiero Scotiabank Inverlat, Scotia Inverlat Casa de Bolsa, S.A. de C.V., Grupo Financiero Scotiabank Inverlat, Scotia Inverlat Derivados S.A. de C.V. – all members of the Scotiabank group and authorized users of the Scotiabank mark. The Bank of Nova Scotia is incorporated in Canada with limited liability and is authorised and regulated by the Office of the Superintendent of Financial Institutions Canada. The Bank of Nova Scotia is authorized by the UK Prudential Regulation Authority and is subject to regulation by the UK Financial Conduct Authority and limited regulation by the UK Prudential Regulation Authority. Details about the extent of The Bank of Nova Scotia's regulation by the UK Prudential Regulation Authority are available from us on request. Scotiabank Europe plc is authorized by the UK Prudential Regulation Authority and regulated by the UK Financial Conduct Authority and the UK Prudential Regulation Authority.
Scotiabank Inverlat, S.A., Scotia Inverlat Casa de Bolsa, S.A. de C.V, Grupo Financiero Scotiabank Inverlat, and Scotia Inverlat Derivados, S.A. de C.V., are each authorized and regulated by the Mexican financial authorities.
Not all products and services are offered in all jurisdictions. Services described are available in jurisdictions where permitted by law.