ON DECK FOR WEDNESDAY, MARCH 18th
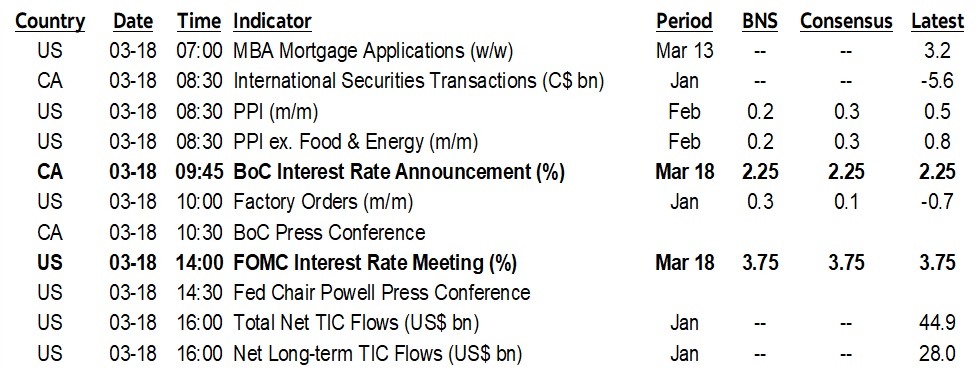
KEY POINTS:
- Markets are mildly constructive into central bank decisions
- BoC preview
- FOMC preview
- BCB to cut
- Quebec & Saskatchewan budgets today
- US PPI, factory orders due
- Global macro: Chilean GDP, SA CPI
Both stocks and sovereign bonds are richening into today’s central bank decisions but daily gyrations in the war with Iran may be dominating. WTI is a touch softer while Brent is flat. US and Canadian equity futures are up by about ½% with European cash markets averaging around double that gain after Asian benchmarks rallied overnight. Currencies are mixed, with CAD flat on relative Fed and BoC risks.
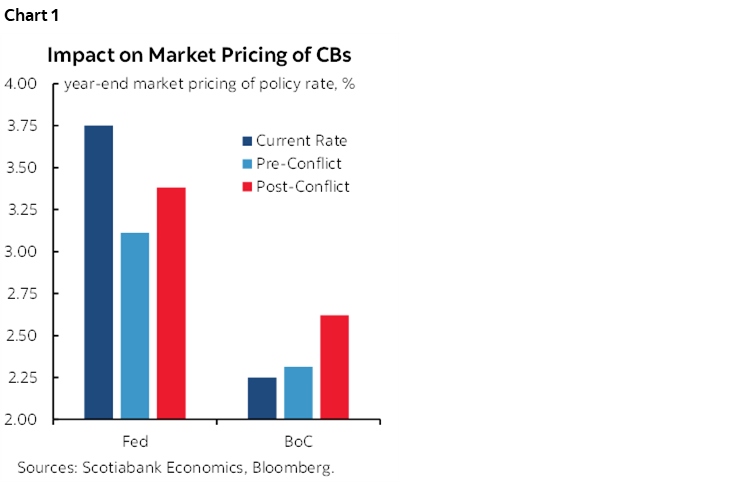
Three more central banks will weigh in out of the week’s 14 to deliver decisions. Markets have repositioned toward higher policy rates in reaction to the American and Israeli war against Iran (chart 1).
BANK OF CANADA PREVIEW
No policy changes are expected at this meeting. The statement and Governor Macklem’s written opening remarks to his press conference arrive at 9:45amET followed by the press conference hosted by him and SDG Rogers forty-five minutes later. They are in between forecast rounds with January’s looking somewhat stale by now and the next forecast update coming on April 29th and probably after a Spring federal fiscal update that may contain additional measures to accompany updated financial figures.
In short, I expect the same line on the bias, fading of recent data as broadly in line with their expectations, and view commenting on how to address an oil shock as premature at this point at least until they issue updated projections next month. Elaborations below.
The Bias
Key in the statement will be expected maintenance of the line saying they judge “the current policy rate remains appropriate” conditional on their projections. A dovish tweak will be based on recent data and is a lower tail probability than a hawkish tweak related to surging oil prices. Both tails are low probability outcomes.
Reactions to Energy Markets
I’d be quite surprised to see much of any reaction to developments at this point. The BoC is slow footed and in this case perhaps for good reasons as it will wish to monitor the magnitude and permanence of the energy shock and how it impacts Canada’s economy, inflation, and monetary policy. When they figure they have enough info, they can spin on a dime with zero tee-up.
As one example in the other direction, recall when oil prices were tumbling from nearly US$110 in the summer of 2014 to about $45 by year-end into 2015Q1. You won’t find any mention of keywords like oil or energy in any BoC statement over that period until January 2015 when Poloz waltzed in and delivered a sudden cut that caught many off guard. Then what they did afterward is another messy story about how things sometimes work in Canada, but after a skip they cut again.
If this is a sustained positive energy shock, then I would expect something similar from them this time in the other direction. In other words, cautious and cagey circumspection for now, but stay on guard over coming months. I would advise not taking literally whatever placeholder language they put in tomorrow’s language.
The risk on this issue may lie more in the presser if Macklem is pressured to address energy market developments. If he says something like how an energy shock is typically favourable to Canada and can stoke inflationary pressures they’d need to respond to, then buckle up and ride OIS to the treetops. But I think he’s been around long enough to avoid anything quite as premature as such a move at this point. My personal bias is we’re in for the long haul on an energy shock, but we’re talking about a central bank here where it’s all about risk management, waiting for data, spinning their models, and wrangling a committee toward a consensus, versus behaving like markets.
How to Interpret Energy Influences on BoC Policy
A large, positive energy price shock adds to inflation risk in Canada. Econ 101 for a net energy exporter. You sell your exports at a more rapidly rising price than what you pay for imports which is akin to an imported positive income shock to national income. The currency would sterilize some of this if monetary policy is expected to become more restrictive.
This income shock trickles down through various sectors. Fiscal balances improve because they tax the heck out of the gooey stuff. Corporate income/profits benefit as energy sector profits and retained earnings rise. Household incomes rise as some of this is paid out through wages and some through shareholders. This is an unambiguously positive income shock that spreads across multiple sectors of the economy with magnitude and duration yet to be determined as the reasons for caution. Some of that usually tends to get spent by the combination of the sectors.
Data Reactions
On recent data, I think they’ll treat it all as water under the bridge in the face of forward-looking uncertainties and all largely in line with their expectations. Yes, that’s right, you wouldn’t be able to tell it from some of the commentary, but the data we’ve been getting is unlikely to surprise the BoC. I’ll focus on GDP, inflation and the job market.
A) GDP:
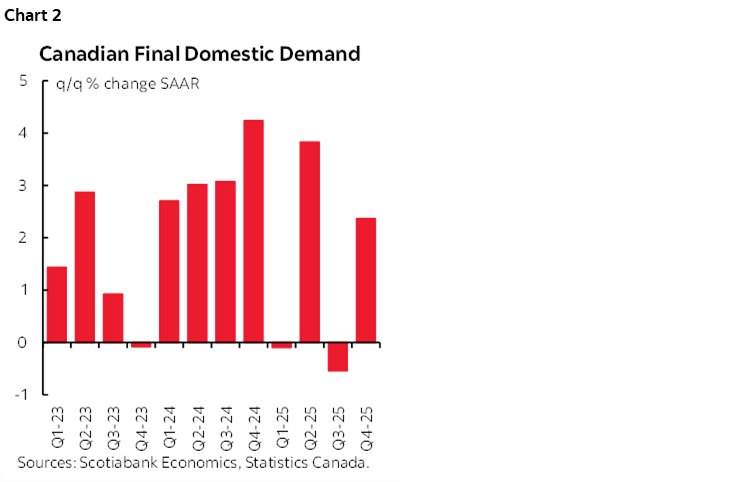
- they’ll flag soft Q4 GDP (-0.6% q/q SAAR) but probably heavily fade it given final domestic demand was up 2.3% (chart 2). GDP was weighed down by a 4.2 ppt weighted inventory drag and a slight drag from higher imports that combined to mask gains in consumption, business investment, government cap-ex including defence, and exports. They are getting their rebound narrative in the domestic economy, it’s just under a fog of ongoing inventory gyrations. We’re also tracking a similar gain in final domestic demand in Q1.
- They’ll probably say GDP is performing roughly as expected. The January MPR had 0% q/q SAAR for Q4, so -0.6% SAAR isn’t a notable miss especially given sketchy drivers. It’s too early in the data to assess their 1.8% Q1 growth forecast from January’s MPR but directionally we’re tracking a milder rebound thus far.
B) Inflation:
- their January MPR forecast of 2% y/y 2026 CPI inflation is looking pretty good given Q1 is so far averaging 2.05%. They anticipated cooling in their projections when they guided a very patient narrative. They also had 2.5% y/y for the Q1 average of TM and WM core inflation and we’re tracking 2.4% so far with another month to go which is, once again, practically spot on.
- on core CPI see my note the other day. Traditional core is not light like trimmed mean and weighted median. It’s all about forward-looking risks that should lead them to fade a soft patch that they’ve seen many times over recent years before risks turn upward.
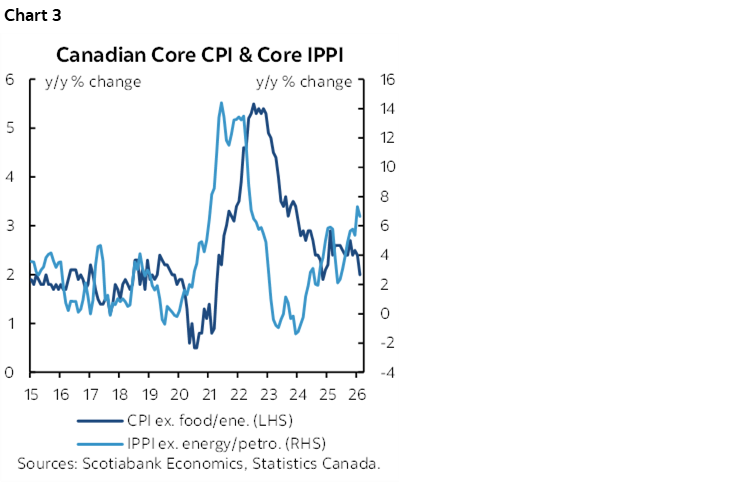
- As chart 3 reminds us, inflation risk has not disappeared even before the oil shock. There was a pre-existing risk of higher producer price inflation getting passed into consumer prices that continues to hang over the outlook. The BoC will pay keen attention to inflation expectations in its next batch of surveys before April’s decision.
C) Jobs:
- on jobs, two months of losses hurt, but several question marks were flagged in Monday’s note.
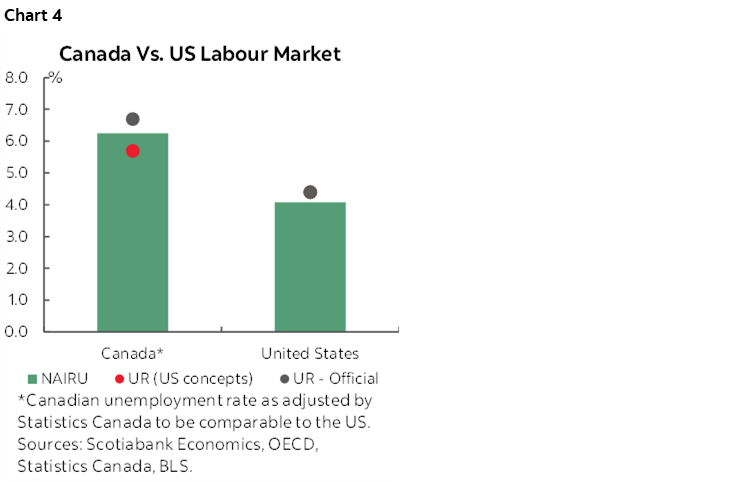
- They are likely to view recent losses as heavily supply driven as the labour force retreated by 146k over Jan–Feb relative to -109k for jobs which is why the 6.7% UR hasn’t really shown a trend and is actually down from last August’s 7.1% peak. In plain language, a major reason jobs fell is because of fewer potential workers. Further, at 6.7, there is slight slack relative to a NAIRU estimate around a few tenths lower (chart 4).
- But why fewer potential workers? And if recent job weakness is supply driven, then why the ongoing monthly rise in population according to the LFS when Statcan says quarterly population is declining?
- That’s because LFS applies a 12-month MA to the temps category and hence the LFS definition of population lags what another division at Statcan estimates. Go figure. Statcan’s hard population figures show declines as tighter immigration policy takes root especially as applied to nonperms/temps.
- wage growth remains solid at 4.2% y/y in February with ongoing wage settlements from collective bargaining agreements adding years of juice ahead given one-third of Canada’s workforce is unionized (10% stateside).
- productivity? Canada?? Surely you jest. It was flat (-0.1% q/q SAAR) in Q4, up 1.1% in Q3, down 0.7% in Q2, flat in 2025Q1, and so forth, you get the picture. Real wages are rising in Canada amid immaterial trend productivity growth and that’s the ultimate lens through which to view labour market contributions to inflation risk. Growth in profit margins is squeezed as productivity restrains revenue growth while cost pressures are still rising and some of that squeeze risks getting passed on going forward.
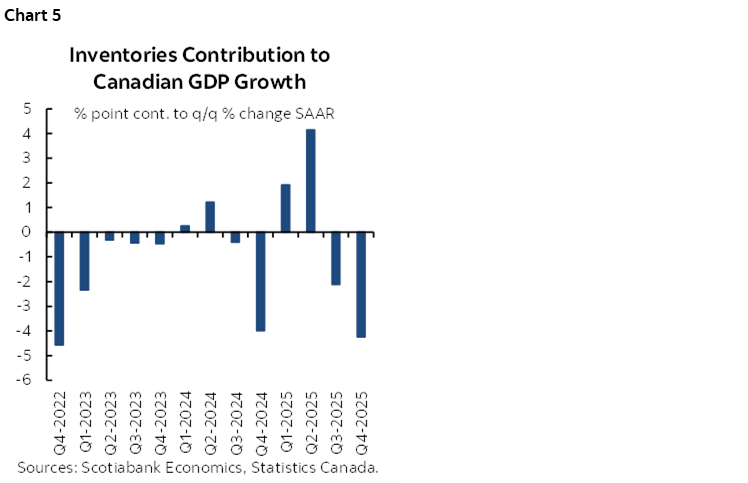
As a last data observation, the BoC will likely be very cautious interpreting the past year’s gyrations in GDP, final domestic demand, trade swings and inventories. Trump’s tariff wars have caused massive data volatility. As evidence, just glance at chart 5; inventories were big upside drivers of Q1 and Q2 GDP growth last year that was pulled forward on tariff avoidance and front-running behaviour, only to give way to large inventory drags in Q3 and Q4.
FOMC PREVIEW
We’ll get the statement at 2pmET along with a revised Summary of Economic Projections (SEP) with a fresh dot plot. Chair Powell’s second last press conference at the helm starts 30 minutes later for around 45 minutes or so.
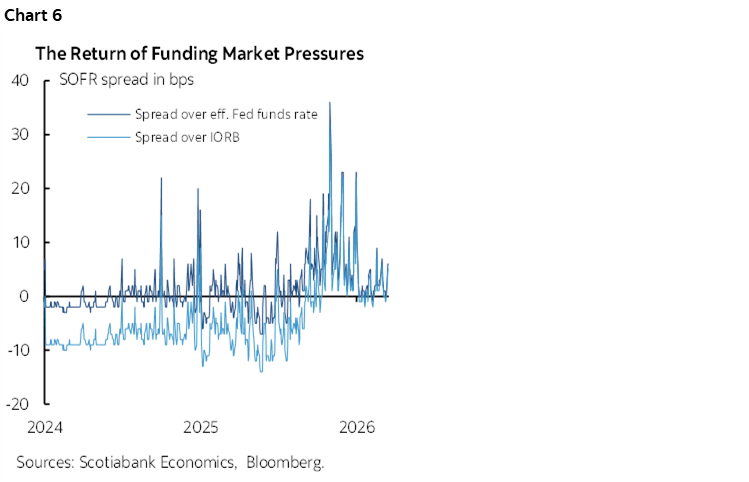
No policy changes are expected. The fed funds target range is likely to stay at 3.5–3.75%. Funding market pressures have subsided from last Fall’s peaks (chart 6). Keys will be how the dots and forecasts change and then how Powell spins it in the presser.
I expect them to signal weaker growth, a slightly higher unemployment rate, higher inflation and the same dots. That should be followed by Powell shrugging his shoulders awaiting more data and more developments while repeating that policy is in a good place to respond to developments but that they are prepared to be patient for some time. Amid the uncertainty, the right thing to do may well be to leave it to Warsh to take over in June. Elaborations below.
Updated Dots
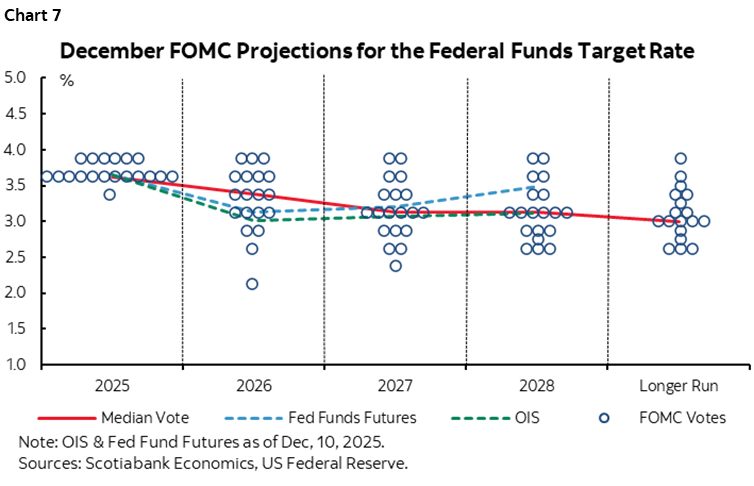
They only had one cut this year in December’s dots. I’d lean toward just leaving that unchanged for now but expect as high dispersion of the dots as in December. Back then, the Committee was scattered almost evenly between holding and cuts of 25 or 50 bps with a few below that (chart 7). Dispersion will matter as much as the median dot. The lower tail is the most vulnerable.
They’re getting worse information on the full employment part of the dual mandate but more upside risk on inflation. It’s still an empirical question as to which part of the mandate deteriorates the most relative to 2% inflation and around 4 ¼% unemployment metrics for dual mandate goals. I don’t expect the Committee will, on balance, feel comfortable that they have the answer and so leave it alone for now.
In any event, remember that the year-end dot this far out from year-end is of very little use. The next year’s dot even more so and the one after this even more than that. The dot plot becomes more useful as you get into the second half of the year in normal years and with this not being a normal year there is even more reason to trade and quickly fade whatever they put down tomorrow.
Forecast Changes
I would expect the Committee to project weaker growth, possibly a little higher UR and quite a bit more inflation than previously when they forecast back in December.
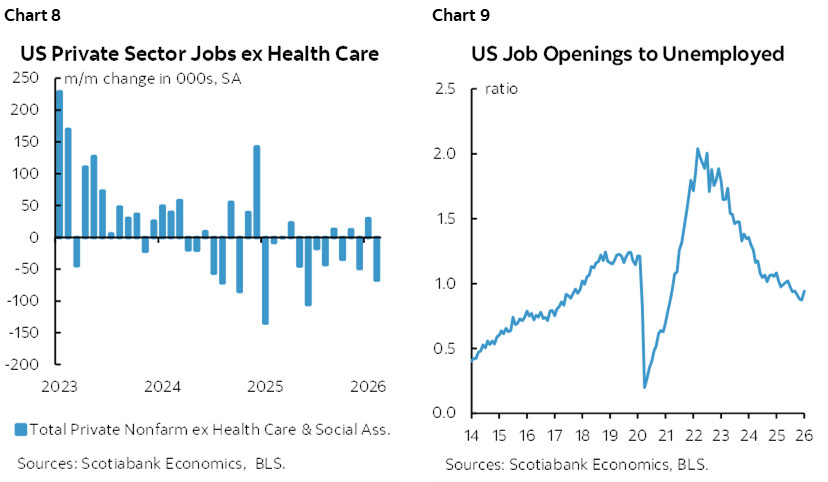
There is no doubt that the labour market is softening and has been for quite a while even stretching back before tighter immigration policy. Chart 8 shows frequent declines in private nonfarm payrolls excluding health care as the lone bright spot at least until it fell in February. Chart 9 shows that the job openings to unemployed ratio has dipped below 1.0 for the past two months which signals inadequate openings relative to the number of unemployed.
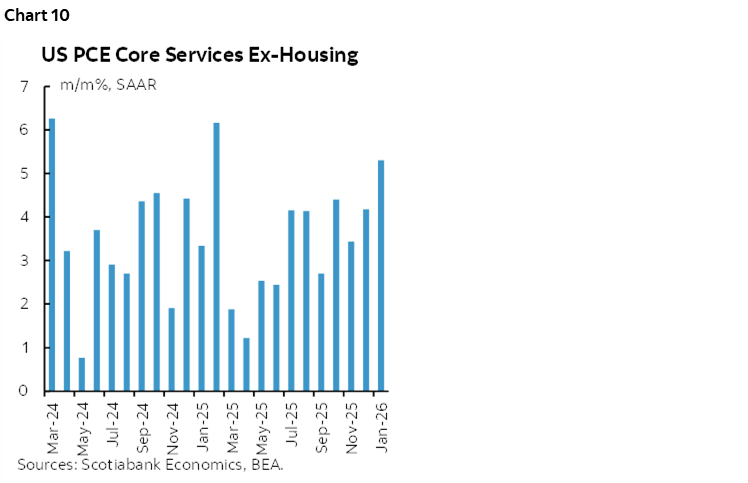
There is also no doubt that significant forms of inflationary pressures are persisting. Chart 10 shows that about a quarter of the PCE basket defined as core services ex-housing has seen accelerating price pressures over the past year.
Relative to our current forecasts we see the Committee taking 2026 GDP growth down by quite a bit (2.3% toward 1½%).
They may leave the UR unchanged but with more risk they increase rather than decrease it. I think the demand side for labour is weakening more than the supply side through immigration policy and will continue to do so.
They’ll need to raise their inflation projections. We’re taking PCE up toward 2¾% this year whereas December’s SEP was 2.4%. Some of that energy driven PCE increase trickles into core PCE that we’ve added a bit more to get to about 2½% versus the December SEP that was already 2.5 and will probably inch up a tick or two.
Statement Changes
The current conditions paragraph risks a more dovish angle on growth after Q4 GDP landed at a revised 0.7% q/q SAAR but with Q1 nowcasts tracking firmer. They could keep “job gains have remained low” where -92k followed +126k and they look at a variety of measures of the labour market. A dovish signal would clearly be to signal greater concern about the job market but Powell imo has been blowing smoke on the job market tensions to date. They struck out “downside risks” to jobs at the precisely wrong moment in January.
“Inflation remains somewhat elevated” is likely to be enhanced with a reference to increased upside risk.
They could retain “in considering the extent and timing of additional adjustments to the target range.” Strike out ‘additional’ to break the connection with prior easing and you’ve got a more clearly communicated symmetrical bias if they choose to do so at this point but that’s likely premature. A more explicit approach to a two-sided bias is also possible in light of the minutes to the prior meeting, but signalling openness toward hiking at this stage feels inappropriate for the Committee to entertain.
There may be dissenters. Governor Miran is likely. I’m unsure about Governors Waller and Bowman.
Presser
If I were Powell, I’d go back to last summer. Back then, he was candidly saying they don’t know which part of the dual mandate deteriorates the most, that it’s an empirical question to be informed with time and data, and therefore they don’t know how they’ll ultimately respond. How can you say otherwise at this juncture. The case for sounding this way is stronger now.
I see upside risks to inflation and downside risks to the job market versus much of the commentary I’ve seen that skews almost solely toward the former. I’m increasingly concerned about the outlook for the US economy, some of which I argued in yesterday’s morning note. Downside risks to the economy have risen along with higher recession probability that is not yet a base case.
As growth weakens, we have the somewhat positive output gap moving toward balance which all else equal should be a mildly disinflationary counterweight to the energy shock.
How Powell interprets the oil shock could be the difference maker. The US is a net energy exporter now and so all else equal it isn’t penalized from surging oil prices the same way as it used to be. He could argue that longer-run inflation expectations remain reasonably well anchored but higher in the shorter-term. Will he counsel viewing this shock as something to look through? Just like looking through tariff effects? Just like looking through a variety of other supply chain effects?
On balance, if you thought FOMC divisions were material to date, tomorrow and when the cats spring loose next week is likely to bring out even greater divisions.
A PAIR OF CANADIAN PROVINCIAL BUDGETS
Two Canadian provinces will deliver budgets later today. Mitch Villeneuve shares his perspectives below.
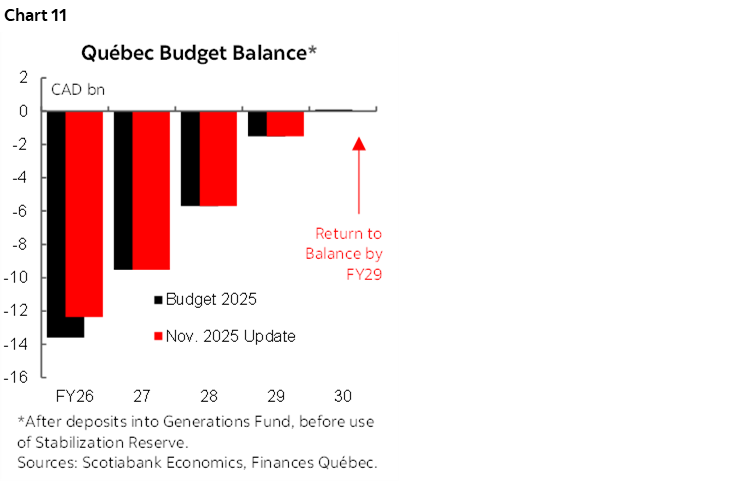
Québec is expected to release its 2026 budget around 4pm ET today. While normally we would expect some new major spending promises in the final budget before an election, the ruling CAQ being in the middle of a leadership campaign to choose a new Premier will make this budget less interesting than usual. Finance Minister Eric Girard has publicly signalled that this will be a largely a status-quo budget, though with some increases for core services and infrastructure. Given the Minister’s remarks and the legislative requirement to balance the budget by FY29, we don’t expect significant changes in the projected deficit path (chart 11).
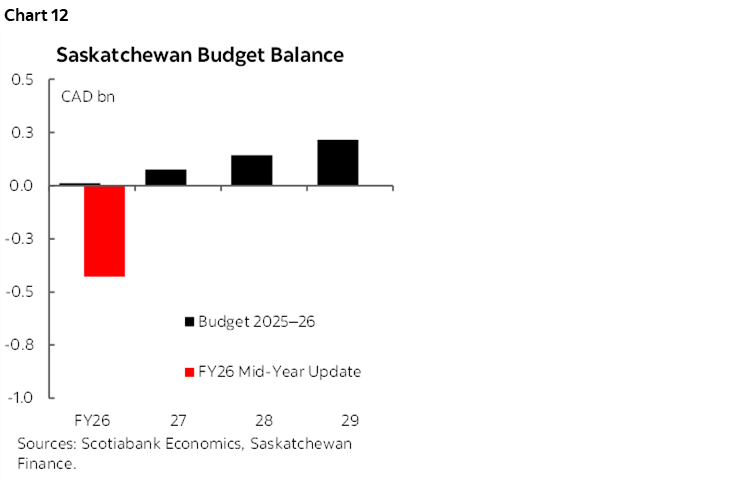
Saskatchewan’s new budget should come out around the same time as Quebec’s. The province downgraded its 2025–26 budget balance projection in its mid-year update from a small surplus to a deficit of $427 mn (around 0.4% of GDP) due to higher spending and weaker tax and resource revenues, and Premier Scott Moe has publicly said that a deficit will be projected in this budget for 2026–27 (chart 12). However, Saskatchewan’s low debt burden enables it to withstand a modest deficit. In addition, the budget may not incorporate much of the recent increases to oil prices, setting up the province’s revenues to overperform. The latest rule of thumb is that each dollar increase in oil prices improves SK’s revenues by $18 mn.
OTHER STUFF
The US refreshes February producer prices (8:30amET) that are expected to be up by about 0.3% m/m, and then factory orders in January (10amET) that might post a small gain if nondurables are strong enough to offset no growth in durables.
Chile updates Q4 GDP this morning amid expectations for a mild rebound from the Q4 print of –0.1% q/q as consensus leans toward 0.3% (7:30amET).
Brazil’s central bank is expected to cut by 25bps to 14.75% with some thinking they could go –50bps and a very few expecting a hold (5:30pmET).
South Africa’s inflation surprised to the downside this morning as somewhat of a relief to SARB with markets pricing about one 25bps hike over the coming year. CPI was up 0.4% m/m seasonally unadjusted (0.5% consensus) but core was up 0.7%, three-tenths shy of consensus. Year-over-year rates for both ebbed to 3% and are now at the low end of SARB’s 3-6% inflation target range. Still, it is February data, and inflation risk remains pointed higher given dependency upon energy imports.
DISCLAIMER
This report has been prepared by Scotiabank Economics as a resource for the clients of Scotiabank. Opinions, estimates and projections contained herein are our own as of the date hereof and are subject to change without notice. The information and opinions contained herein have been compiled or arrived at from sources believed reliable but no representation or warranty, express or implied, is made as to their accuracy or completeness. Neither Scotiabank nor any of its officers, directors, partners, employees or affiliates accepts any liability whatsoever for any direct or consequential loss arising from any use of this report or its contents.
These reports are provided to you for informational purposes only. This report is not, and is not constructed as, an offer to sell or solicitation of any offer to buy any financial instrument, nor shall this report be construed as an opinion as to whether you should enter into any swap or trading strategy involving a swap or any other transaction. The information contained in this report is not intended to be, and does not constitute, a recommendation of a swap or trading strategy involving a swap within the meaning of U.S. Commodity Futures Trading Commission Regulation 23.434 and Appendix A thereto. This material is not intended to be individually tailored to your needs or characteristics and should not be viewed as a “call to action” or suggestion that you enter into a swap or trading strategy involving a swap or any other transaction. Scotiabank may engage in transactions in a manner inconsistent with the views discussed this report and may have positions, or be in the process of acquiring or disposing of positions, referred to in this report.
Scotiabank, its affiliates and any of their respective officers, directors and employees may from time to time take positions in currencies, act as managers, co-managers or underwriters of a public offering or act as principals or agents, deal in, own or act as market makers or advisors, brokers or commercial and/or investment bankers in relation to securities or related derivatives. As a result of these actions, Scotiabank may receive remuneration. All Scotiabank products and services are subject to the terms of applicable agreements and local regulations. Officers, directors and employees of Scotiabank and its affiliates may serve as directors of corporations.
Any securities discussed in this report may not be suitable for all investors. Scotiabank recommends that investors independently evaluate any issuer and security discussed in this report, and consult with any advisors they deem necessary prior to making any investment.
This report and all information, opinions and conclusions contained in it are protected by copyright. This information may not be reproduced without the prior express written consent of Scotiabank.
™ Trademark of The Bank of Nova Scotia. Used under license, where applicable.
Scotiabank, together with “Global Banking and Markets”, is a marketing name for the global corporate and investment banking and capital markets businesses of The Bank of Nova Scotia and certain of its affiliates in the countries where they operate, including; Scotiabank Europe plc; Scotiabank (Ireland) Designated Activity Company; Scotiabank Inverlat S.A., Institución de Banca Múltiple, Grupo Financiero Scotiabank Inverlat, Scotia Inverlat Casa de Bolsa, S.A. de C.V., Grupo Financiero Scotiabank Inverlat, Scotia Inverlat Derivados S.A. de C.V. – all members of the Scotiabank group and authorized users of the Scotiabank mark. The Bank of Nova Scotia is incorporated in Canada with limited liability and is authorised and regulated by the Office of the Superintendent of Financial Institutions Canada. The Bank of Nova Scotia is authorized by the UK Prudential Regulation Authority and is subject to regulation by the UK Financial Conduct Authority and limited regulation by the UK Prudential Regulation Authority. Details about the extent of The Bank of Nova Scotia's regulation by the UK Prudential Regulation Authority are available from us on request. Scotiabank Europe plc is authorized by the UK Prudential Regulation Authority and regulated by the UK Financial Conduct Authority and the UK Prudential Regulation Authority.
Scotiabank Inverlat, S.A., Scotia Inverlat Casa de Bolsa, S.A. de C.V, Grupo Financiero Scotiabank Inverlat, and Scotia Inverlat Derivados, S.A. de C.V., are each authorized and regulated by the Mexican financial authorities.
Not all products and services are offered in all jurisdictions. Services described are available in jurisdictions where permitted by law.