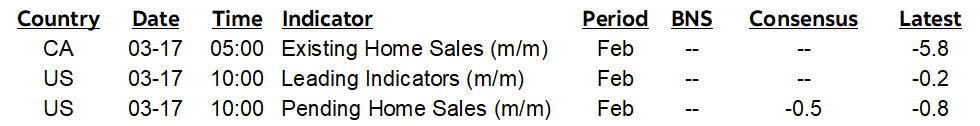
ON DECK FOR TUESDAY, MARCH 17th
KEY POINTS:
- Energy shock continues on the eve of major central bank decisions
- RBA hiked with unclear bias
- BI stands pat, leans more neutral/hawkish
- US tariffs and energy prices swamp the OBBBA tax cuts…
- …pointing to mounting downside risk to disposable incomes, spending and jobs
- Digging in for a long oil shock
- Why allies are rejecting the call for help
- Canadian home resales fell again amid a harsh winter and other factors
- US weekly ADP payrolls, pending home sales on tap
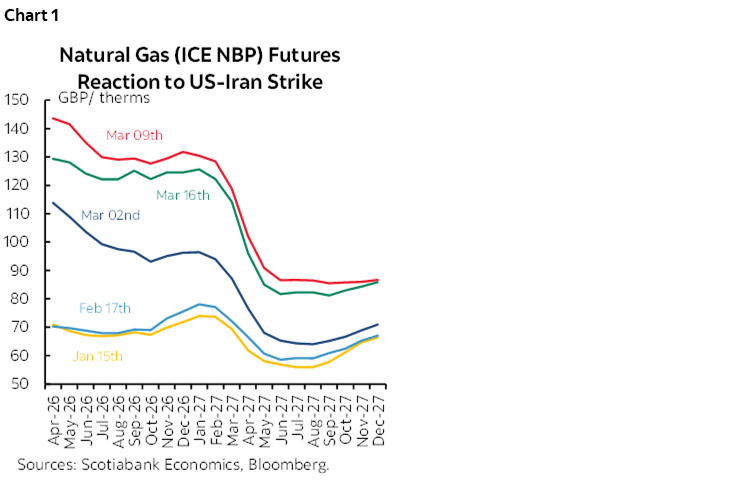
Another trading day is continuing the oscillating pattern of oil’s ups and downs. Today oil prices are up by about 3% with knock on effects across the suite of distillates. Chart 1 shows the UK’s natural gas futures curves and how they’ve evolved since the start of the year; prices are about double where they were and expected to remain around such heights for the next year. Equities are mixed with N.A. futures down by about ¼% or less, but European cash markets are generally a little higher. Currencies are mixed, and gold is flat. A pair of overnight central bank decisions drew relatively little reaction in local markets. Today’s markets will be sensitive to off-calendar and principally geopolitical developments ahead of the start of the week’s monepalooza festival including the Fed and BoC decisions tomorrow.
RBA HIKED WITH CAUTIOUS BIAS
Australia’s central bank hiked its cash rate target by 25bps to 4.1% overnight for the second hike this year. The decision wasn’t a shock but was not completely priced in advanced, and about 70% of consensus expected a hike. The 5–4 vote was close and when combined with the absence of a clear forward policy rate bias the result was a mild rally in Aussie rates as the curve bull flattened. The A$ rallied overnight. Markets lean toward pricing about half of another hike in May and under 50bps of cumulative additional tightening this year.
RBA Governor Bullock may have boxed herself in by declaring in advance that last night’s decision was going to be ‘live’ but the tight vote outcome implies she has more work to do in convincing her colleagues if she wishes to push ahead with further tightening in future. To not hike after saying what she did at the start of the month would have perversely eased financial conditions barring really hawkish language about the path forward which is unlikely. That would go against developments since she made her remarks while inflation is above target, job gains continue, and GDP growth has been decent.
The motivating concern for hiking was clearly elevated inflation and a concern that inflation could remain above target for longer than previously expected.
BANK INDONESIA HOLDS—PRESSURE MOUNTING FOR HIKES
Bank Indonesia held its policy rate unchanged at 4.75% as widely expected. The bias was incrementally hawkish as the previously statement-codified reference to an easing bias was struck out. A neutral stance has been adopted for now, with reference to a steady approach. The rupiah held little changed after the decision but the yield curve bear flattened with the 2-year yield up 7bps.
BI faces a difficult path forward. The main concern is financial instability particularly in the form of the constantly depreciating rupiah that is at an all-time low to the dollar. Intervention hasn’t exactly been a smashing success to date. Furthermore, Indonesian yields soared during the previous session as the government guided that staying under the deficit cap would be difficult to do; no doubt this is a partial offshoot of the inflation shock’s effects on program supports. Indonesia’s 2-year yield has soared by about 85bps since the start of March and 135bps since the low in November and is pricing material hikes. The case for a future tightening bias could be predicated upon imported inflation risk and controlling longer yields.
CANADIAN HOME RESALES FELL AGAIN
Canadian existing home sales fell by 1.3% m/m SA in February for the fourth straight decline and fifth in the past six months. Pick your driver, whether it be a really bad winter this year which may have hammered the last few months, or uncertainty, or no population growth, or that the only folks who move at this time of year in this climate do so either because they must or they’re masochists.
New listings fell 3.9% m/m and the sales-to-new-listings ratio climbed a bit to 47.6% (46.4% prior). Months supply was unchanged at the long-run average of five months. Quality adjusted prices were a little lower (-0.6% m/m SA) and are now down by -4.8% y/y.
LIGHT US DATA ON TAP
US weekly ADP private payrolls are due at 8:15amET following by pending home sales during February (10amET) that serve as a leading indicator for closed existing home sales.
US HOUSEHOLD INCOME TO DECLINE
The net effect of tariffs, tax cuts and the energy price spike put in play a drop in after-tax household incomes and spending this year. That was already the case before the energy price surge which has compounded the negative net effects.
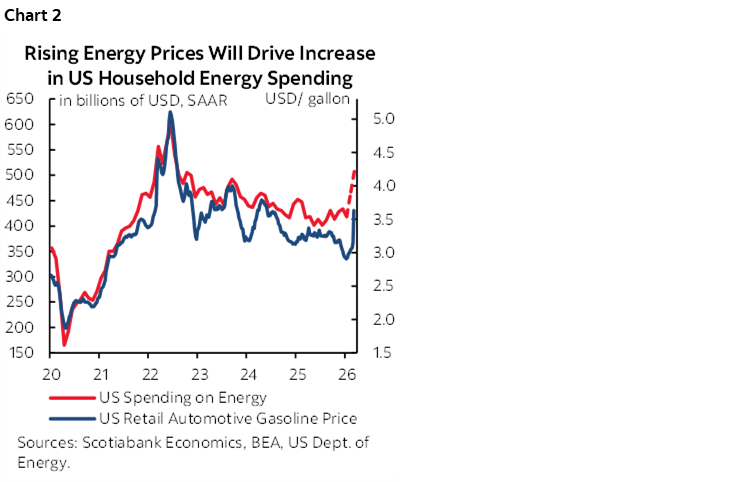
A very conservative estimate of the impact of higher energy prices on household spending is shown in chart 2. If gasoline prices were to stay around where they are now, then it could translate into a permanent increase of about US$100 billion in the amount households spend on gasoline and other energy needs. That’s only using the correlation between gas prices and what households spend directly on gasoline and other energy needs. There are bound to be additional effects of higher energy prices on categories like the utilities, and wherever pass through occurs in other categories of spending.
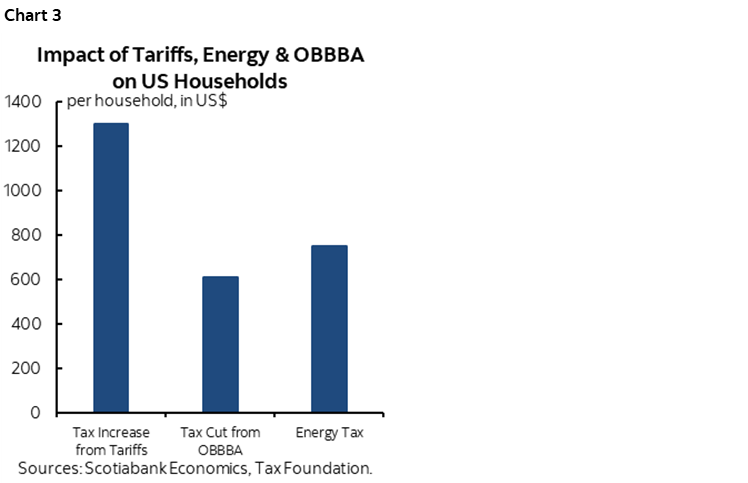
Then enter chart 3 that shows that the estimated impact of higher tariffs swamps the estimated impact of the OBBBA tax cuts for the average household. It also adds the conservatively estimated impact of higher household spending on energy that for about 133 million households equates to spending about an extra US$750. On net, the estimated roughly $600 tax cut per household is swamped by roughly $2k more spent on tariffs and energy.
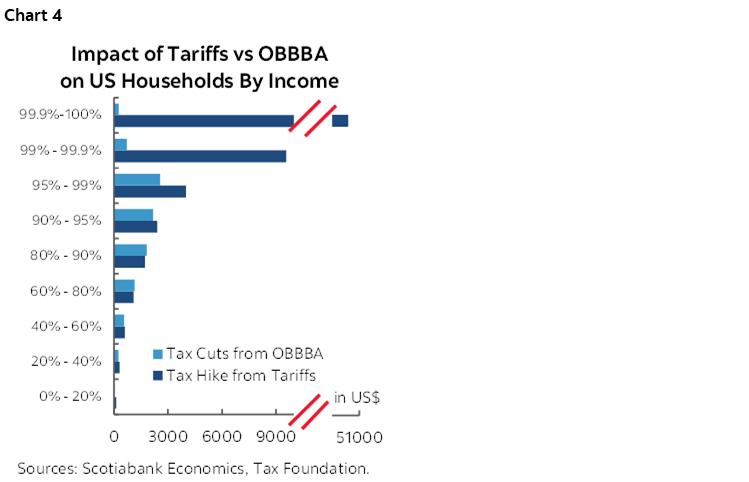
The effects are likely to be highly regressive on net, which is bad for US consumption given that lower- and middle-income households have higher propensities to consumer out of income. Chart 4 is a reminder of one group’s estimated net impact of tariffs and OBBBA tax cuts on household income by cohort.
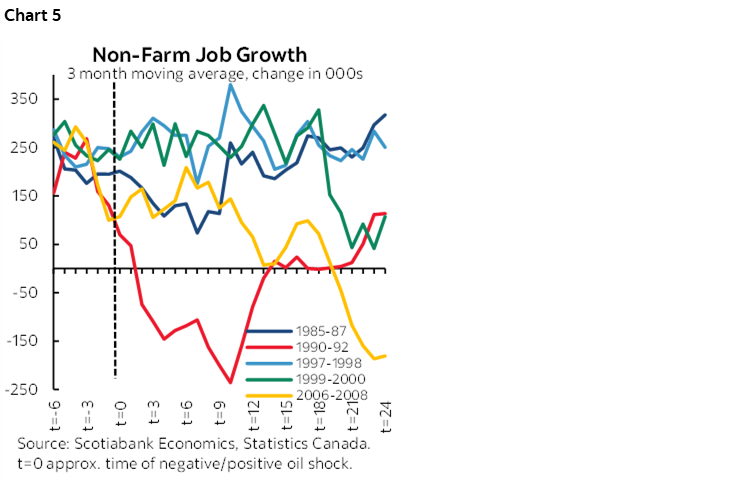
The math overwhelmingly points toward tariffs and the energy price shock swamping the benefits of the One Big Beautiful Bill Act’s tax cuts. That will crowd out other forms of spending and with it cause knock on effects on employment. Chart 5 shows what has happened to nonfarm payrolls during past oil shocks with this one having as its closest parallel the 1990–92 period.
Key is how long this energy price shock may persist. I’m increasingly leaning toward a very prolonged shock.
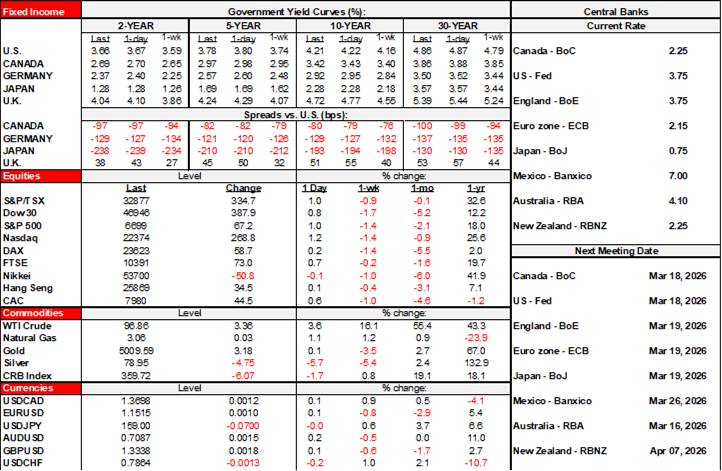
For one approach, there is some value in listening to markets versus randomly pulling assumptions out of thin air. Futures markets are leaning further toward a long-lived energy price shock including oil (chart 6), gasoline (chart 7), and natural gas that is highly seasonal but pointing toward materially higher seasonal peaks into 2027 than future years (chart 8). In all cases, markets are leaning toward elevated prices through to next year and well above where they were before speculation about war with Iran started to pick up in January.
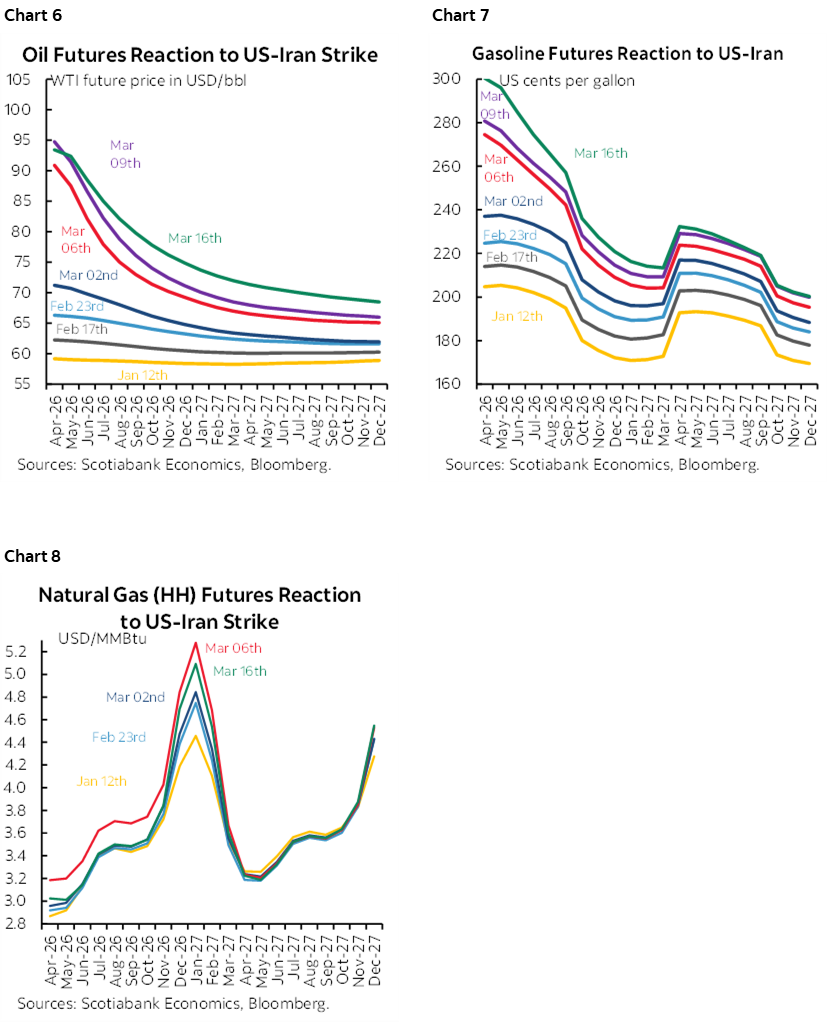
Futures curves in normal backwardation do not necessarily translate into accurate expectations for future spot prices, but they’re a starting point. In this case, the futures curves make some intuitive sense.
Unless the terms that define success change dramatically and with their own political costs, then my assumption is that we’re staring at an oil shock that will persist for an extended period and throughout our rolling two-year forecast horizon.
You can tell as much in the US administration’s tone. It’s a curious combination of ‘woo hoo, we’ve won’ and ‘uh oh, send help’ absent any use of please and thank you. This only reinforces that the duration of the conflict is likely to be much longer yet and with no obvious exit.
The fact is the US and Israel are not winning. Iran has for all intents and purposes an unlimited supply of drones to use against its opponents with Russia’s help and against regional energy infrastructure. Threatening to demolish Kharg Island would hurt Iran but hurt US consumers and voters more in a classic pyrrhic outcome. The US and Israel have not secured the enriched uranium stockpiles. They have not made any inroads toward stopping Iran’s efforts toward securing a nuclear weapon which was the initial stated aim. They would need large numbers of boots on the ground to achieve this aim which costs $$$ and is politically even costlier.
So either some reason for retreating is invented by the Americans and Israelis without achieving the main goal they set out to accomplice, or the war is going to intensify or the Americans and Israelis just keep hopelessly pounding Iran which in turn keeps hopelessly attacking regional energy infrastructure to keep energy prices high into the US midterms in what amounts to a protracted stalemate.
And no, there will be no help coming. In fact, here are my top reasons why other countries including NATO members are not chomping at the bit to join Trump’s war on Iran and they’re important to lay out as part of the assumptions around the whole framework of thinking:
1. Article 5 of the NATO treaty only requires members to come to the defence of another member that has been attacked. No member was attacked. The US and Israel attacked Iran. Therefore, there is no treaty obligation and the allies need to be careful not to abuse the original intent of the Treaty.
2. They don’t believe in the war and/or don’t understand the goals and how to define success.
3. They don’t believe that the war’s aims—namely fully eradicating Iran’s nuclear program—can be achieved.
4. Trump alienated himself among allies with his various attacks (tariffs, Greenland, unprovoked insults interference in political affairs abroad etc). The US administration is discovering there is a cost at times of crisis.
5. They fear setting a precedent for coming to the aid of what they may perceive to be hegemonic ambitions. Today it's Iran, yesterday it was Venezuela, tomorrow it’s Cuba on the back of Trump’s remarks overnight, and/or Greenland, and/or Canada, and/or Lebanon, and/or Colombia etc.
6. Allies fear that the aim to securing their involvement is to spread the blame should failure strike. Many administrations are on shaky political ground even without joining war efforts and don’t need the added headache of explaining a failed military venture. Think Starmer, Macron, Merz, Carney (although he’s likely facing a razor-thin majority in a month and is not a great power), etc.
7. Not all allies are directly exposed to Persian Gulf oil. Iran appears to be giving passes in the Strait of Hormuz to countries that are directly exposed and viewed as friendlier.
8. Allies may expect to be drawn more heavily into the Ukraine conflict if the US withdraws support either as retaliation for not helping against Iran and/or because of the mounting toll of the war with Iran on the US. They may see a need to spare resources elsewhere.
9. The allies rushing in to join the US and Israel would sharply raise the risk of more direct involvement by other opposing states, namely, Russia, possibly China, among others.
10. Allies need to be careful toward other geopolitical theaters and not spread themselves too thinly (e.g. Taiwan etc).
DISCLAIMER
This report has been prepared by Scotiabank Economics as a resource for the clients of Scotiabank. Opinions, estimates and projections contained herein are our own as of the date hereof and are subject to change without notice. The information and opinions contained herein have been compiled or arrived at from sources believed reliable but no representation or warranty, express or implied, is made as to their accuracy or completeness. Neither Scotiabank nor any of its officers, directors, partners, employees or affiliates accepts any liability whatsoever for any direct or consequential loss arising from any use of this report or its contents.
These reports are provided to you for informational purposes only. This report is not, and is not constructed as, an offer to sell or solicitation of any offer to buy any financial instrument, nor shall this report be construed as an opinion as to whether you should enter into any swap or trading strategy involving a swap or any other transaction. The information contained in this report is not intended to be, and does not constitute, a recommendation of a swap or trading strategy involving a swap within the meaning of U.S. Commodity Futures Trading Commission Regulation 23.434 and Appendix A thereto. This material is not intended to be individually tailored to your needs or characteristics and should not be viewed as a “call to action” or suggestion that you enter into a swap or trading strategy involving a swap or any other transaction. Scotiabank may engage in transactions in a manner inconsistent with the views discussed this report and may have positions, or be in the process of acquiring or disposing of positions, referred to in this report.
Scotiabank, its affiliates and any of their respective officers, directors and employees may from time to time take positions in currencies, act as managers, co-managers or underwriters of a public offering or act as principals or agents, deal in, own or act as market makers or advisors, brokers or commercial and/or investment bankers in relation to securities or related derivatives. As a result of these actions, Scotiabank may receive remuneration. All Scotiabank products and services are subject to the terms of applicable agreements and local regulations. Officers, directors and employees of Scotiabank and its affiliates may serve as directors of corporations.
Any securities discussed in this report may not be suitable for all investors. Scotiabank recommends that investors independently evaluate any issuer and security discussed in this report, and consult with any advisors they deem necessary prior to making any investment.
This report and all information, opinions and conclusions contained in it are protected by copyright. This information may not be reproduced without the prior express written consent of Scotiabank.
™ Trademark of The Bank of Nova Scotia. Used under license, where applicable.
Scotiabank, together with “Global Banking and Markets”, is a marketing name for the global corporate and investment banking and capital markets businesses of The Bank of Nova Scotia and certain of its affiliates in the countries where they operate, including; Scotiabank Europe plc; Scotiabank (Ireland) Designated Activity Company; Scotiabank Inverlat S.A., Institución de Banca Múltiple, Grupo Financiero Scotiabank Inverlat, Scotia Inverlat Casa de Bolsa, S.A. de C.V., Grupo Financiero Scotiabank Inverlat, Scotia Inverlat Derivados S.A. de C.V. – all members of the Scotiabank group and authorized users of the Scotiabank mark. The Bank of Nova Scotia is incorporated in Canada with limited liability and is authorised and regulated by the Office of the Superintendent of Financial Institutions Canada. The Bank of Nova Scotia is authorized by the UK Prudential Regulation Authority and is subject to regulation by the UK Financial Conduct Authority and limited regulation by the UK Prudential Regulation Authority. Details about the extent of The Bank of Nova Scotia's regulation by the UK Prudential Regulation Authority are available from us on request. Scotiabank Europe plc is authorized by the UK Prudential Regulation Authority and regulated by the UK Financial Conduct Authority and the UK Prudential Regulation Authority.
Scotiabank Inverlat, S.A., Scotia Inverlat Casa de Bolsa, S.A. de C.V, Grupo Financiero Scotiabank Inverlat, and Scotia Inverlat Derivados, S.A. de C.V., are each authorized and regulated by the Mexican financial authorities.
Not all products and services are offered in all jurisdictions. Services described are available in jurisdictions where permitted by law.