ON DECK FOR THURSDAY, JUNE 4th
KEY POINTS:
- Bots drive oil and bond yields lower, equities weighed down by tech
- US job cuts increased last month…
- ...while claims stayed low…
- ...and Revelio’s often misleading nonfarm signal was buoyant
- Riksbank hike pricing jolted higher by CPI
- Swiss inflation remains tame
- Won’s tumble is courting stability risks…
- …and has plenty of company in Southeast Asia
- BoE’s Bailey on tap
- Putting a mirror in front of US forced labour tariffs…
- …and how little they would change for Canada
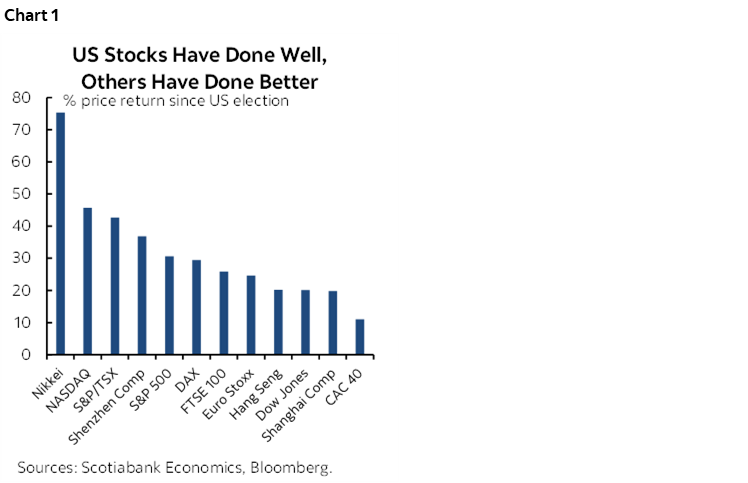
Today the war is ending. Previous days not so much. Of course, that depends upon who or what you believe. For now, oil is off by just over $3/barrel and the bots are cheering by driving global sovereign bond yields lower by 1–5bps or so across benchmarks and with the US Treasury market outperforming others. Stocks aren’t having any of it as S&P futures are off by about ½%, Nasdaq futures are down by over 1%, TSX futures are little changed and European cash markets are mixed. US equity softness is primarily driven by tech earnings and concerns about AI-driven gains. Chart 1 updates tracking of gains across global equity benchmarks; note that despite the Trump 2.0 attacks on Canada that the TSX continues to outperform the S&P500 since the US election.
The USD is broadly softer particularly against the krona after a Swedish inflation surprise (see below) and with the exception of the won that tumbled by about 1% to the dollar overnight.
Southeast Asian nations continue to grapple with tumbling currencies. The won is no winner as it has depreciated to its weakest exchange rate to the dollar since 2009, prompting authorities to threaten more action which hasn’t worked to date and which may not be able to wait until the Bank of Korea’s next decision on July 16th. They’re not alone. The rupiah has been as weak as the won since the war broke out, so has the Philippine peso and the Indian rupee, Thai baht and Malaysian ringgit are also weakening. Monitor this closely for financial stability risks and action by governments and central banks as the oil and war shocks ripple through their financial systems.
There were light overnight developments including US layoffs, Swedish and Swiss inflation, comments by the RBA Governor and pending remarks by BoE Governor Bailey. I’ve included thoughts on US forced labour tariffs below.
OVERNIGHT DEVELOPMENTS
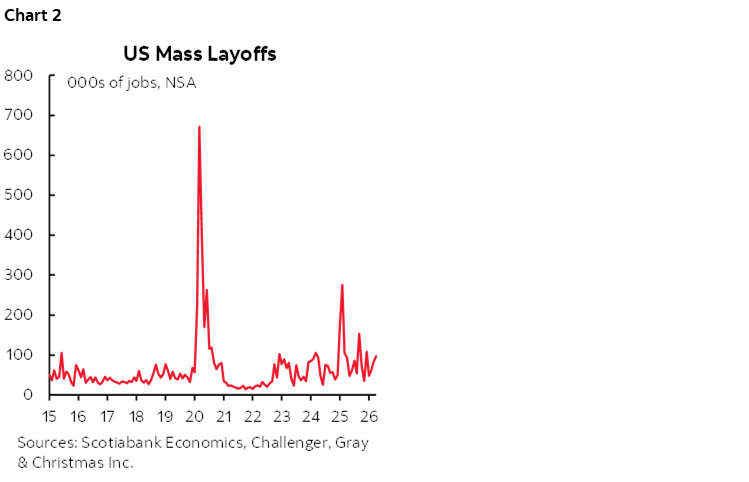
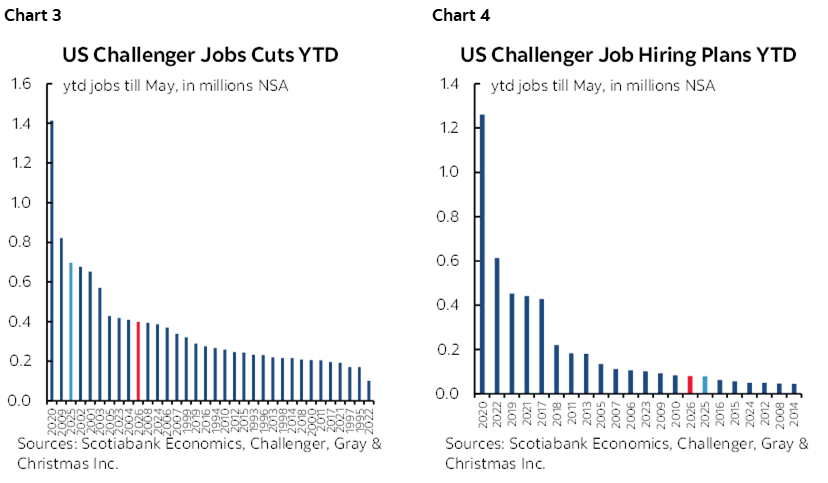
US Challenger job cuts climbed to 97k in May from about 83k in April. The figures are seasonally unadjusted but it’s the highest reading since January, although not particularly alarming in terms of the trend (chart 2). Charts 3 and 4 show how this year is stacking up in terms of year-to-date comparisons of job cuts and hiring. Cuts are higher than average but nowhere close to the highs, while hiring activity is toward record lows.
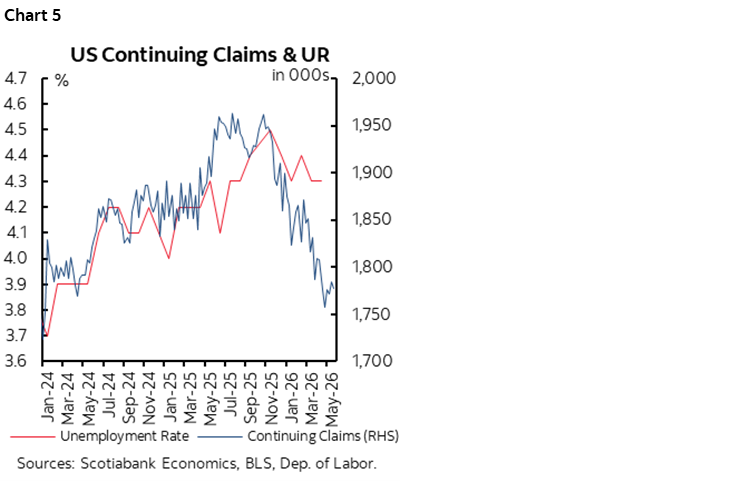
Initial jobless claims increased 10k to 225k last week but remain low, while continuing claims were little changed at 1.777 million from 1.785 million previously. The decline in continuing claims woudl ordinarily mean a lower unemployment rate but there may be a disconnect now given policy changes and labour market changes (chart 5).
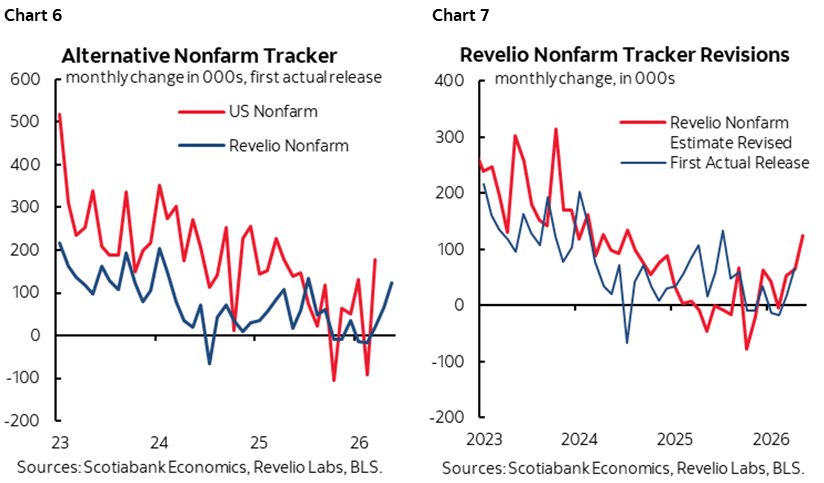
Revelio’s nonfarm estimate was up by 123,700 jobs last month. Don’t bet your pay on it being a good nonfarm guide, however, given a) soft historical connections between the initial pre-revision estimates for both measures (chart 6) and given Revelio’s issue with frequently large revisions (chart 7). It’s an overstated guide to nonfarm in terms of usefulness.
RBA Governor Bullock’s Senate testimony was not impactful to market pricing for future moves. Markets continue to price about half of a 25bps hike by August after skipping in June, and only 25bps in total over the coming year. She said they are seeing early signs that hikes are working which indicates some breathing room, but that persistent inflation would require more of a response which will take time to assess.
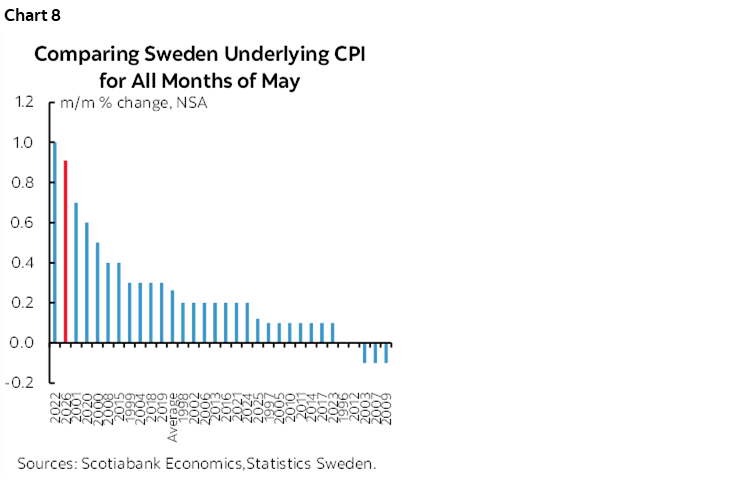
Riksbank hike pricing got an upward jolt thanks to hotter than expected CPI in May. CPI was up by 1% m/m in May (0.7% consensus) with underlying inflation ex-energy climbing by 0.7% m/m (0.4% consensus) which was relatively hot compared to all prior months of May (chart 8). That threw local traders into action such that while still expecting no move on June 17th, two-thirds of a 25bps hike is priced for August and a full hike is expected in September.
Swiss inflation was a calmer affair. It was up by 0.2% m/m (0.3% consensus) and with core inflation up by just 0.3% y/y (yes, y/y). One consideration may be currency strength limiting imported inflation; the franc has gained about 14% to the dollar since the start of last year.
Bank of England Governor Bailey speaks at 11:40amET this morning ahead of the June 18th decision that is priced for no action. He’ll speak again tomorrow. The BoE is in patient mode awaiting further signs on the duration of the Iran conflict and second-round effects on inflation.
PUTTING A MIRROR IN FRONT OF US FORCED LABOUR TARIFFS
So, the US wants to talk about forced labour abuses in production. Righto. Now don’t get wrong, it’s a serious issue and the often heralded poster child of the matter is China’s treatment of the Uyghurs and examples like Xinjiang internment camps. That is an extreme example of brutality in commerce, and the world should take a principled stance against it. The West’s value system cannot allow its workers to be displaced by abusive employment practices abroad and particularly by an undemocratic state.
Yet how to define forced labour in production is somewhat of a malleable concept. For example, the International Labour Organization defines it as “all work or service which is exacted from any person under the threat of penalty and for which the person has not offered himself or herself voluntarily.” Having to write my weekly rant on Fridays apparently doesn’t qualify. The definition of ‘penalty’ is broad, and involuntariness is defined as the free and informed consent of a worker to take a job and his or her freedom to leave at any time (here).
We can debate whether that should be the limited definition. Some examples are obvious, some less so. For instance, the US allows private firms to employ prison labour in the production of goods and requires they be paid only under 40 cents per hour while producing what some estimate to be billions in goods and services each year (here). America has the highest prison population per capita of any industrialized nation and is only surpassed by great bastions of democratic freedoms like, oh, Cuba, El Salvador and Turkmenistan (here). There are almost 2 million folks in prison in the US. You do the crime, you do the time and work for it in my books, but this practice seems to fall under the ILO’s definition of forced labour since they can’t well just leave prison and there is very likely an implied threat of penalty one way or the other. Nice racket, incarcerate more people than almost anywhere else within a system of fairly extreme inequalities and make them work for no pay.
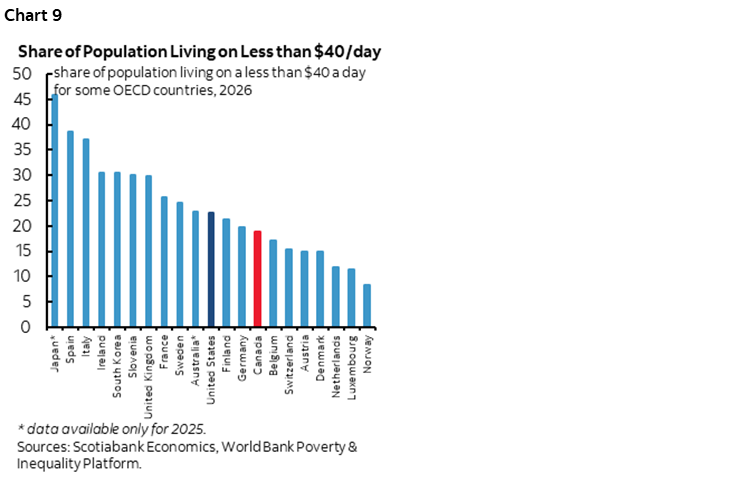
Take another example. Does the US ranking on the share of workers making below $40/day qualify (chart 9)? More Americans work under reasonable (or not…) wages than in Canada but is middle of the pack in a wide range of economies. Technically they’re not penalized and technically they are free to leave their jobs. And then there is reality during economically pressured times especially for the lower end of pay scales that technically must eat, technically must have shelter and technically should have the means of subsistence at its disposal.
So, does a country’s overall labour market structure and system of values qualify as a framework for defining the share of people in a particular system who have few choices to make a reasonable standard of living and hence offer an unfair competitive advantage in commerce? The US economy has many things in its favour, but there is an argument to be made for how it employs a lot of cheap labour under poverty conditions in a system that is replete with subsidies more so than other industrialized economies as I’ve long argued with facts on international comparisons on many occasions. Virtue signalling can be a quagmire of hypocritical stances.
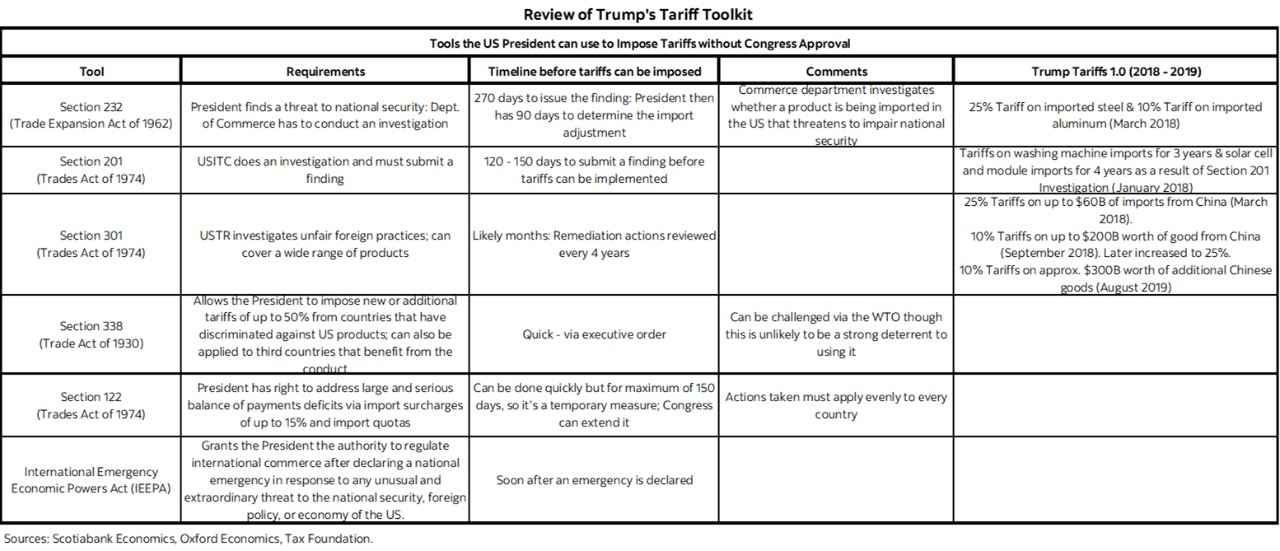
It’s also a ruse as a justification for the latest US tariff threat. The Trump administration is serially abusing past pieces of legislation in terms of their intent in order to justify ill-conceived tariffs as a tax on American consumers and businesses to fund other tax cuts it cannot afford while ramping up debt to the moon. Those pieces of legislation are summarized in the table at the back of this note. The Trump administration ludicrously labelled Canadians as mules and human traffickers in order to justify abusing other pieces of legislation while imposing tariffs and the Supreme Court shot down the use of IEEPA tariffs. Now forced labour is the cause du jour because the US administration said in March that the administration would launch trade ‘investigations’—a kangaroo court of sorts—and with the motive being to replace IEEPA tariffs with others driven by different excuses.
But rest easy. The facilitating piece of legislation under Section 301 of the Trade Act of 1974 is being threatened—not yet implemented—and we don’t have an executive order with any further details yet. When IEEPA tariffs were struck down the US moved toward 10% worldwide tariffs using Section 122 of the 1974 Trade Act but as the accompanying table shows they can only be in place for 150 days unless extended by Congress which seems unlikely. Hence the search for something else.
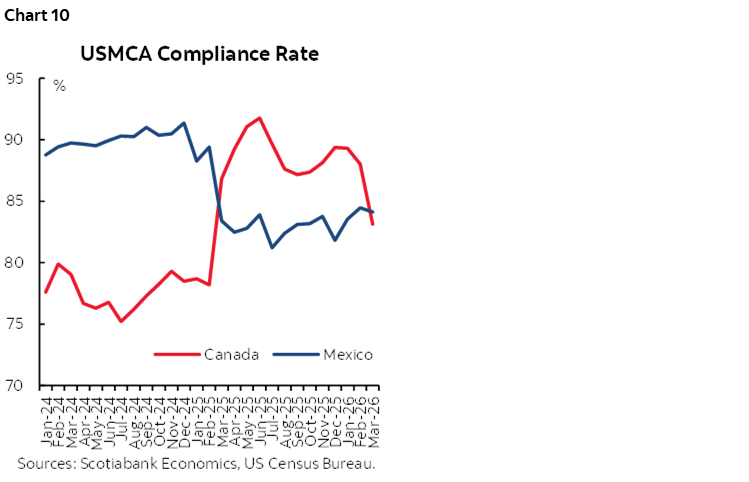
We understand that the tariff would continue to exempt goods that are compliant with the CUSMA/USMCA trade agreement plus some other exemptions. Since almost 90% of goods exports from Canada to the US are compliant (chart 10) this means that—if implemented—then the effective tariff shock to Canada would be only about 1% in weighted terms. It swaps out IEEPA for Section 301 with probably no net new impact.
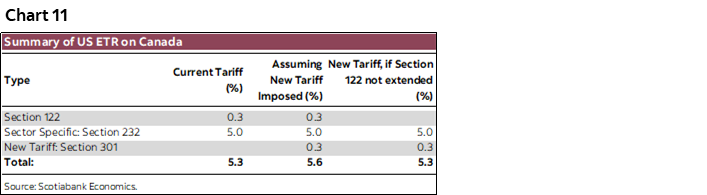
This means that the effective tariff rate on Canadian goods exports to the US would probably remain around 5.3% (chart 11). This is composed of Section 122 tariffs on all goods except those that are CUSMA/USMCA compliant and excluding sector specific goods (0.3%), plus sector specific tariffs under Section 232 with different rates on different goods but equalling about 5% in an overall weighted sense.
All of which is subject to ongoing negotiations. Canada is quite frankly jumping through hoops to appease the US administration despite the PM’s tough talk in speeches. For example, there was yesterday’s development that the Carney administration has ordered the CRTC—a communications regulator—to review its policy that would triple the share of Canadian revenues that that streaming companies would have to allocated to the production of Canadian programming to 15%. Canada is also moving to strengthen forced labour legislation.
There are many moving parts in the negotiations to be continually monitored but the main message here is that the effective tariff rate is likely to be unchanged by the Section 301 moves. Canada still retains the lowest effective tariff rate charged against any of America’s trading partners and by a very wide margin. Despite the tough talk from Washington, they are not messing with the CUSMA compliance carve-out. And this is all manageable through a currency that has depreciated from about 1.20 USDCAD in 2021 to about 1.39 now. Increased price competitiveness as the currency serves as a shock absorber combined with the pull effect of US growth continues to offer considerable support to Canadian exporters outside of the narrow subset of the industries most impacted by tariffs (eg. steel).
DISCLAIMER
This report has been prepared by Scotiabank Economics as a resource for the clients of Scotiabank. Opinions, estimates and projections contained herein are our own as of the date hereof and are subject to change without notice. The information and opinions contained herein have been compiled or arrived at from sources believed reliable but no representation or warranty, express or implied, is made as to their accuracy or completeness. Neither Scotiabank nor any of its officers, directors, partners, employees or affiliates accepts any liability whatsoever for any direct or consequential loss arising from any use of this report or its contents.
These reports are provided to you for informational purposes only. This report is not, and is not constructed as, an offer to sell or solicitation of any offer to buy any financial instrument, nor shall this report be construed as an opinion as to whether you should enter into any swap or trading strategy involving a swap or any other transaction. The information contained in this report is not intended to be, and does not constitute, a recommendation of a swap or trading strategy involving a swap within the meaning of U.S. Commodity Futures Trading Commission Regulation 23.434 and Appendix A thereto. This material is not intended to be individually tailored to your needs or characteristics and should not be viewed as a “call to action” or suggestion that you enter into a swap or trading strategy involving a swap or any other transaction. Scotiabank may engage in transactions in a manner inconsistent with the views discussed this report and may have positions, or be in the process of acquiring or disposing of positions, referred to in this report.
Scotiabank, its affiliates and any of their respective officers, directors and employees may from time to time take positions in currencies, act as managers, co-managers or underwriters of a public offering or act as principals or agents, deal in, own or act as market makers or advisors, brokers or commercial and/or investment bankers in relation to securities or related derivatives. As a result of these actions, Scotiabank may receive remuneration. All Scotiabank products and services are subject to the terms of applicable agreements and local regulations. Officers, directors and employees of Scotiabank and its affiliates may serve as directors of corporations.
Any securities discussed in this report may not be suitable for all investors. Scotiabank recommends that investors independently evaluate any issuer and security discussed in this report, and consult with any advisors they deem necessary prior to making any investment.
This report and all information, opinions and conclusions contained in it are protected by copyright. This information may not be reproduced without the prior express written consent of Scotiabank.
™ Trademark of The Bank of Nova Scotia. Used under license, where applicable.
Scotiabank, together with “Global Banking and Markets”, is a marketing name for the global corporate and investment banking and capital markets businesses of The Bank of Nova Scotia and certain of its affiliates in the countries where they operate, including; Scotiabank Europe plc; Scotiabank (Ireland) Designated Activity Company; Scotiabank Inverlat S.A., Institución de Banca Múltiple, Grupo Financiero Scotiabank Inverlat, Scotia Inverlat Casa de Bolsa, S.A. de C.V., Grupo Financiero Scotiabank Inverlat, Scotia Inverlat Derivados S.A. de C.V. – all members of the Scotiabank group and authorized users of the Scotiabank mark. The Bank of Nova Scotia is incorporated in Canada with limited liability and is authorised and regulated by the Office of the Superintendent of Financial Institutions Canada. The Bank of Nova Scotia is authorized by the UK Prudential Regulation Authority and is subject to regulation by the UK Financial Conduct Authority and limited regulation by the UK Prudential Regulation Authority. Details about the extent of The Bank of Nova Scotia's regulation by the UK Prudential Regulation Authority are available from us on request. Scotiabank Europe plc is authorized by the UK Prudential Regulation Authority and regulated by the UK Financial Conduct Authority and the UK Prudential Regulation Authority.
Scotiabank Inverlat, S.A., Scotia Inverlat Casa de Bolsa, S.A. de C.V, Grupo Financiero Scotiabank Inverlat, and Scotia Inverlat Derivados, S.A. de C.V., are each authorized and regulated by the Mexican financial authorities.
Not all products and services are offered in all jurisdictions. Services described are available in jurisdictions where permitted by law.