ON DECK FOR WEDNESDAY, JUNE 3rd
KEY POINTS:
- Oil, Ueda drive bond yields up
- BoJ’s Ueda left the door wide open to a June hike
- US JOLTS was actually a poor report despite the headline
- US vehicle sales increased, Canadian sales fell
- US ADP, ISM-services, Beige Book on tap
- Keep calm about CUSMA negotiations
- Trump on Canada—pot calling the kettle black
- Canadian productivity and living standards
- US Nonfarm preview—all about births and deaths
- Aussie rates shake off GDP
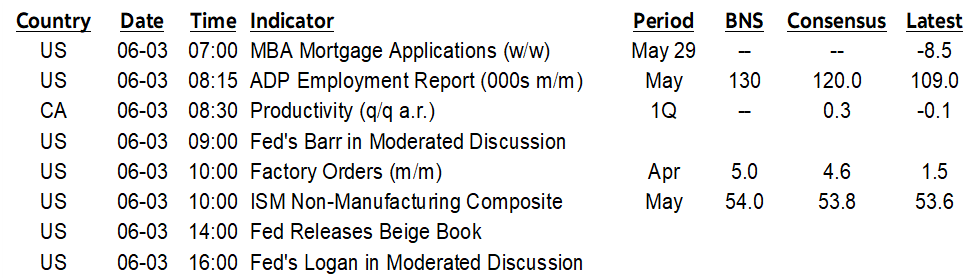
Oil is up again as only Trump appears to believe that a ‘deal’ to end the war is in the works. There were more attacks overnight. Oil prices are higher by almost $3/barrel this morning. WTI has risen by almost US$10/barrel since the May 29th low and Brent is up by about US$7 since the low. The WTI futures curve remains at the highs of the war (chart 1) and continues to understate risks to future oil prices in what is more likely to be a much flatter and higher curve.
As a result, sovereign yields are rising again with most global benchmarks up by 2–6bps. A speech by BoJ Governor Ueda is also contributing to the global bond sell off after he left the door open for a hike on June 16th by warning about inflation risks that “appear to be greater overall and are likely to emerge sooner” while indicating uncertainty won’t hold back a fulsome discussion of the pros and cons of hiking.
Equities are playing defence with S&P futures and most European cash markets in the red but TSX futures holding firm. The dollar is mixed, but little changed against major crosses.
There is modest US data risk on tap today and summarized below along with an explanation of why most folks misinterpreted the large jump in US JOLTS job openings. I’ve also shared a shorter nonfarm preview that normal given the absence of a weekly due to heavy travel.
US PRE-NONFARM DATA DUMP
Several US data releases are due this morning after recaps of some points about yesterday’s releases that may be useful.
- JOLTS was weak: Much of the reaction to yesterday’s US JOLTS report was misplaced. It was a bad report despite the m/m rise in job openings of about three-quarters of a million in April. On the surface, job openings climbed to 7.618 million from a slightly revised 6.877 million. That sudden jump, however, was almost entirely fed by the professional/business services category that accounted for 91% of the m/m rise in total job postings. There was no breadth beyond that one category.
- US vehicle sales: They posted a negligible gain in May in the late-day release from yesterday. They landed at 16.08 million at a seasonally adjusted and annualized rate (15.92 prior, 16.0 consensus, 16.2 Scotia). The 1% m/m SA gain will only contribute 0.1–0.2% to m/m retail sales in May.
- ADP payrolls: The four-week moving average of about 35k/week suggests monthly ADP payrolls could rise by around 140k (8:15amET). A challenge is that ADP revises its weekly tallies and doesn’t issue the latest week when they offer the monthly figure, which means that there can be surprises. Consensus sits at 120k with a trimmed range from about 100–150k and I’m at 130k.
- US ISM-services: May’s reading (10amET) is guessed to be little changed at just under 54.0 which would continue ongoing moderate growth in the services sector. Watch prices paid that are soaring. Strength in new orders in both the ISM-mfrg and ISM-services reports likely reflects temporary order front-running ahead of expected pass through of price increases.
- Factory orders: The 10amET update for April will be a strong report. We already know that durable goods orders surged by 7.9% m/m SA mostly due to transportation with ex-transportation orders up by 1.1%. That said, core capital goods orders (ex-defence and air) fell by 1.1% m/m. Nondurable goods orders will be revealed for the first time in this morning’s total factory orders report and most expect total orders to be up by 4–5% as nondurables offset durables.
- Fed’s Beige Book (2pmET): The summary of regional economic conditions reported through District banks will inform anecdotes but harkens back to a bygone era when it was more useful because Fed officials spoke less often.
CANADA-US-MEXICO TRADE NEGOTIATIONS—POT CALLING THE KETTLE BLACK
CUSMA/USMCA negotiations are intensifying. So far, it seems to be a similar playbook to the last time during Trump 1.0. That means fade headlines and strident demands—let alone puerile insults—as the same approach of trying to divide Canada and Mexico as during Trump 1.0 is in play. The only headlines that matter are the ones resulting from the final deal.
I will say, however, that the President of a country whose economy has been in a marked slowdown shouldn’t be wagging an insulting finger at Canada’s economy that is in a soft patch. US GDP only grew by 0.5% q/q SAAR in Q4 and 1.6% q/q SAAR in Q1. 2025Q2–Q3 GDP growth was strong as order front-running and AI helped but it has since lost momentum due to the administration’s economic policies. There has been essentially no material disposable income growth in inflation-adjusted terms for the past three quarters and real wages are entering a period in which they’ll be squeezed, damaging the consumer. I’ve argued this point—that the President’s policies are holding back a remarkable underlying economic performance—for a long time now but enjoyed The Economist’s take on the same issue recently.
Then again, he was egged on by irresponsible tabloid-style reporting by an expensive service upon which the street relies for more credible, dispassionate reporting.
AUSSIE RATES SHAKE OFF GDP
Australia’s economy grew by 0.3% q/q SA nonannualized (0.4% consensus). There was no material reaction in Australia’s short-term rates to the release as yields had already climbed moments before at the open. Consumer spending was up by 0.5% q/q SA nonannualized and contributed about a weighted quarter-point to GDP growth. Total investment grew by 3% with non-mining investment adding over ¾% to growth in weighted terms with data centers playing a significant role. Net trade was a weighted drag of 0.8% with imports surging partly to drive data center investment. Inventories contributed nothing and nothing material came from housing.
CANADIAN PRODUCTIVITY
Stop giggling. Yes, it’s true, labour productivity is not a Canadian strength. The Q1 update (8:30amET) isn’t likely to change that on a dime.
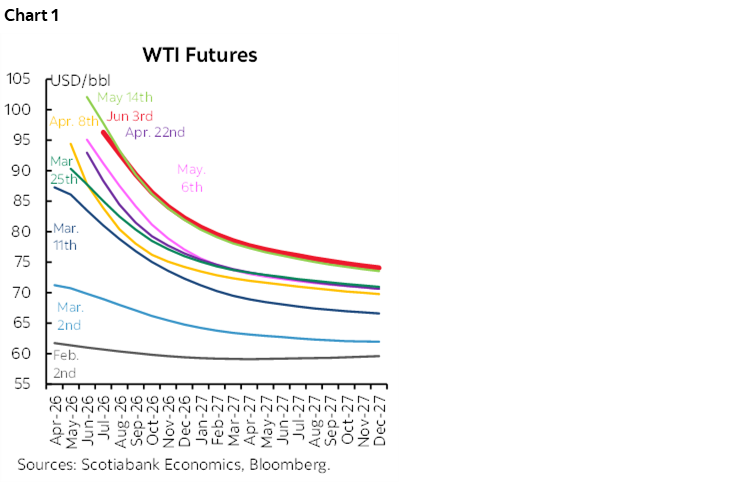
Still, it feeds into what may drive per capita GDP going forward. Over the years, I have argued that the focus upon per capita GDP was exaggerated in part. Some of it reflected moribund productivity growth but some of it reflected a temporary population overshoot through mismanaged immigration policy. The latter period has faded and is driving a rebound (chart 2). It would be nice if the folks who went too far with their alarmist remarks were to acknowledge this now.
CANADIAN VEHICLE SALES CONTINUE TO DECLINE
Canadian vehicle sales posted a fourth consecutive monthly decline in May according to Desrosiers that put the numbers on its website last evening when few were watching. The decline of a little over -2% m/m SA was modest but the trend from peak sales in January appears to be a total decline approaching 15%. Admittedly that’s coming off a temporary peak and factors like harsher than usual winter and Spring weather may have been among the factors that held sales back somewhat.
NONFARM PREVIEW
Nonfarm payrolls for the month of May arrive on Friday (8:30amET) along with the unemployment rate derived from the companion household survey. I’ve guesstimated a payroll gain of 125k with an unchanged unemployment rate of 4.3%. Consensus is at 85k with a UR of 4.3%. The consensus range cuts from about 50k to 125k with about 30% of estimates roughly at or above 100k.
The 90% confidence band around estimated changes in nonfarm payrolls is about +/-122,000. Some forecasters don’t like to point this out, but it only feels professionally responsible to do so even as a top-ranked forecaster. There is a lot of noise around the report and there are some quirky methodological issues that separate nonfarm from other job market readings. Here’s a rundown of some of the drivers.
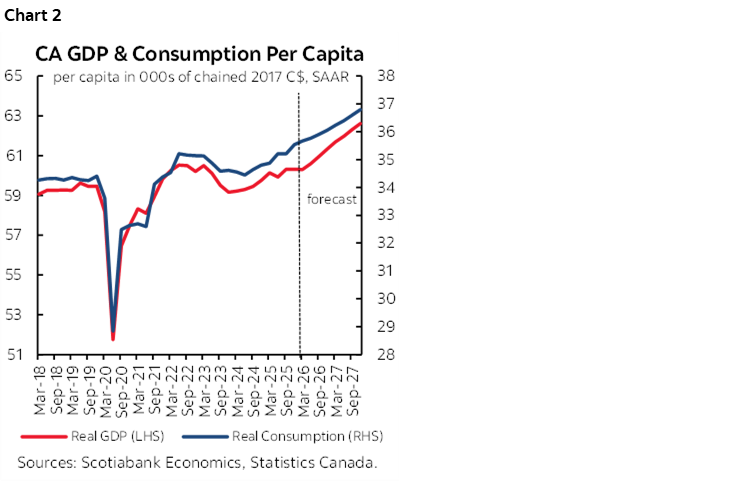
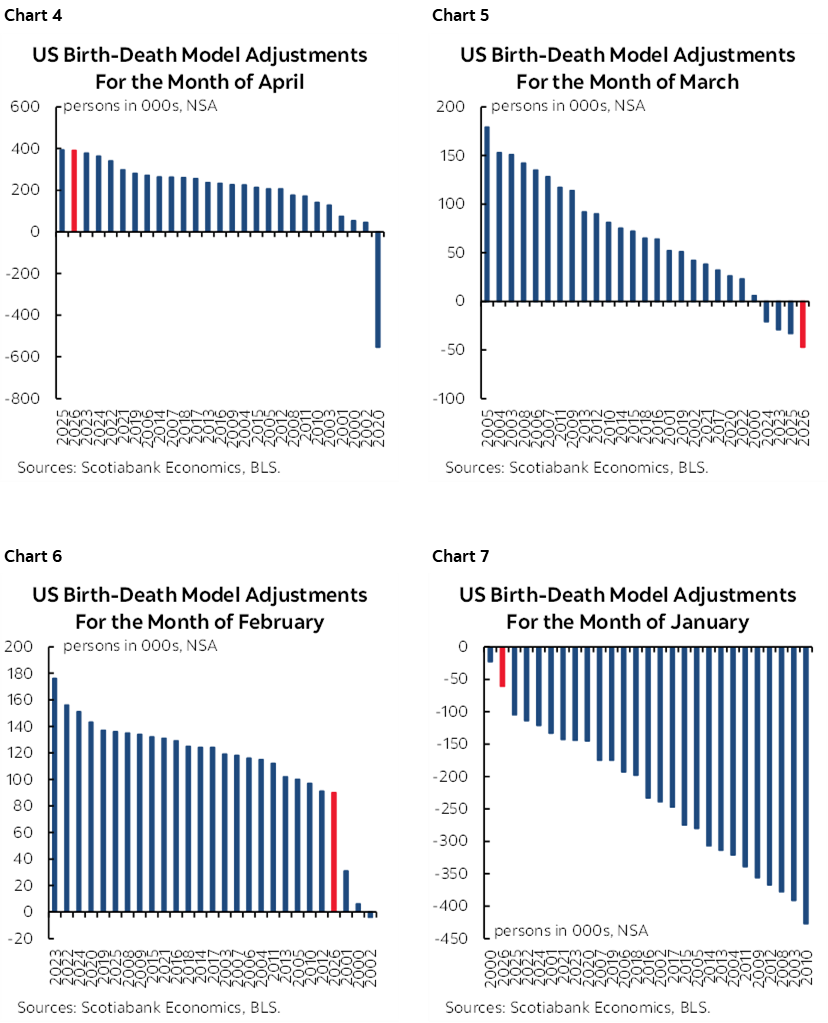
- Birth-death model: The birth-death model is usually a major part of the payrolls report for the month of May (chart 3). A typical month of May sees a seasonally unadjusted payroll gain of about 600–850k. The birth-death model is not seasonally adjusted and in typical months of May it can add around 200k m/m NSA to payrolls. In other words, roughly one-quarter to one-third of the unadjusted change in payrolls is usually driven by a model designed to guesstimate the change in employment not captured by the sample as new firms are created net of failures. It’s purely model driven and hence often heavily subject to revision. I’ve gone with about a 200k addition this time. Charts 4–7 show how starkly different the b-d model adjustments to payrolls have been in the first four months of this year compared to like months in history. Keep this at the front of your minds in terms of confidence in the readings.
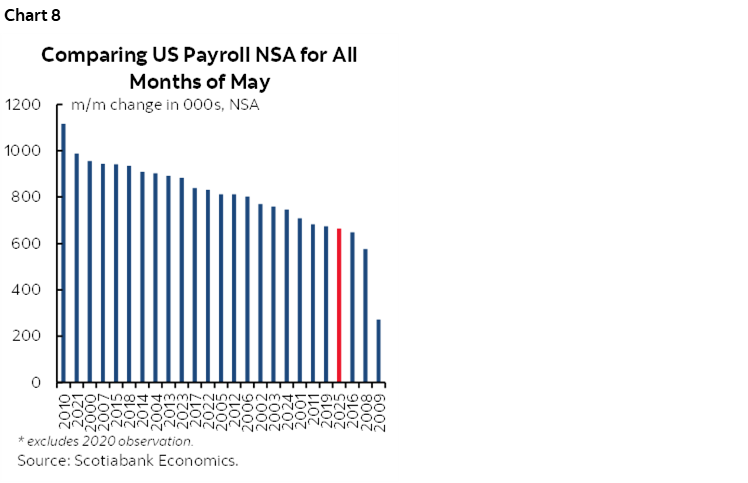
- Seasonally unadjusted gains: May is normally a solid up-month for unadjusted payrolls (chart 8). I’ve estimated about +700k inclusive of the birth-death adjustment, so half a million excluding it.
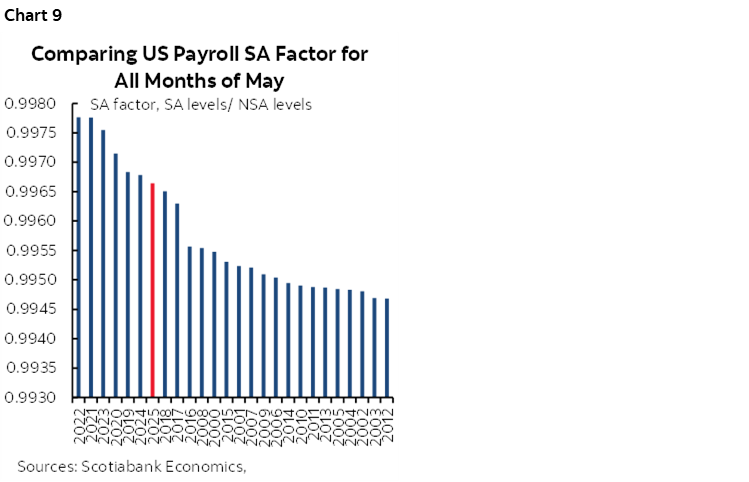
- SA factor: Because May is normally a seasonal up-month, the seasonal adjustment factor seeks to compensate for this in a way that seeks to estimate what is seasonally unusual. That means the SA factor for May is usually below 1.0. The pandemic era has generally used SA factors that are among the highest for like months of May in history but the recency bias to how they are calculated may be waning somewhat (chart 9). I’ve gone with the same SA factor as last year with risk of lower.
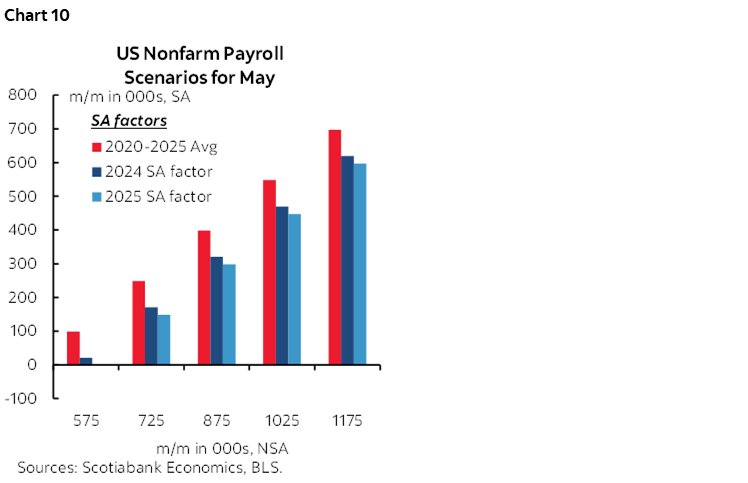
- SA scenarios: Based on the NSA and SA assumptions, one way of estimating payrolls is shown in scenarios (chart 10). A slightly lower than historical average NSA change paired with the SA factor argument would yield a seasonally adjusted gain of about 125k.
- Job postings: JOLTS job postings soared in April which may be a tee-up to faster job growth in May if the positions are filled. A worrisome sign, however, is that the vast majority of the rise in JOLTS was in the category of business and professional services which implies no breadth.
- Weather: There may be a positive weather effect on payrolls. This has been a warmer than usual few months across much of the US which may positively impact weather-related categories. There was also a near absence of major weather events between nonfarm reference periods in April and May. Weather could add tens of thousands.
- Health sector hiring: Ongoing hiring around a recent trend pace is expected. It may remain important to exclude this sector and look at private payrolls ex-health to get at breadth.
- FIFA World Cup: Most of the positions may be volunteers, but direct and indirect World Cup hiring activities could be pluses this month and next before the gains are removed thereafter.
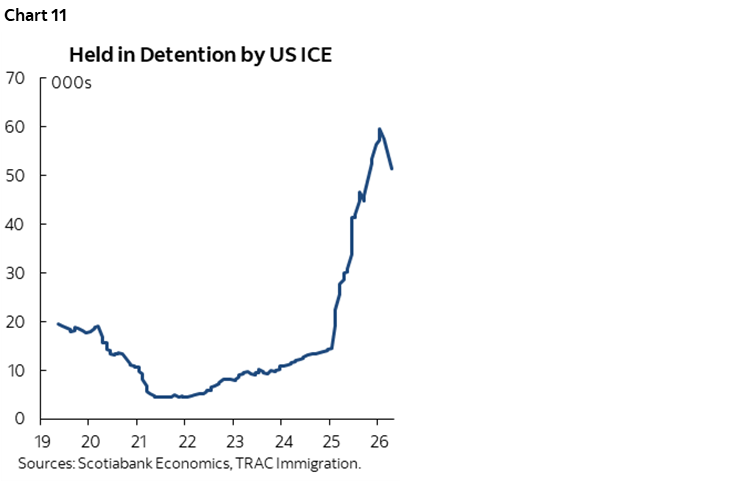
- ICE detentions: They were starting to decline before data was suspended (chart 11). We haven’t seen figures since April. The implication is that there could be a modest lift as explicit detentions and the fear factor driving some workers to hide has subsided under political pressure against the actions of ICE hooligans.
- Other readings: The Conference Board’s jobs plentiful measure slipped in May, indicating that consumers were not seeing the job openings reported elsewhere. ISM employment readings included another contraction signal in manufacturing but at a slower pace, and we’ll get ISM-services-employment this morning along with ADP. NFIB small business gauges of hiring appetite during May won’t be released until next week which isn’t terribly helpful of them. Revelio’s nonfarm proxy will be updated tomorrow but the history of first estimates compared to first estimates for nonfarm suggests it’s not terribly useful.
- All that said, the noisier household survey is in defiance of nonfarm, having posted four consecutive declines this year so far and not small ones either. On a year-to-date basis, nfp has been up by 304k whereas the household survey is down 1.37 million. It’s hard to dismiss four months of household survey declines as mere sampling issues which may mean that nonfarm’s quirks—like birth-death models—and off-payroll jobs could be among the factors explaining the gap in labour market performance.
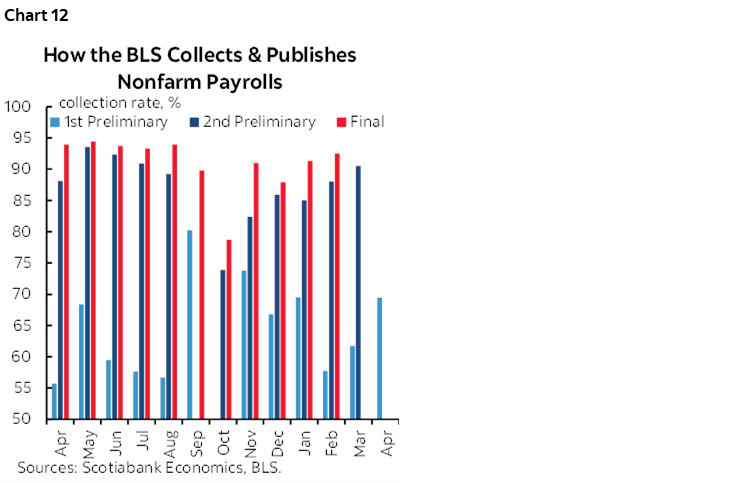
- If that’s not enough uncertainty for you, then note that first-round sampling has been weak for some time compared to history (chart 12). That spells rrrrrevisions!
DISCLAIMER
This report has been prepared by Scotiabank Economics as a resource for the clients of Scotiabank. Opinions, estimates and projections contained herein are our own as of the date hereof and are subject to change without notice. The information and opinions contained herein have been compiled or arrived at from sources believed reliable but no representation or warranty, express or implied, is made as to their accuracy or completeness. Neither Scotiabank nor any of its officers, directors, partners, employees or affiliates accepts any liability whatsoever for any direct or consequential loss arising from any use of this report or its contents.
These reports are provided to you for informational purposes only. This report is not, and is not constructed as, an offer to sell or solicitation of any offer to buy any financial instrument, nor shall this report be construed as an opinion as to whether you should enter into any swap or trading strategy involving a swap or any other transaction. The information contained in this report is not intended to be, and does not constitute, a recommendation of a swap or trading strategy involving a swap within the meaning of U.S. Commodity Futures Trading Commission Regulation 23.434 and Appendix A thereto. This material is not intended to be individually tailored to your needs or characteristics and should not be viewed as a “call to action” or suggestion that you enter into a swap or trading strategy involving a swap or any other transaction. Scotiabank may engage in transactions in a manner inconsistent with the views discussed this report and may have positions, or be in the process of acquiring or disposing of positions, referred to in this report.
Scotiabank, its affiliates and any of their respective officers, directors and employees may from time to time take positions in currencies, act as managers, co-managers or underwriters of a public offering or act as principals or agents, deal in, own or act as market makers or advisors, brokers or commercial and/or investment bankers in relation to securities or related derivatives. As a result of these actions, Scotiabank may receive remuneration. All Scotiabank products and services are subject to the terms of applicable agreements and local regulations. Officers, directors and employees of Scotiabank and its affiliates may serve as directors of corporations.
Any securities discussed in this report may not be suitable for all investors. Scotiabank recommends that investors independently evaluate any issuer and security discussed in this report, and consult with any advisors they deem necessary prior to making any investment.
This report and all information, opinions and conclusions contained in it are protected by copyright. This information may not be reproduced without the prior express written consent of Scotiabank.
™ Trademark of The Bank of Nova Scotia. Used under license, where applicable.
Scotiabank, together with “Global Banking and Markets”, is a marketing name for the global corporate and investment banking and capital markets businesses of The Bank of Nova Scotia and certain of its affiliates in the countries where they operate, including; Scotiabank Europe plc; Scotiabank (Ireland) Designated Activity Company; Scotiabank Inverlat S.A., Institución de Banca Múltiple, Grupo Financiero Scotiabank Inverlat, Scotia Inverlat Casa de Bolsa, S.A. de C.V., Grupo Financiero Scotiabank Inverlat, Scotia Inverlat Derivados S.A. de C.V. – all members of the Scotiabank group and authorized users of the Scotiabank mark. The Bank of Nova Scotia is incorporated in Canada with limited liability and is authorised and regulated by the Office of the Superintendent of Financial Institutions Canada. The Bank of Nova Scotia is authorized by the UK Prudential Regulation Authority and is subject to regulation by the UK Financial Conduct Authority and limited regulation by the UK Prudential Regulation Authority. Details about the extent of The Bank of Nova Scotia's regulation by the UK Prudential Regulation Authority are available from us on request. Scotiabank Europe plc is authorized by the UK Prudential Regulation Authority and regulated by the UK Financial Conduct Authority and the UK Prudential Regulation Authority.
Scotiabank Inverlat, S.A., Scotia Inverlat Casa de Bolsa, S.A. de C.V, Grupo Financiero Scotiabank Inverlat, and Scotia Inverlat Derivados, S.A. de C.V., are each authorized and regulated by the Mexican financial authorities.
Not all products and services are offered in all jurisdictions. Services described are available in jurisdictions where permitted by law.