ON DECK FOR TUESDAY, JUNE 2nd
KEY POINTS:
- Bots continue to trade erratic war headlines
- Canadian jobs preview
- Eurozone CPI landed on the screws after last week’s country releases
- SK CPI pushes yields up, BoK expected to hike in July
- Indonesian CPI surprised higher
War is on, then war is off. Peace any moment now, then yeah right. The oscillating headlines combined with daily market gullibility are driving oil prices to be down a buck or so this morning. We’re asked to believe that Israel and Hezbollah have given their scout’s honour pledges to stop attacking each other with a big just-kidding hug because Trump asked nicely as he searches in vain for a solution to his botched war with Iran.
That has sovereign bond yields dipping across most major markets outside of the Antipodeans. Equity futures are slightly negative in the US, slightly positive in Canada, and European cash markets in the black with gains of up to about 1%. Currencies are mixed.
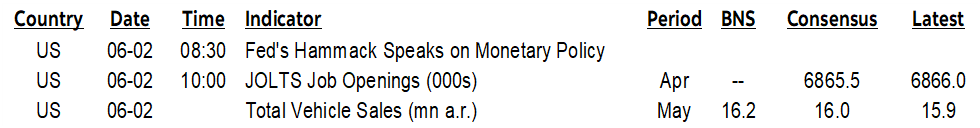
There was light overnight data that largely got buried behind the effects of bots trading commodities on market manipulating headlines. US JOLTS is also on tap and can be impactful to markets at times. Summaries follow before I’ll offer a preview of Friday’s Canadian jobs report (nonfarm preview tomorrow).
Light Macro Readings
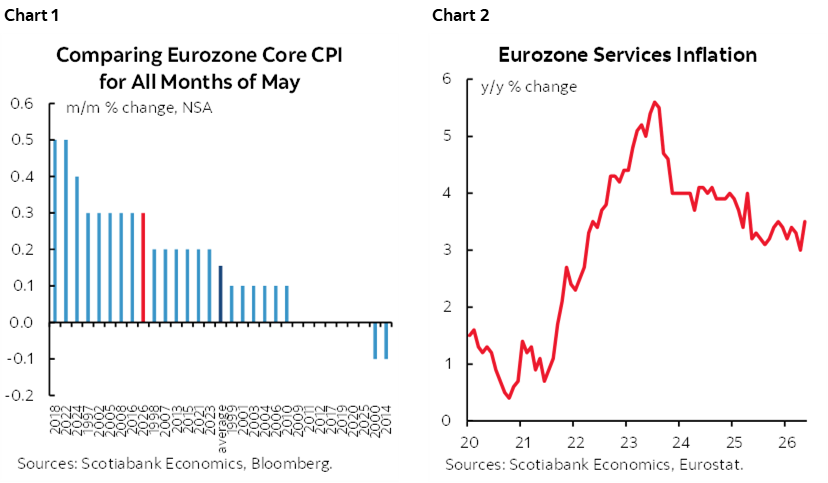
Eurozone CPI landed on the screws at 3.2% y/y, up from 3%. It was up by 0.1% m/m NSA. Core CPI accelerated to 2.5% (2.4% consensus, 2.2% prior) with the m/m NSA change a touch warmer than an average month of May (chart 1). Services inflation picked up (chart 2). None of this was much of a surprise to EGBs and the euro after the major countries all released their inflation estimates last week. Markets are priced for the ECB to raise its deposit facility rate by 25bps to 2.25% on June 11th.
Higher than expected South Korean inflation pushed the 2-year yield higher by about 8bps overnight on expectations that the Bank of Korea’s hawkish warnings may lead to a rate hike at the next meeting on July 16th. CPI was up 0.5% m/m (0.2% consensus) and 3.1% y/y (2.9% consensus) with core CPI accelerating to 2.5% y/y (2.2% consensus and prior).
Indonesian CPI inflation also climbed a little faster than expected. Headline CPI was up by 3.1% y/y (3% consensus, 2.4% prior) with core at 2.6% y/y (2.5% consensus, 2.4% prior).
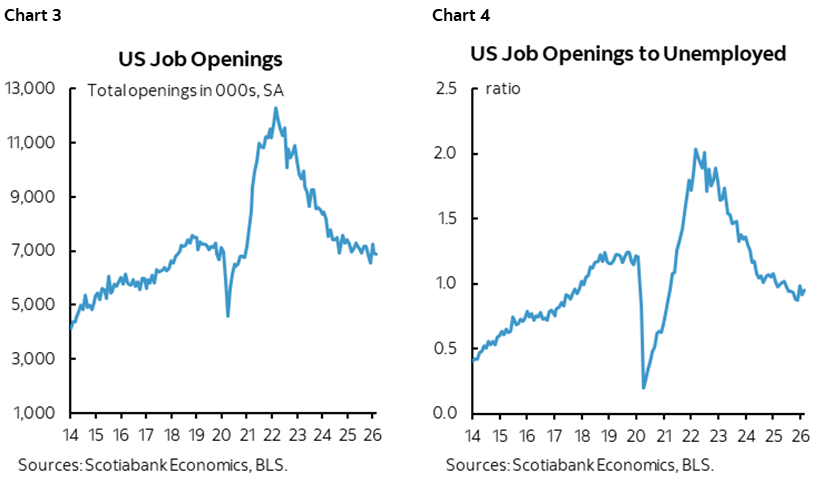
On tap into the N.A. session are two labour market readings plus vehicle sales. One is the JOLTS job openings, quits and layoffs data for April (10amET). Openings have been moving sideways for some time (chart 3) while the ratio of JOLTS job openings to the number of unemployed Americans has been under 1.0 for nine months now, signalling emerging slack not captured in just the unemployment rate (chart 4). The QCEW figures that represent state-level employment data as input into expectations for September’s annual nonfarm benchmarking revisions is also due out at the same time as JOLTS. Vehicle sales during May (e.o.d.) are expected to rise somewhat from 15.9 million annualized in April to about 16.2 million in May based upon industry guidance.
We may get Canadian vehicle sales today as well but that’s on a more erratic and opaque release schedule.
Canadian Jobs Preview
Canada updates job market readings for the month of May on Friday (8:30amET). Consensus sits at +10k, with most expecting a rise except for an anonymous entry. My guesstimate is +25k with an unchanged unemployment rate of 6.9%.
Here are some ingredients to the call in the modern spirit whereby bullet points are paragraphs with dots in front of them, while also emphasizing up front as always that high statistical noise in this household survey translates into a 95% confidence band around the estimated change in jobs of about +/-57k. You’ve been warned, trade at your own risk!
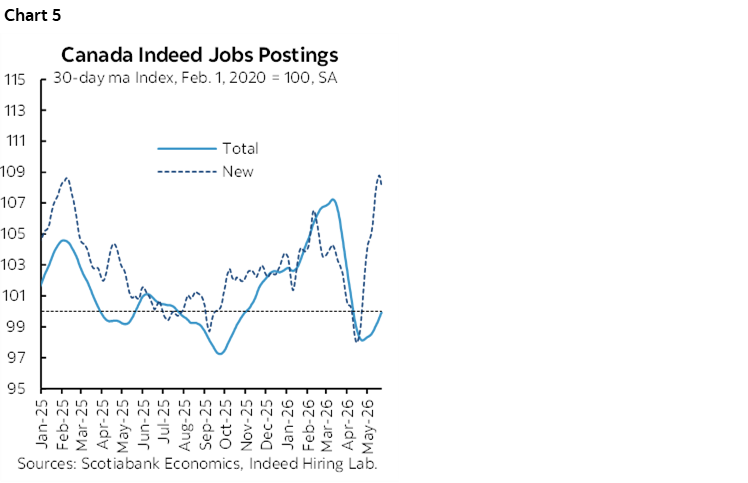
- Job postings: Postings are soaring (chart 5). New job postings are at their highest since early 2025 and this is helping to turn total postings higher. There is no guarantee that surging postings will be filled in May but it’s a meaningful signal about renewed hiring appetite.
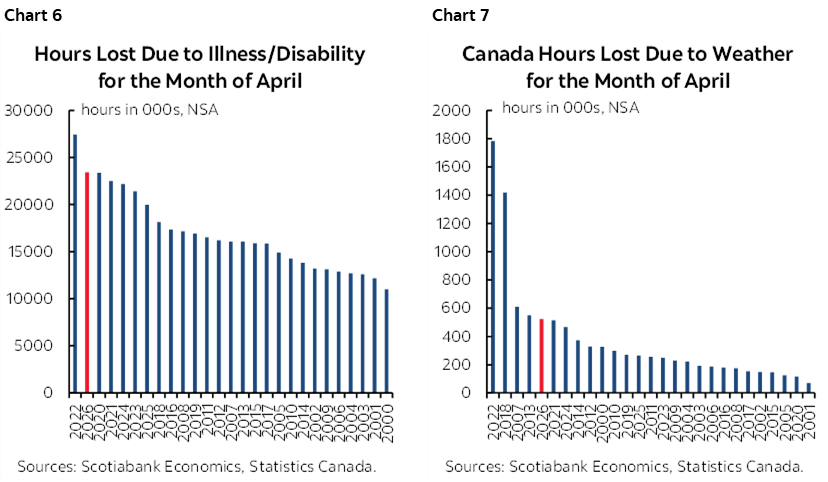
- Weather and sickies: You generally don’t lose a job in Canada within the Labour Force Survey because of weather or if you’re sick, but that’s not the same as saying there can be no effect on employment. Either factor can make it more difficult to conduct interviews and facilitate the offer and acceptance process. Plus, hiring appetite can be impacted by adverse weather which I think is what contributed to recent hiring softness in sectors like construction and retail. We know that hours worked were negatively impacted by weather and sickness as hours lost to both have been elevated in recent months (charts 6, 7). That has been true for each month this year with lost hours due to weather and sickness being much higher than typical. May wasn’t a great Spring at least in central Canada as it was on the cooler side, but at some point there may be pent-up hiring activity perhaps starting as soon as this report.
- Census hiring: Statcan estimates they are hiring about 32k workers to run the 5-year Census. That’s more than in 2021 when the pandemic reduced the number of enumerators being deployed, but slightly fewer than the 35,000 hired for the 2016 Census. The population in 2016 was about 35.9 million versus 41.5 million today, so Statcan has become more efficient in running the Census by, for instance, employing greater use of online survey responses that is a legal requirement. The distribution of this hiring tends to ramp up in May and June when enumerators hit the trails; a May gain of about 10k is expected. You would want to remove this from public administration in order to assess the quality of Friday’s overall reading.
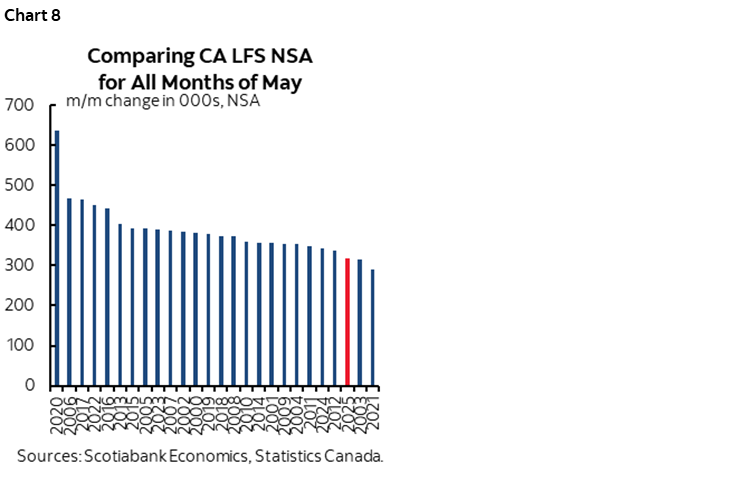
- Seasonal hiring: May is typically a seasonal up-month for jobs in Canada as seasonal economic activity picks up. Chart 8 shows the pattern for seasonally unadjusted employment gains across like months of May over time. I’ve figured a gain of about 350k m/m NSA which lies in the middle of the historical norms.
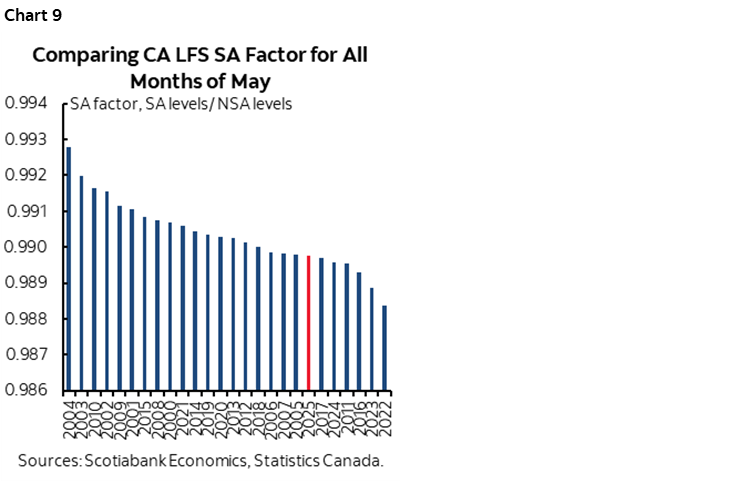
- Seasonal adjustment factor: Because May is normally a seasonal up-month for jobs, seasonal adjustment factors try to compensate for this in order to give a picture of job growth that is beyond just seasonal norms. That means the SA factor is below 1.0 for months of May, but there’s a catch. Recent years—since the pandemic—has used lower than historically normal SA factors for May; 2022 through 2025 are all represented in the bottom range of SA factors (chart 9). The SA factors can suffer from a recency bias that is skewed to experiences over recent periods, like coming out of the pandemic. To test the robustness of whatever job number Statcan gives us you may wish to do alternate scenarios for SA factors as I don’t personally have much trust for what is used in recent years.
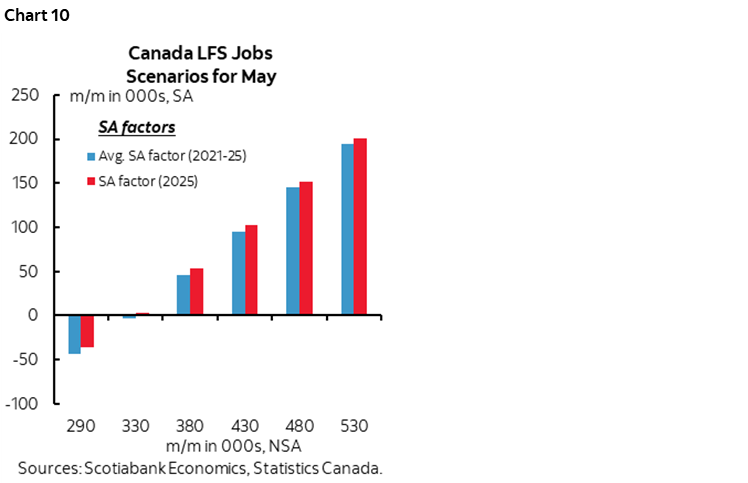
- SA Scenarios: Chart 10 shows how jobs could change under multiple scenarios for the month-over-month NSA change and using either last May’s SA factor or the average SA factor over the pandemic era. Most scenarios reveal significant gains. It would take the worst NSA change in May employment since the pandemic year of 2021—or worse—combined with either SA factor (last year’s or the recent five-year average) to drive a meaningful decline in seasonally adjusted employment. That seems like a remote chance to me.
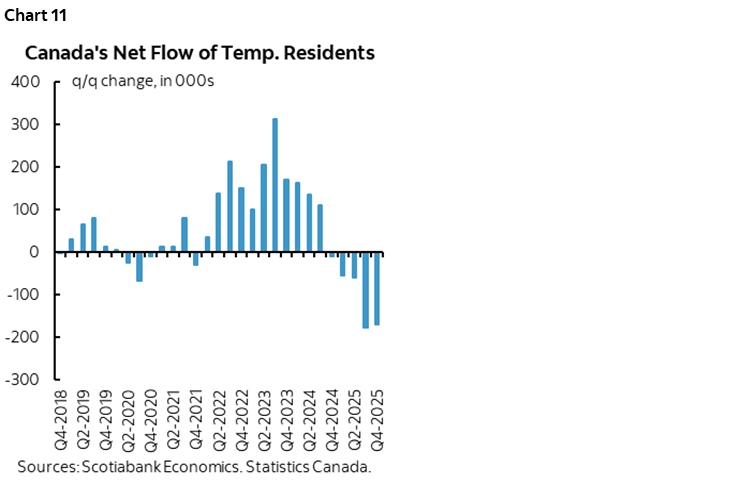
- Temps versus youths: May is when university and college grads heave a sigh of relief after completing exams. It’s also when traditionally seasonal types of employment that are often filled by youths take off, such as at bars, restaurants, hotels etc. This year’s summer job market is tracking similarly to last year’s (here) but this might understate employment opportunities for young people in the 15–24 age category of the report. That’s because the population of temporary residents—comprised of temporary foreign workers, international students and asylum seekers—is falling due to the tightening of immigration policies (chart 11). Ergo, the prior reductions in temps that may have flattened hiring in traditionally seasonal sectors could open up more opportunity for youths to fill seasonal jobs in ways that seasonal adjustments may not adequately control. I think the tighter immigration policy has caused some of the weakening in employment of late and that the pressure will be upon Ottawa to begin raising the targets once more within a couple of years or so.
- FIFA World Cup: There may be a modest lift to employment caused by the FIFA World Cup as both Toronto and Vancouver are hosting cities. There may be other related hiring in sectors like retail and accommodation and food services. Many volunteers are also expected. Toronto’s population is roughly half-born abroad and very diverse with high engagement in the World Cup despite Canada not being a soccer/football powerhouse.
- Provincial tug of war: Jobs plunged in Quebec in April but soared in Ontario as the two largest provinces largely offset one another. I don’t have high confidence in an understanding of what went on but watch the provincial gyrations and any colour about them.
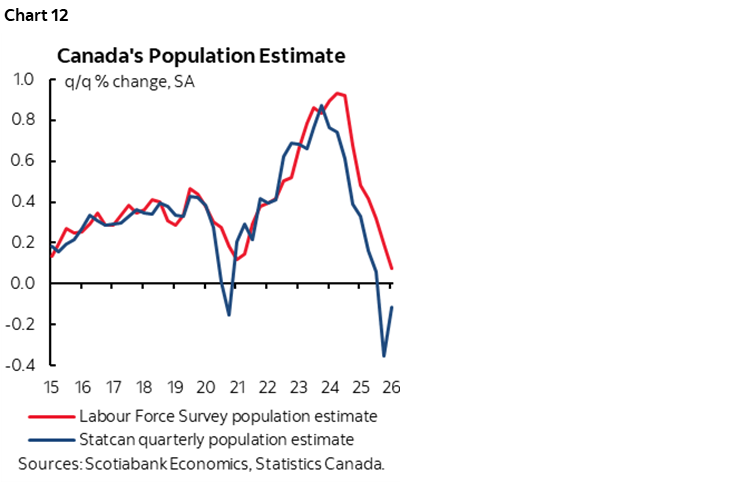
- Unemployment rate: I’ve gone with unchanged at 6.9%. One big uncertainty concerns timing of when the monthly Labour Force Survey will catch up to what Statcan’s quarterly population estimates are indicating (chart 12). Population is falling but not yet in the LFS because it applies a rolling 12-month moving average to the stock of temporary residents that are falling. That means the LFS population figures—and probably the labour force readings—will turn lower with a lag. Since the unemployment rate uses the labour force estimates as input, it means we shouldn’t trust the recent readings for the UR. In my judgement, the UR would be lower now by several tenths if not for this LFS quirk.
DISCLAIMER
This report has been prepared by Scotiabank Economics as a resource for the clients of Scotiabank. Opinions, estimates and projections contained herein are our own as of the date hereof and are subject to change without notice. The information and opinions contained herein have been compiled or arrived at from sources believed reliable but no representation or warranty, express or implied, is made as to their accuracy or completeness. Neither Scotiabank nor any of its officers, directors, partners, employees or affiliates accepts any liability whatsoever for any direct or consequential loss arising from any use of this report or its contents.
These reports are provided to you for informational purposes only. This report is not, and is not constructed as, an offer to sell or solicitation of any offer to buy any financial instrument, nor shall this report be construed as an opinion as to whether you should enter into any swap or trading strategy involving a swap or any other transaction. The information contained in this report is not intended to be, and does not constitute, a recommendation of a swap or trading strategy involving a swap within the meaning of U.S. Commodity Futures Trading Commission Regulation 23.434 and Appendix A thereto. This material is not intended to be individually tailored to your needs or characteristics and should not be viewed as a “call to action” or suggestion that you enter into a swap or trading strategy involving a swap or any other transaction. Scotiabank may engage in transactions in a manner inconsistent with the views discussed this report and may have positions, or be in the process of acquiring or disposing of positions, referred to in this report.
Scotiabank, its affiliates and any of their respective officers, directors and employees may from time to time take positions in currencies, act as managers, co-managers or underwriters of a public offering or act as principals or agents, deal in, own or act as market makers or advisors, brokers or commercial and/or investment bankers in relation to securities or related derivatives. As a result of these actions, Scotiabank may receive remuneration. All Scotiabank products and services are subject to the terms of applicable agreements and local regulations. Officers, directors and employees of Scotiabank and its affiliates may serve as directors of corporations.
Any securities discussed in this report may not be suitable for all investors. Scotiabank recommends that investors independently evaluate any issuer and security discussed in this report, and consult with any advisors they deem necessary prior to making any investment.
This report and all information, opinions and conclusions contained in it are protected by copyright. This information may not be reproduced without the prior express written consent of Scotiabank.
™ Trademark of The Bank of Nova Scotia. Used under license, where applicable.
Scotiabank, together with “Global Banking and Markets”, is a marketing name for the global corporate and investment banking and capital markets businesses of The Bank of Nova Scotia and certain of its affiliates in the countries where they operate, including; Scotiabank Europe plc; Scotiabank (Ireland) Designated Activity Company; Scotiabank Inverlat S.A., Institución de Banca Múltiple, Grupo Financiero Scotiabank Inverlat, Scotia Inverlat Casa de Bolsa, S.A. de C.V., Grupo Financiero Scotiabank Inverlat, Scotia Inverlat Derivados S.A. de C.V. – all members of the Scotiabank group and authorized users of the Scotiabank mark. The Bank of Nova Scotia is incorporated in Canada with limited liability and is authorised and regulated by the Office of the Superintendent of Financial Institutions Canada. The Bank of Nova Scotia is authorized by the UK Prudential Regulation Authority and is subject to regulation by the UK Financial Conduct Authority and limited regulation by the UK Prudential Regulation Authority. Details about the extent of The Bank of Nova Scotia's regulation by the UK Prudential Regulation Authority are available from us on request. Scotiabank Europe plc is authorized by the UK Prudential Regulation Authority and regulated by the UK Financial Conduct Authority and the UK Prudential Regulation Authority.
Scotiabank Inverlat, S.A., Scotia Inverlat Casa de Bolsa, S.A. de C.V, Grupo Financiero Scotiabank Inverlat, and Scotia Inverlat Derivados, S.A. de C.V., are each authorized and regulated by the Mexican financial authorities.
Not all products and services are offered in all jurisdictions. Services described are available in jurisdictions where permitted by law.