ON DECK FOR THURSDAY, JANUARY 8TH
KEY POINTS:
- Equities and bonds slip on policy developments
- Trump gives with one hand to defence cos…
- …and takes with the other…
- ...as many important details need to be addressed for markets
- Why banning investors from the US housing market could backfire badly
- Why US data quality has become so bad
- German factory orders soar to a two-year high on capital goods
- US job cuts were in a normal range for December
- US Q3 productivity, Revelio, lagging trade, claims on tap
- Canadian trade could inform Q4 GDP tracking, Q3 revisions
- Swedish rates outperform after soft CPI
- BCRP expected to remain on hold
Stocks are broadly, but gently lower across global benchmarks this morning. Ditto for most sovereign bond prices. The dollar is little changed on an overall weighted basis. Oil prices are up a bit as Trump admits the US will be involved in Venezuela for years including attempting to manage its oil industry long-term. Gold is down a bit.
Why the long faces in bonds and equities? There are three reasons, some of which have embedded knock-on uncertainties. One is Trump’s loose guidance that defence spending is to be jacked up and what that may signal. Two is his edict that defence companies must adjust capital management plans. Three is Trump’s announcement against investors in new homes. Each of which is covered below.
TRUMP PLEDGES MASSIVE DEFENCE SPENDING SURGE
Psst, hey buddy, can I bum a half a trillion off ya?
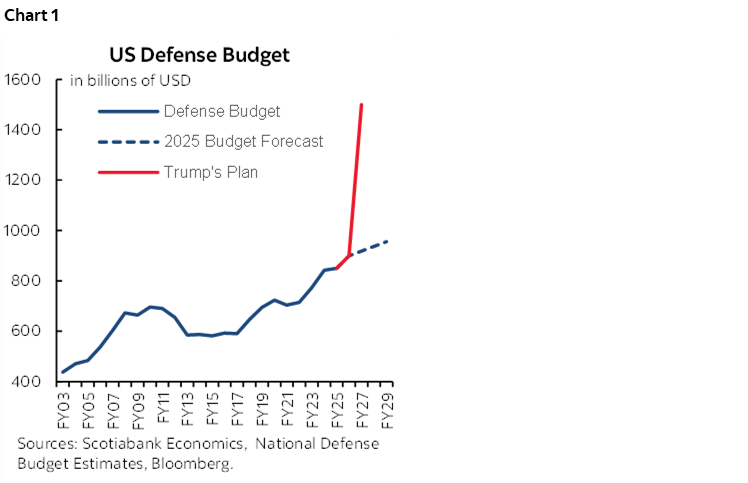
Trump’s social media post late yesterday raised more questions than answers (here). In it he said he wants to jack up defence spending by an extra half a trillion dollars in 2027. Chart 1 shows what that would mean relative to history and the budget baseline.
A first question is, well, how? It’s just a social media post, with no details as usual. There is no bill, no appropriations, and he often goes back on his words. So, maybe markets will take a show-me-proof attitude which may explain why there is a fairly limited reaction in Treasury yields. Maybe the odd fiscal hawk or two that’s left in Congress might have a thing or two to say about it and if the midterms are a setback then it could be tough to pass a bill unless an attempt is made beforehand.
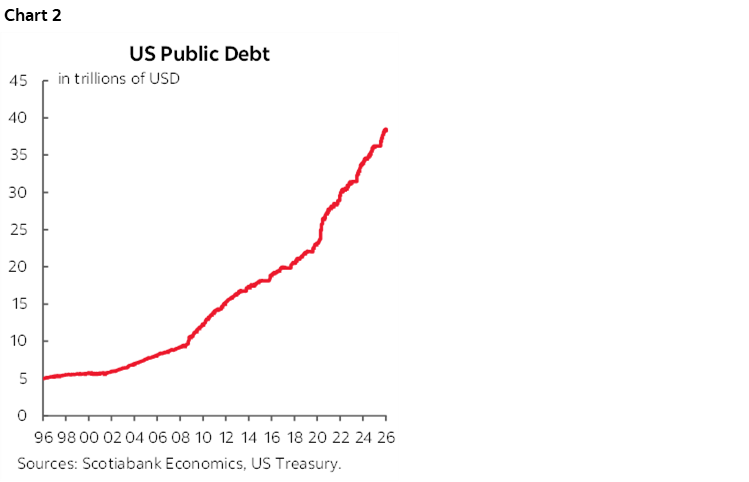
A second question is how would this be financed? Through further offsetting non-defence cuts? Through tax hikes? Through further tariff increases whether through IEEPA tariffs or other tactics if the Supreme Court shoots down IEEPA tariffs? If debt financed, then the US$38½ in public debt outstanding would assuredly breach US$40 trillion even sooner than otherwise (chart 2). US fiscal policy is already on an unsustainable path that would risk further challenges from bond markets.
Third, why?? The world is a dangerous place indeed, as Trump correctly notes, and his administration is playing a role. What signal is behind ramping up defence spending? Planning something? What foreign incursions are next?
Fourth, would it be just a one-off, or a permanent annual boost? US defence spending was already budgeted to be on a path toward US$1 trillion per year and Trump’s post would send it vertically. We need to know if that’s a sustained target.
Fifth, how would the FOMC react? You can’t just dump half a trillion more spending in the US economy and not expect knock-on effects. There is less import leakage from US defence spending than there is in other countries, so the domestic economy would get a lift. And you want rate cuts, do you? That would be harder to envision as a motive for a possible forecast change and raising our yield forecasts across the curve.
TRUMP SLAMS DEFENCE, HOUSING STOCKS
A second weight against risk appetite this morning is derived from a pair of Trump posts.
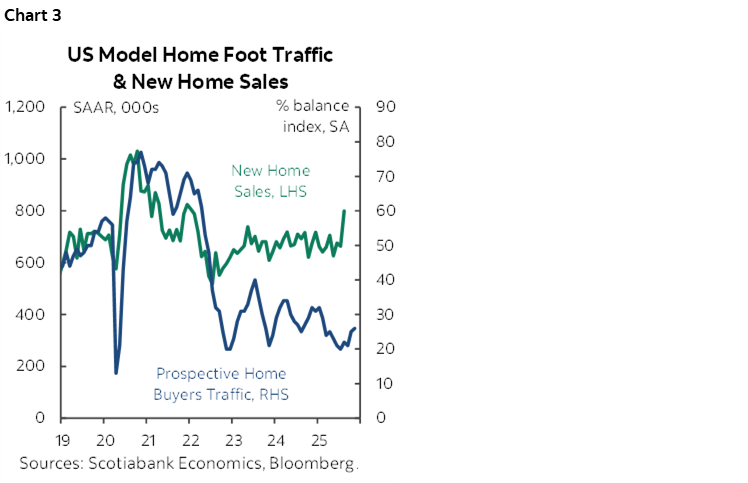
This one said he’ll “ban large institutional investors from buying more single-family homes.” Investors have been major buyers of new homes. Industry estimates point to between a quarter and a third of new homes being bought by investors. I’d offer a proxy method of showing this in chart 3 that shows the breakdown in the historical connection between visits to model homes as a leading indicator of sales. The gap that has emerged since 2022 is principally due to investors.
It's overly simple to vilify investors for America’s housing affordability challenges. Investors play a useful role in the housing market and can drive rental availability as one example. Eliminating them could weigh heavily on prices. That could carry knock-on effects on resale prices through arbitrage and substitutability. It could jeopardize the credit worthiness of mortgages originated in recent years that could suddenly be under water. Addressing affordability is laudable, but this isn’t the way to do it.
A key uncertainty remains that, as always, so far we only have a social media post as opposed to something more formal and there could be implementation challenges even if there is a more formal step.
And then this one directed defence companies to halt divided payments and stock buybacks while setting a cap on executive pay. Defence and aerospace has about a one-quarter weight on the S&P500. Multiple stocks sold off sharply late yesterday into the close with the sector down about 3% late yesterday and we’ll see how they behave today.
A clear caveat is that, as usual, we don’t have any specifics to inform whether it’s just a wish or something substantive in the works. How feasible it is to direct companies in such fashion is unclear.
WHY US DATA QUALITY IS POOR
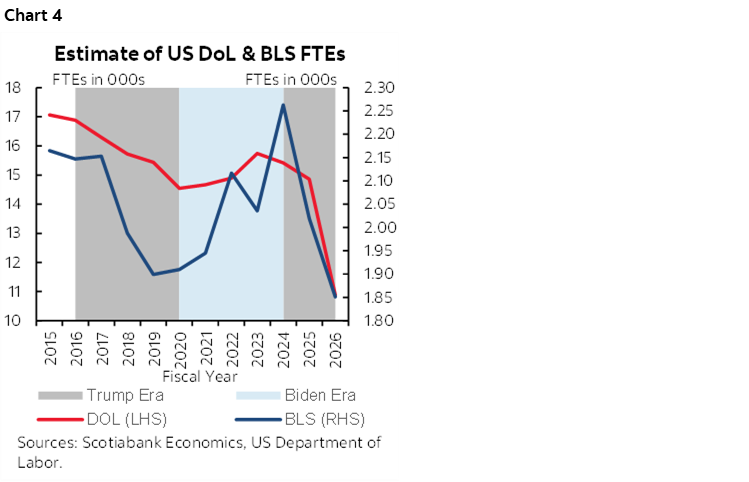
A Bloomberg article late yesterday added to my longstanding arguments about the sharp deterioration in US data quality by reporting on an email from the Bureau of Labor Statistics to Benzinga about agency staffing. According to the BLS, staffing is down “by about 25% over the last year, and approximately 40% of leadership positions are currently vacant.”
Chart 4 shows how this has happened over time. Severe budget cuts under Trump 1.0 and Trump 2.0 have had damaging effects on the data agencies. Biden attempted to repair some of the damage, but the lagging effects of Trump 1.0 cuts and then Trump 2.0 have been damaging.
Charts 5-10 shows various examples of how this has impacted data quality. Job survey response rates have fallen sharply over this period with the lagging influences of Trump 1.0 cuts and then Trump 2.0 effects (chart 5). Other drivers of falling response rates have included folks’ reticence to answer phones given spammers, telemarketers, and crooks on the other end. The data agencies could have done better in terms of pivoting toward other data collection methods.
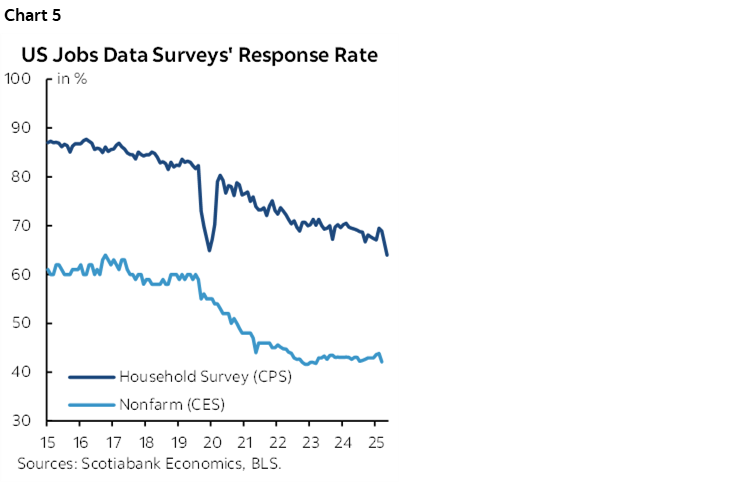
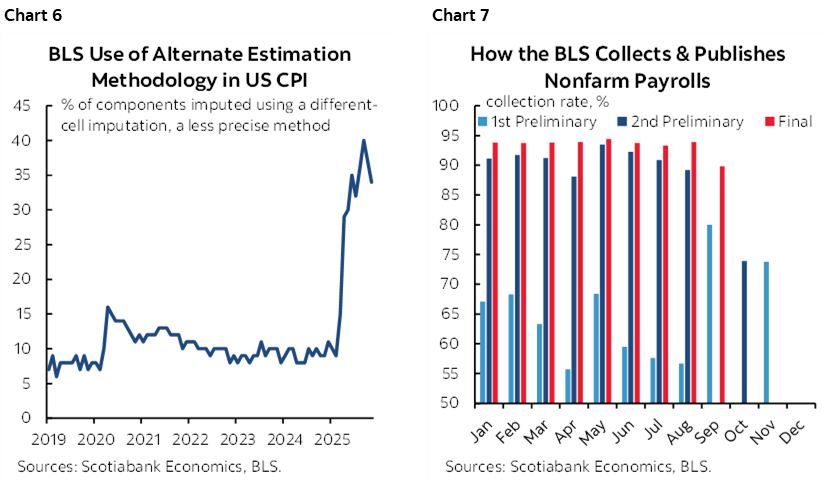
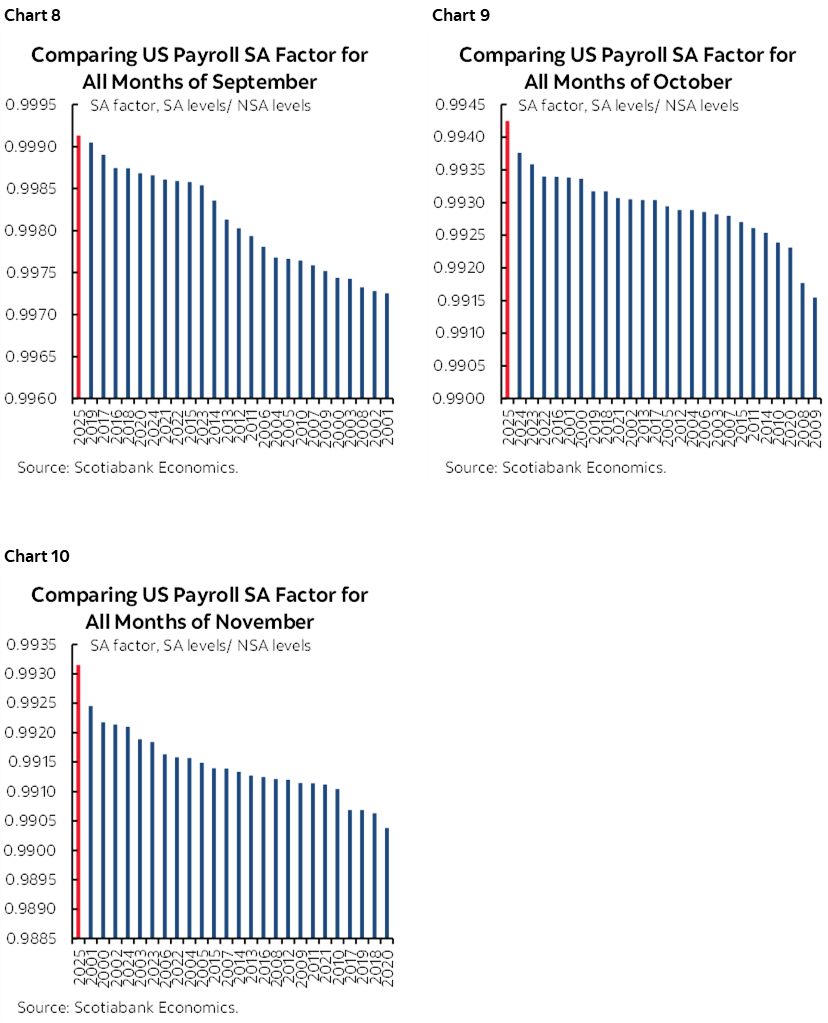
Chart 6 also shows the record share of the CPI basket that is being guesstimated through proxy methods in lieu of hard price data. Chart 7 shows weak first response rates for nonfarm payrolls that gets made up with more complete data on subsequent revisions, but less so in recent months. Charts 8–10 show the curious move toward record high seasonal adjustment factors for nonfarm payrolls in each of the past three months following when President Trump fired the BLS Commissioner. These high SA factors may overstate payrolls and raise questions about the degree to which they are because of seasonal adjustment models that may be questioned, or other less pure motives. Given the sharp criticism they have endured and the sagging job prospects, maybe they’re all afraid of telling Trump that jobs have been tanking.
DATA RELEASES
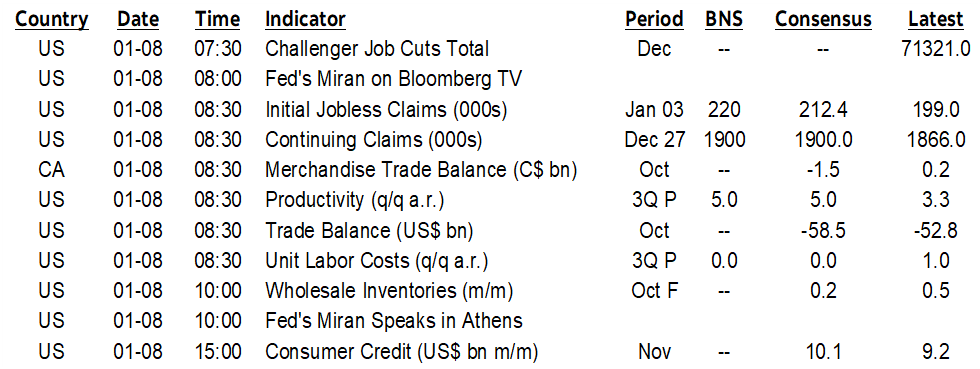
Challenger job cuts landed at 35.6k in December in seasonally unadjusted terms. That’s the lowest reading since July of last year. Even if it were seasonally adjusted, the print would be broadly within the readings of the past decade’s December readings except for the pandemic’s hit in 2020.
German factory orders were massive in November. Orders grew by 5.6% m/m SA (-1.0% consensus) after a prior 1.6% gain and a rise of 2.1% before that. Capital goods are driving the strength with orders up by 7.9% in November after a 5.3% surge. The result lifts total orders to their highest level since a temporary peak two years prior.
Sweden’s short-term rates market is outperforming most others this morning after CPI came in weaker than expected. CPI was flat in December (consensus 0.2% m/m) with underlying inflation at 0.1% (0.3% consensus) and underlying ex-energy up 0.3% (0.6% consensus). 2s rallied by about 2–3bps this morning, but markets still expect nothing from the Riksbank throughout this year.
On tap this morning will be several US and Canadian releases. US Q3 productivity growth should be quite strong with a gain of around 5% expected in the wake of the strong beat for US Q3 GDP, albeit with question marks around data quality that may spawn revisions. We’ll get trade figures from the US and Canada for the month of October and possible revisions that could impact initial Q3 GDP estimates (8:30amET). Revelio issues its nonfarm gauge for December (8:30amET). US initial and continuing claims are also due (8:30amET).
Tonight, Peru’s central bank is widely expected to remain on hold at 5.25% (6pmET).
DISCLAIMER
This report has been prepared by Scotiabank Economics as a resource for the clients of Scotiabank. Opinions, estimates and projections contained herein are our own as of the date hereof and are subject to change without notice. The information and opinions contained herein have been compiled or arrived at from sources believed reliable but no representation or warranty, express or implied, is made as to their accuracy or completeness. Neither Scotiabank nor any of its officers, directors, partners, employees or affiliates accepts any liability whatsoever for any direct or consequential loss arising from any use of this report or its contents.
These reports are provided to you for informational purposes only. This report is not, and is not constructed as, an offer to sell or solicitation of any offer to buy any financial instrument, nor shall this report be construed as an opinion as to whether you should enter into any swap or trading strategy involving a swap or any other transaction. The information contained in this report is not intended to be, and does not constitute, a recommendation of a swap or trading strategy involving a swap within the meaning of U.S. Commodity Futures Trading Commission Regulation 23.434 and Appendix A thereto. This material is not intended to be individually tailored to your needs or characteristics and should not be viewed as a “call to action” or suggestion that you enter into a swap or trading strategy involving a swap or any other transaction. Scotiabank may engage in transactions in a manner inconsistent with the views discussed this report and may have positions, or be in the process of acquiring or disposing of positions, referred to in this report.
Scotiabank, its affiliates and any of their respective officers, directors and employees may from time to time take positions in currencies, act as managers, co-managers or underwriters of a public offering or act as principals or agents, deal in, own or act as market makers or advisors, brokers or commercial and/or investment bankers in relation to securities or related derivatives. As a result of these actions, Scotiabank may receive remuneration. All Scotiabank products and services are subject to the terms of applicable agreements and local regulations. Officers, directors and employees of Scotiabank and its affiliates may serve as directors of corporations.
Any securities discussed in this report may not be suitable for all investors. Scotiabank recommends that investors independently evaluate any issuer and security discussed in this report, and consult with any advisors they deem necessary prior to making any investment.
This report and all information, opinions and conclusions contained in it are protected by copyright. This information may not be reproduced without the prior express written consent of Scotiabank.
™ Trademark of The Bank of Nova Scotia. Used under license, where applicable.
Scotiabank, together with “Global Banking and Markets”, is a marketing name for the global corporate and investment banking and capital markets businesses of The Bank of Nova Scotia and certain of its affiliates in the countries where they operate, including; Scotiabank Europe plc; Scotiabank (Ireland) Designated Activity Company; Scotiabank Inverlat S.A., Institución de Banca Múltiple, Grupo Financiero Scotiabank Inverlat, Scotia Inverlat Casa de Bolsa, S.A. de C.V., Grupo Financiero Scotiabank Inverlat, Scotia Inverlat Derivados S.A. de C.V. – all members of the Scotiabank group and authorized users of the Scotiabank mark. The Bank of Nova Scotia is incorporated in Canada with limited liability and is authorised and regulated by the Office of the Superintendent of Financial Institutions Canada. The Bank of Nova Scotia is authorized by the UK Prudential Regulation Authority and is subject to regulation by the UK Financial Conduct Authority and limited regulation by the UK Prudential Regulation Authority. Details about the extent of The Bank of Nova Scotia's regulation by the UK Prudential Regulation Authority are available from us on request. Scotiabank Europe plc is authorized by the UK Prudential Regulation Authority and regulated by the UK Financial Conduct Authority and the UK Prudential Regulation Authority.
Scotiabank Inverlat, S.A., Scotia Inverlat Casa de Bolsa, S.A. de C.V, Grupo Financiero Scotiabank Inverlat, and Scotia Inverlat Derivados, S.A. de C.V., are each authorized and regulated by the Mexican financial authorities.
Not all products and services are offered in all jurisdictions. Services described are available in jurisdictions where permitted by law.