ON DECK FOR THURSDAY, JANUARY 22ND
KEY POINTS:
- Stocks up, as US-Europe tensions subside
- US Q3 GDP revisions on tap
- US core PCE: the fog remains thick
- Australian bond yields spike after strong jobs report…
- ...as the Antipodean central banks are priced for the next moves to be up this year
- The won lost on GDP
- Norges, Negara hold as expected…
- …as Turkey cuts by less than expected
- Statcan must change the release day for the next CPI report
It’s back to the fundamentals. Thankfully. Stocks are broadly higher the world over after the US dropped its threatened tariffs on Europe and backed off threats against Greenland upon encountering a united opposition. There was and remains little reaction to the highly sceptical tone of US Supreme Court questioning in Fed Governor Lisa Cook’s hearing yesterday because markets were already basically assuming the Court would reject attempts to have her dismissed before her case has fully played out.
US equity futures are up by over 1%, TSX futures are up by just over ¼% and European cash markets are rallying by either side of 1% after a 1¾% rally in Tokyo. Sovereign bonds are little changed except for losses across Antipodean curves. Gold is flat, oil is off a few dimes and the USD is mixed.
A blend of regional central banks, light overnight data mainly focused on RBA watchers, and sketchy US data releases are the focal points. Key is the opportunity to place further emphasis upon the central bank space and the benign neglect of too many folks in the markets toward the potential for policy pivots toward less accommodation.
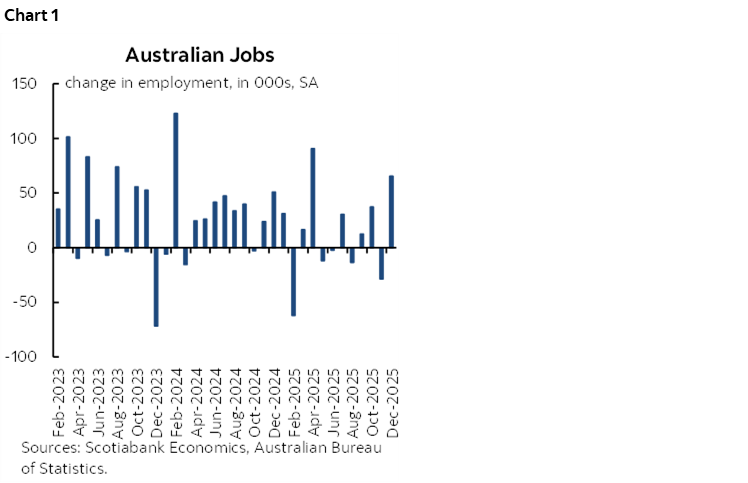
RBA HIKE PRICING JUMPS AFTER JOB GAIN
Australia is back. Job growth rebounded impressively by 65k in December after a 29k drop the prior month (revised from -21k). Chart 1 shows the pattern. Most of December’s gain was in full-time jobs (+55k). The unemployment rate fell back to 4.1% from 4.3% even with more folks entering the work force in search of jobs that pushed the participation rate up a tick to 66.7%.
The Australian dollar rallied to lead the pack against the USD, but Australian bonds paid a price as shorter-term yields spiked higher by 6–7bps. The bond reaction reflected a spike in market pricing for RBA hikes with the February 3rd decision almost 60% priced for a 25bps rate hike. About 50bps of hikes are priced through to year-end.
New Zealanders said thanks a lot for that, as the spillover effects raised hike pricing in that country as well. Kiwi bonds are slightly underperforming others—but by much less than Aussie bonds—with the RBNZ priced to hold for the next three meetings but then it gets dicey with material odds of a hike priced for the July and September meetings. Almost a half point of hikes is priced by year-end.
The global central bank space clearly continues to pivot toward less policy accommodation this year.
CENTRAL BANKS—TWO HOLDS AND A HIKE
Norges Bank held its policy rate at 4% as widely expected, and so did Bank Negara Malaysia (2.75%). Only Turkey’s central bank cut as the one-week repo rate dropped by 100bps to 37%; all but two forecasters had expected a bigger cut.
THE WON LOST ON GDP
South Korea’s economy unexpectedly contracted in Q4. GDP fell by -0.3% q/q, a half point shy of consensus. About one-third of consensus expected a dip. The result pushed the won to being the weakest performer among major crosses relative to the USD. Construction sector activity shrank by 5% q/q and manufacturing output fell -1.5% for the first decline since Q1. Services were a bright spot, up 0.6%.
THE FOG REMAINS OVER US DATA
Believe it or not, US data agencies are still playing catch-up with releases covering the period of the government shutdown. Data quality remains in flux.
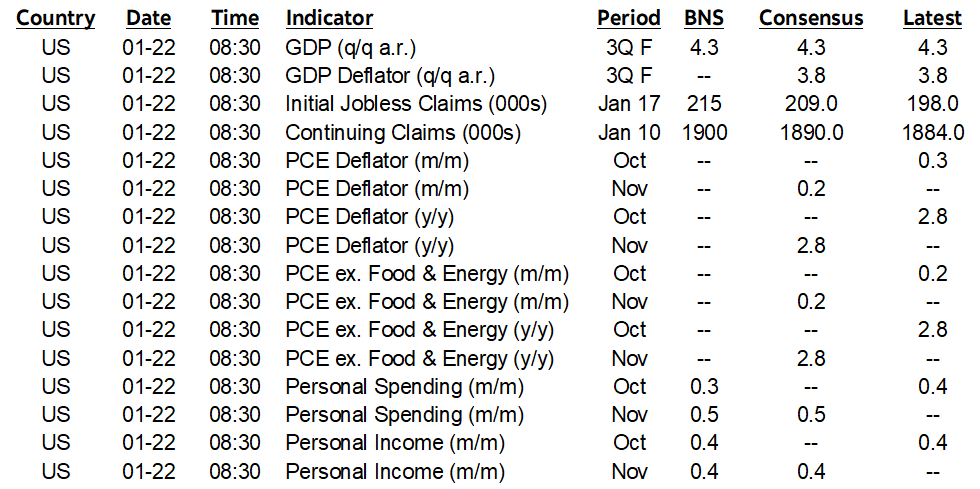
1. Q3 US GDP revisions (8:30amET)
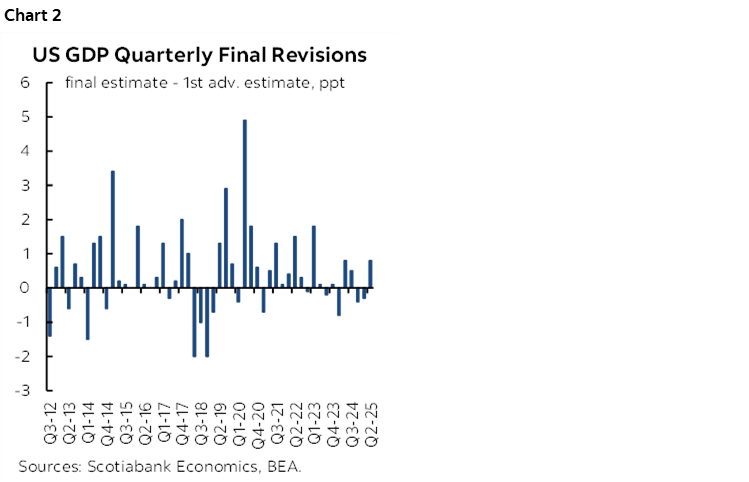
No one expects any material revision and those that expect small ones are doing so on a lark. Uh oh. The US issues quarterly GDP figures in three main rounds: initial, first revision a month later, second revision a month after that. Then there can also be later revisions. The average revision on first pass can be substantial (chart 2). The second pass can be bigger mainly because by then we get more data on the services side of the economy. Bigger revisions used to occur after the Global Financial Crisis than more recently. Will this time also offer small first revisions? That’s tough to tell, given the sampling and data quality issues that may have affected the data out of the shutdown.
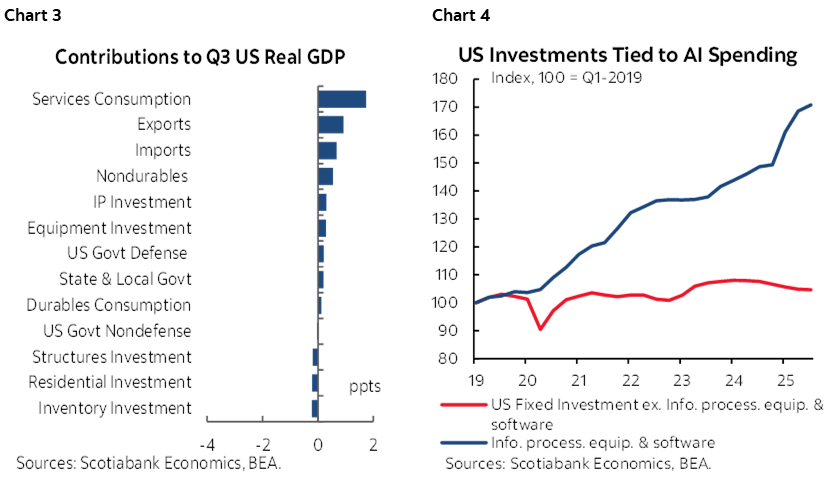
Recall what drove the US economy in Q3 was a surge of consumer spending on services followed by a jump in exports and a drop in imports that in GDP accounting terms is an addition to growth through less of an import leakage effect (chart 3). Also recall that the only game in town when it comes to business investment is AI-related spending; take that out, and business investment in the US economy is gently falling (chart 4). That’s quite unusual given the otherwise strong growth and capacity constraints.
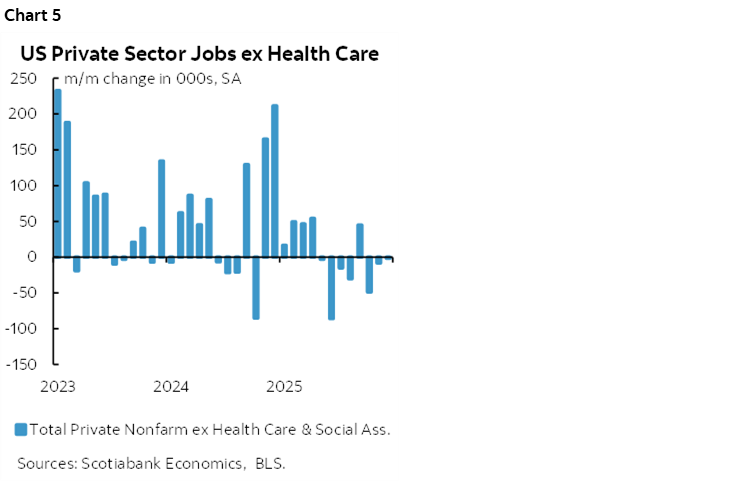
Yet despite this GDP growth, the job market has been weakening this year. The only thing propping up private sector jobs this year has been the health care sector; take that out, and private US nonfarm payrolls have fallen in the majority of the past eight months dating back to ‘Liberation Day’ (chart 5).
2. PCE inflation (8:30amET)
The Federal Reserve’s preferred inflation gauge gets updated this morning. This one’s going to be messy. The BEA previously advised that for prices not collected in October they will average the September and November readings for its estimates included in the personal income and outlays report for October and for the PCE gauges. That could make both the October and November PCE and core PCE m/m readings tough to evaluate from a data confidence standpoint. We may still be able to infer the average m/m rise in the Fed’s preferred PCE ex-food and energy price gauge, but the data quality will remain suspect. A November gain of 0.2% m/m is expected.
We don’t have m/m CPI readings because the opportunity to collect data was lost during October when the government was shut. Recall, however, that we do have producer prices for September through November. The weighted contributions from the pertinent PPI categories that flow through to PCE suggest a 0.1% weighted contribution to core PCE.
In short, the fog remains thick, we’re by no means into the realm of ‘clean’ data yet even if we plug our noses on all the other issues with US data these days.
Also keep an eye on weekly jobless claims. Initial filings for unemployment benefits dipped below 200k the prior week. At least as important is that continuing claims have pulled off the prior peak which matters because of correlations with the unemployment rate.
STATCAN MUST CHANGE RELEASE DAY FOR THE NEXT CPI
Statistics Canada will release its next CPI report for January on Monday February 16th. That’s ‘Family Day’ in Ontario. Other than not being terribly inclusive of the agency, the issue is that Canadian bond and equity markets will be shut. Brilliant. Statcan will lend an artificial advantage to foreign shops to trade the data principally through CAD as local bonds and equities catch up the next day; they shouldn’t be in the business of creating such distortions and favouring some parts of the markets over others. It’s also worth asking whether a federal institution would show as much indifference to releasing on a market holiday if, say, we were talking about Ste. Jean Baptiste Day in Quebec. I’m so used to plugging away on holidays and weekends that we’d cover the release in any event, but the concern is mainly around the ability of market participants to react to any CPI surprise before everyone else has had a chance to do so. #madeincanada.
DISCLAIMER
This report has been prepared by Scotiabank Economics as a resource for the clients of Scotiabank. Opinions, estimates and projections contained herein are our own as of the date hereof and are subject to change without notice. The information and opinions contained herein have been compiled or arrived at from sources believed reliable but no representation or warranty, express or implied, is made as to their accuracy or completeness. Neither Scotiabank nor any of its officers, directors, partners, employees or affiliates accepts any liability whatsoever for any direct or consequential loss arising from any use of this report or its contents.
These reports are provided to you for informational purposes only. This report is not, and is not constructed as, an offer to sell or solicitation of any offer to buy any financial instrument, nor shall this report be construed as an opinion as to whether you should enter into any swap or trading strategy involving a swap or any other transaction. The information contained in this report is not intended to be, and does not constitute, a recommendation of a swap or trading strategy involving a swap within the meaning of U.S. Commodity Futures Trading Commission Regulation 23.434 and Appendix A thereto. This material is not intended to be individually tailored to your needs or characteristics and should not be viewed as a “call to action” or suggestion that you enter into a swap or trading strategy involving a swap or any other transaction. Scotiabank may engage in transactions in a manner inconsistent with the views discussed this report and may have positions, or be in the process of acquiring or disposing of positions, referred to in this report.
Scotiabank, its affiliates and any of their respective officers, directors and employees may from time to time take positions in currencies, act as managers, co-managers or underwriters of a public offering or act as principals or agents, deal in, own or act as market makers or advisors, brokers or commercial and/or investment bankers in relation to securities or related derivatives. As a result of these actions, Scotiabank may receive remuneration. All Scotiabank products and services are subject to the terms of applicable agreements and local regulations. Officers, directors and employees of Scotiabank and its affiliates may serve as directors of corporations.
Any securities discussed in this report may not be suitable for all investors. Scotiabank recommends that investors independently evaluate any issuer and security discussed in this report, and consult with any advisors they deem necessary prior to making any investment.
This report and all information, opinions and conclusions contained in it are protected by copyright. This information may not be reproduced without the prior express written consent of Scotiabank.
™ Trademark of The Bank of Nova Scotia. Used under license, where applicable.
Scotiabank, together with “Global Banking and Markets”, is a marketing name for the global corporate and investment banking and capital markets businesses of The Bank of Nova Scotia and certain of its affiliates in the countries where they operate, including; Scotiabank Europe plc; Scotiabank (Ireland) Designated Activity Company; Scotiabank Inverlat S.A., Institución de Banca Múltiple, Grupo Financiero Scotiabank Inverlat, Scotia Inverlat Casa de Bolsa, S.A. de C.V., Grupo Financiero Scotiabank Inverlat, Scotia Inverlat Derivados S.A. de C.V. – all members of the Scotiabank group and authorized users of the Scotiabank mark. The Bank of Nova Scotia is incorporated in Canada with limited liability and is authorised and regulated by the Office of the Superintendent of Financial Institutions Canada. The Bank of Nova Scotia is authorized by the UK Prudential Regulation Authority and is subject to regulation by the UK Financial Conduct Authority and limited regulation by the UK Prudential Regulation Authority. Details about the extent of The Bank of Nova Scotia's regulation by the UK Prudential Regulation Authority are available from us on request. Scotiabank Europe plc is authorized by the UK Prudential Regulation Authority and regulated by the UK Financial Conduct Authority and the UK Prudential Regulation Authority.
Scotiabank Inverlat, S.A., Scotia Inverlat Casa de Bolsa, S.A. de C.V, Grupo Financiero Scotiabank Inverlat, and Scotia Inverlat Derivados, S.A. de C.V., are each authorized and regulated by the Mexican financial authorities.
Not all products and services are offered in all jurisdictions. Services described are available in jurisdictions where permitted by law.