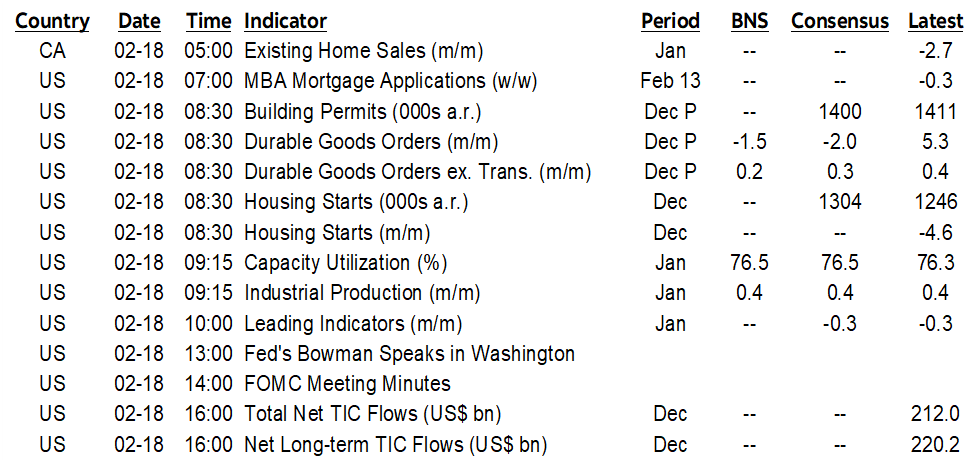
ON DECK FOR WEDNESDAY, FEBRUARY 18TH
KEY POINTS:
- Stocks up ahead of Fed minutes, data
- Bland UK CPI adds a touch to BoE March cut pricing
- The RBNZ’s curious mixture of communications and how markets took it
- Modest US data risk to bring IP, durables and starts
- FOMC minutes to extend the patience message
- Peru tosses President José Jerí
- Aussie wage growth remains firm
- Winter-walloped Canadian home sales creating pent-up demand into Spring
- US tax refund tracking & why refunds may be saved
Stocks are broadly higher to start the day. US and Canadian equity futures are pushing higher and Europe is up by about half a percent to over 1%. Sovereign yields are mostly little changed except for large outperformance by New Zealand’s curve (RBNZ, see below). Watch Peruvian assets this morning amid more political turmoil. Dismiss Canadian home sales and watch US data and FOMC minutes as potential market catalysts.
FOMC Minutes and Modest US Data Risk
Modest US data risk arrives this morning. It will be important to separate utilities out of industrial production given cold, wet, snowy and slushy but otherwise lovely weather (9:15amET). Durable goods orders are likely to drop but strip out planes to evaluate momentum in core orders ex-air and defence (8:30amET). Housing starts are due out for both November and December (8:30amET) as data continues to catch up following the shutdown; there is no consensus for November but curiously a consensus for December.
Minutes to the January 27th–28th FOMC meeting (2pmET) are likely to add further colour to the debate over developments in the dual mandate and hence the Committee’s appetite for future easing. A recap of the decision and communications is here. I would particularly monitor discussion around the decision to de-emphasize labour market risks given the trend declines in US nonfarm payrolls ex-health care and the made-up dip in the unemployment rate with explanations for both here and here.
Watch Peruvian Assets
Peru’s Congress tossed President José Jerí last evening. The sol and local assets will be vulnerable to ongoing political instability. An election is due in April.
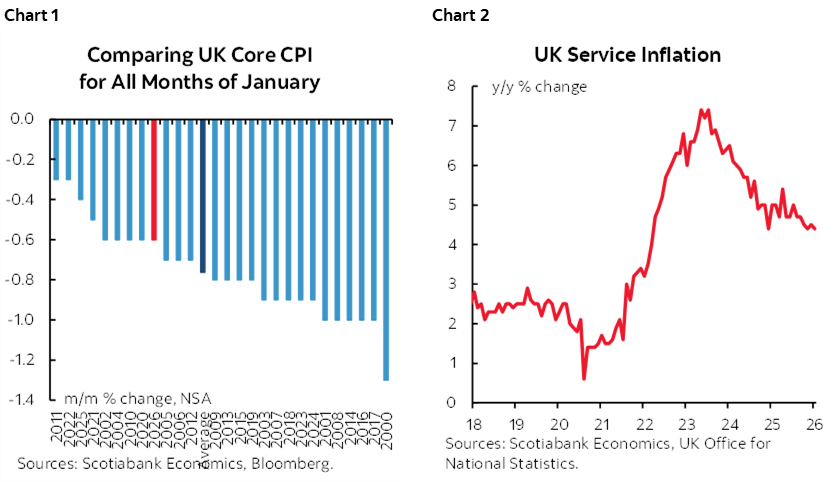
UK Core CPI Softens
UK core CPI added slightly to pricing for a cut at the March 19th BoE decision that now has about 21bps baked in. Core CPI edged lower to 3.1% y/y (3.2% prior) but was a tick higher than consensus expectations for 3.1% because it was slightly firmer than a normal January in month-over-month terms (chart 1) while services inflation edged lower but remains high (chart 2).
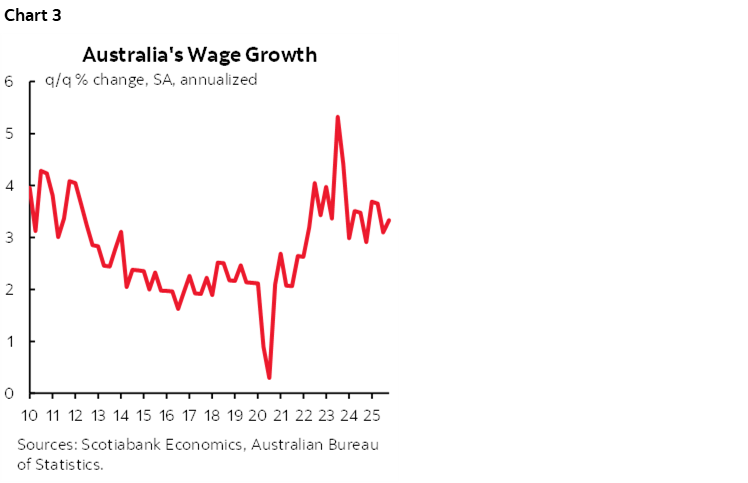
Aussie Wage Growth Lands On Consensus
Australian wage growth landed on consensus at 0.8% q/q SA nonannualized. Annualized q/q growth is shown in chart 3. On a year-over-year basis wages are up 3.4%. The A$ is slightly softer this morning but the Australian rates curve cheapened by 3–4bps across maturities.
The RBNZ’s Curious Communications
The RBNZ held its official cash rate unchanged at 2.25% as universally expected. It was an odd set of communications. On the one hand the headlines from the statement were taken by markets as a touch on the dovish side. Risks to the inflation outlook were described as balanced with headline inflation expected to return to the 1–3% band this quarter and hit the 2% midpoint “over the next 12 months.”
On the other hand, forward rate guidance was slightly raised over the projection horizon compared to November (chart 4). The RBNZ sees the possibility of raising the cash rate before year-end and then hiking by 50bps or so in total by the end of 2027. The RBNZ went from previously forecasting a return to 2% inflation by mid-2026 and now says within 12 months. Not to nitpick but I’ll nitpick about the fact their projections don’t show 2% being achieved until 2027Q2 which is more than 12 months away.
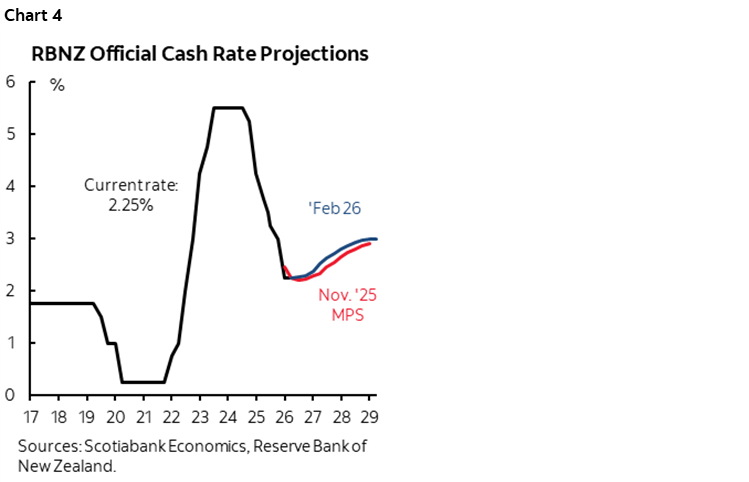
So, is that dovish, less dovish, hawkish, less hawkish, or neutral? I view it as slightly more hawkish. Markets clearly saw it differently by driving NZ 2s 10bps lower in a bull steepener curve move.
Weak Canadian Home Sales Are Building Pent-Up Demand
Canadian home sales fell 5.8% m/m SA in January. That’s the biggest seasonally adjusted drop since last Winter when they fell by about 10% in February 2025 (chart 5). That’s no surprise to folks who live here given it’s one of the worst winters in years as defined by extreme cold and lots of snow. Listings were up 7.3% m/m. The sales to new listings ratio fell to 45% from 51.3% that would normally be interpreted as close to if not in a sellers’ market if not for the weather effect. Months’ supply increased by three-tenths to 4.9 months.
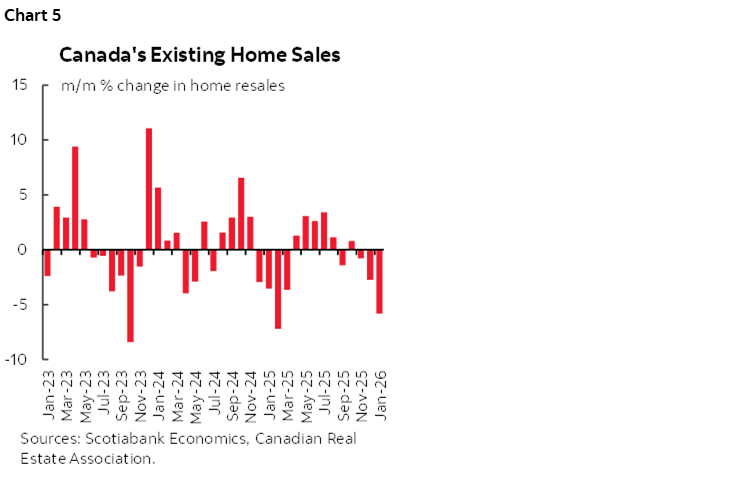
As sales fall, Canada is creating more momentum toward the Spring housing market. A combination of pent-up demand from first-time home buyers, pent-up demand from weather effects, lagging effects of trend job and income gains, low inflation-adjusted borrowing costs and cheaper homes could be powerful catalysts for a rebound. Immigration policy tightening offers mixed effects. Rental and condo markets suffer the loss of temporary residents (international students, temp foreign workers, asylum seekers) but permanent resident immigration continues.
Tracking US Tax Refunds—And Why They’re Overhyped
It’s very early—so early, in fact, that there isn’t terribly much to make of it—but US tax refunds are off to a slow start. The IRS reported yesterday that the average amount refunded has been US$2,290 so far which is up 10.9% from the same period last year but only just over US$200 more than last year’s tracking. That’s a far cry from the ballyhooed surge of refunds. Chart 6 shows this year is tracking slightly higher than prior same periods.
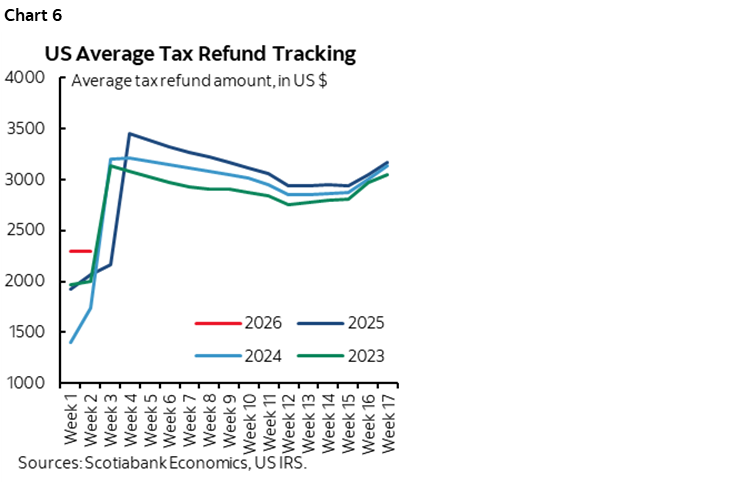
The IRS notes here that the “refund numbers do not include millions of EITC and ACTC refunds to these taxpayers” and that refund numbers for the week ending February 20th to be released on February 27th may move higher as a result.
Another plausible explanation—other than simple misestimation—is that perhaps the early filers are the most desperate for cash and probably lower income filers with smaller refunds.
Still, as argued in my weekly, the refund surge and its impact on consumption is an overhyped argument.
1. We need to look at the numbers for the refunds that are above seasonal norms, not the raw amounts. It’s early for that.
2. It’s not clear that consumers will spend the refunds. That’s not necessarily some Ricardian equivalence argument since Americans never really expect their government to make them pay through fiscal reforms in future versus enduring fiscal profligacy that abuses the country’s reserve currency status. It’s more likely that tax refunds could be saved due to economic uncertainty and to offset the estimated tariff tax hike and ACA insurance cuts. The US saving rate is approaching nothing in real terms so precautionary rebuilding wouldn’t be a surprise.
On net, there is a solid argument for no tax cut benefits on net whatsoever. See my weekly for the arguments and math.
3. Even if consumers do spend refunds, then it’s just a transitory fillip to growth. Up one quarter when the proceeds are blown, then down the next. There is no narrative change from an inter-quarter change in spending.
Canadians know this full well. Think Trudeau bucks, Klein bucks, Ford bucks etc that all had the same transitory effects.
In short, the markets never learn with these games. Folks hop on the refunds or stimulus cheque bandwagon and then stand there with mouths agape when the effects reverse. Spending gets pulled forward.
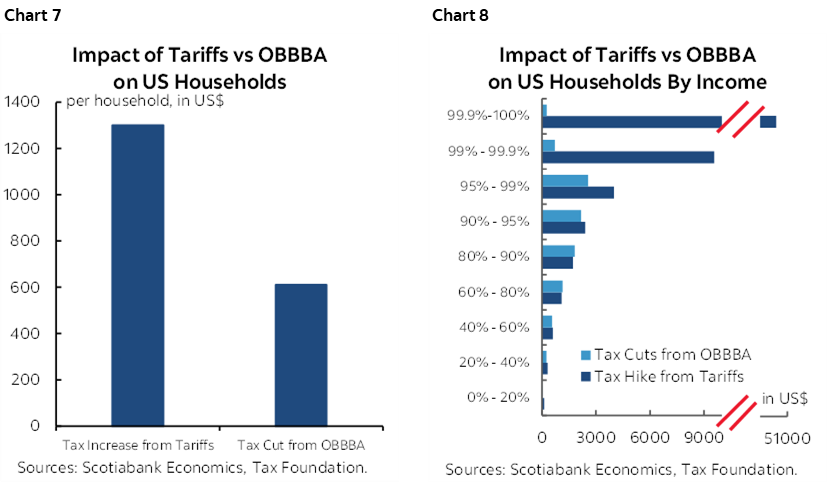
My whole point, however, is that I’m not even sure we get to there anyway since on net there is a large tax hike (tariffs paid for by Americans) to pay for a modest income tax cut. Charts 7&8 show the math in aggregate and by income cohort. To repeat, it’s the biggest fiscal policy con job in the history of US fiscal policy actions to tout an income tax cut that is funded by a tariff tax hike.
DISCLAIMER
This report has been prepared by Scotiabank Economics as a resource for the clients of Scotiabank. Opinions, estimates and projections contained herein are our own as of the date hereof and are subject to change without notice. The information and opinions contained herein have been compiled or arrived at from sources believed reliable but no representation or warranty, express or implied, is made as to their accuracy or completeness. Neither Scotiabank nor any of its officers, directors, partners, employees or affiliates accepts any liability whatsoever for any direct or consequential loss arising from any use of this report or its contents.
These reports are provided to you for informational purposes only. This report is not, and is not constructed as, an offer to sell or solicitation of any offer to buy any financial instrument, nor shall this report be construed as an opinion as to whether you should enter into any swap or trading strategy involving a swap or any other transaction. The information contained in this report is not intended to be, and does not constitute, a recommendation of a swap or trading strategy involving a swap within the meaning of U.S. Commodity Futures Trading Commission Regulation 23.434 and Appendix A thereto. This material is not intended to be individually tailored to your needs or characteristics and should not be viewed as a “call to action” or suggestion that you enter into a swap or trading strategy involving a swap or any other transaction. Scotiabank may engage in transactions in a manner inconsistent with the views discussed this report and may have positions, or be in the process of acquiring or disposing of positions, referred to in this report.
Scotiabank, its affiliates and any of their respective officers, directors and employees may from time to time take positions in currencies, act as managers, co-managers or underwriters of a public offering or act as principals or agents, deal in, own or act as market makers or advisors, brokers or commercial and/or investment bankers in relation to securities or related derivatives. As a result of these actions, Scotiabank may receive remuneration. All Scotiabank products and services are subject to the terms of applicable agreements and local regulations. Officers, directors and employees of Scotiabank and its affiliates may serve as directors of corporations.
Any securities discussed in this report may not be suitable for all investors. Scotiabank recommends that investors independently evaluate any issuer and security discussed in this report, and consult with any advisors they deem necessary prior to making any investment.
This report and all information, opinions and conclusions contained in it are protected by copyright. This information may not be reproduced without the prior express written consent of Scotiabank.
™ Trademark of The Bank of Nova Scotia. Used under license, where applicable.
Scotiabank, together with “Global Banking and Markets”, is a marketing name for the global corporate and investment banking and capital markets businesses of The Bank of Nova Scotia and certain of its affiliates in the countries where they operate, including; Scotiabank Europe plc; Scotiabank (Ireland) Designated Activity Company; Scotiabank Inverlat S.A., Institución de Banca Múltiple, Grupo Financiero Scotiabank Inverlat, Scotia Inverlat Casa de Bolsa, S.A. de C.V., Grupo Financiero Scotiabank Inverlat, Scotia Inverlat Derivados S.A. de C.V. – all members of the Scotiabank group and authorized users of the Scotiabank mark. The Bank of Nova Scotia is incorporated in Canada with limited liability and is authorised and regulated by the Office of the Superintendent of Financial Institutions Canada. The Bank of Nova Scotia is authorized by the UK Prudential Regulation Authority and is subject to regulation by the UK Financial Conduct Authority and limited regulation by the UK Prudential Regulation Authority. Details about the extent of The Bank of Nova Scotia's regulation by the UK Prudential Regulation Authority are available from us on request. Scotiabank Europe plc is authorized by the UK Prudential Regulation Authority and regulated by the UK Financial Conduct Authority and the UK Prudential Regulation Authority.
Scotiabank Inverlat, S.A., Scotia Inverlat Casa de Bolsa, S.A. de C.V, Grupo Financiero Scotiabank Inverlat, and Scotia Inverlat Derivados, S.A. de C.V., are each authorized and regulated by the Mexican financial authorities.
Not all products and services are offered in all jurisdictions. Services described are available in jurisdictions where permitted by law.