

ON DECK FOR THURSDAY, AUGUST 6th

KEY POINTS:
- Markets behaving just like it’s the day before nonfarm
- US job cuts are tracking very low year-to-date
- US productivity growth was weak for a second straight quarter
- US continuing claims ticked up
- Revelio suggests moderate payrolls expansion but has a poor track record
- Banxico to stay on hold with Fed spread at the wides
- The Fed and midterms
- The real reasons why Trump threatens wildfire tariffs
- German factories are doing rather well
- Swedish inflation slams rates
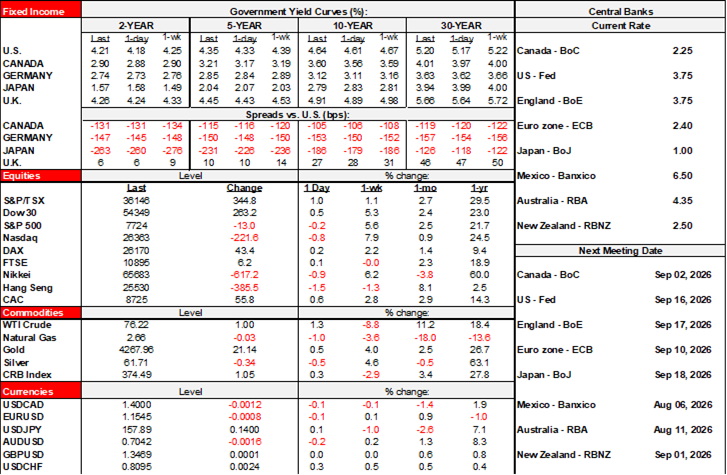
It must be Thursday before payrolls. Global asset classes are treading carefully ahead of the world’s biggest single economic indicator with a side order of Canadian jobs to go with it. Stocks are somewhat mixed with S&P futures flat and a mild loss in Nasdaq futures with chips on the run. TSX futures are also flat and European cash markets are up a bit after Asia-Pacific benchmarks saw losses on the Kospi (-4½%), Nikkei 225 (-0.9%) and Hang Seng (-1½%). Sovereign bond yields are moving up by about 2–3bps across US and Canadian curves but Sweden’s curve was smacked by CPI (see below). Oil is up a few dimes and currencies are mixed with mostly little movement to the dollar.
WHY TRUMP IS CALLING WARSH SO OFTEN
I found it amusing to see headlines last evening about how Trump has repeatedly called Chair Warsh since he took the helm at the Fed. Amused, not surprised. Other than the obvious concern about political meddling, it offers another opportunity to address market pricing for a hike in either September or October which speaks to the reason why Trump appears to be panicking. Perhaps he should chill.
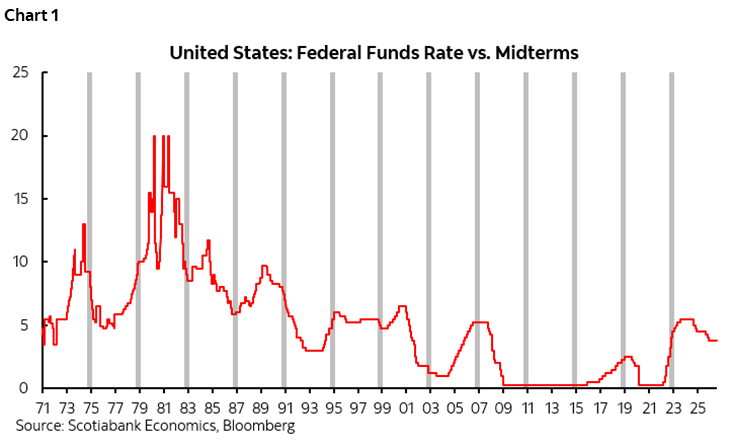
In addition to all of the other arguments that I’ve offered over time for why I think it would be policy error to do as markets believe, note that the Federal Reserve has never initiated a fresh tightening cycle in September or October in a year with US midterm elections. Never. It has continued previously started tightening cycles, but never started one in the couple of months before the vote (chart 1).
So, how bold do you wish to be, Mr. Warsh? To what lengths do you wish to go in order to make a point of your independence? Put another way, how much criticism do you wish to take for not hiking because of politics? How hard do you wish to bite the hand that fed you? Put yet another way, how much harassment and potentially fresh oversight challenges by Congress does Warsh wish to invite? Amid plunging polls, a rate hike or two right before voters weigh in could strongly add to the administration’s affordability woes.
THE PRE-NONFARM US DATA GRIND
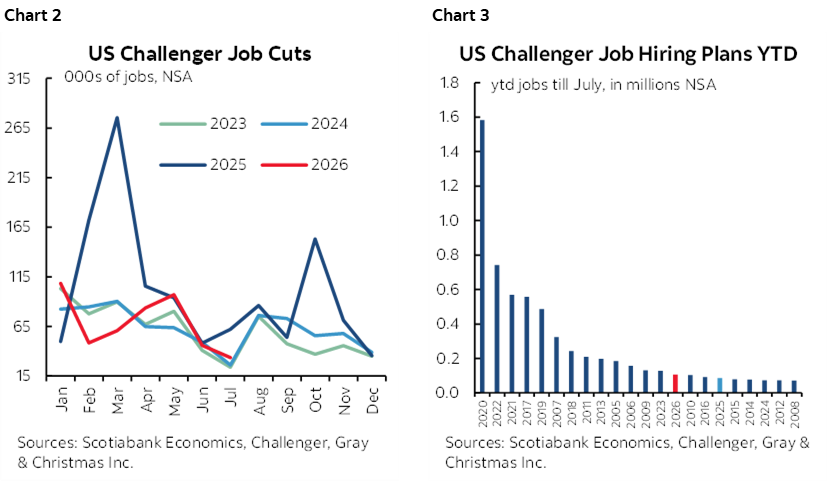
US Challenger job cuts landed at 33.4k in July. That’s the lowest reading since mid-2023, although the figures are not seasonally adjusted. Over recent years, Challenger normally peaks early in the year perhaps when companies are delivering cuts as part of window dressing before financial reports and then wane by summer (chart 2). Layoffs are actually quite low on a year-to-date basis (chart 3).
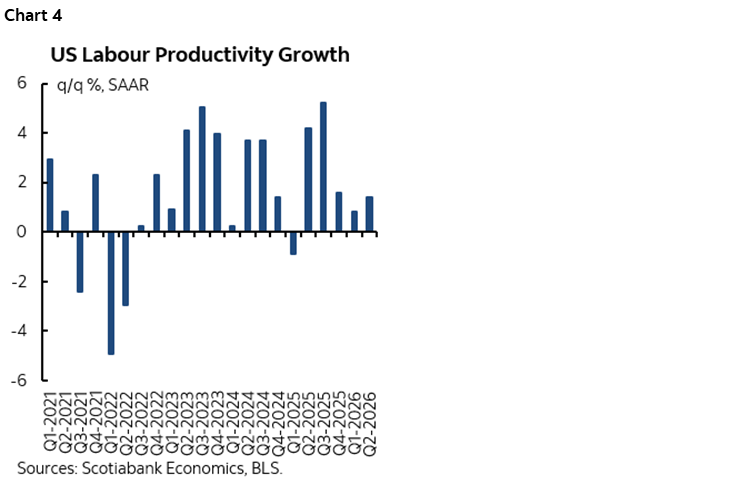
US productivity growth put in another weak quarter but not as weak as expected. The Q2 figures grew by 1.4% q/q (consensus 0.6%, Scotia 0.8%) and Q1 was revised up a half point to 0.8% q/q. Labour productivity only grew by 0.3% in Q1 and before that 1.6% in Q4 which followed two outsized quarterly gains in Q2 and Q3 last year. If there is a productivity miracle unfolding in the US, then it’s a rather erratically behaving one (chart 4). Unit labour costs accelerated by 1.3% q/q and were revised down by a half point to 1.3% in Q1.
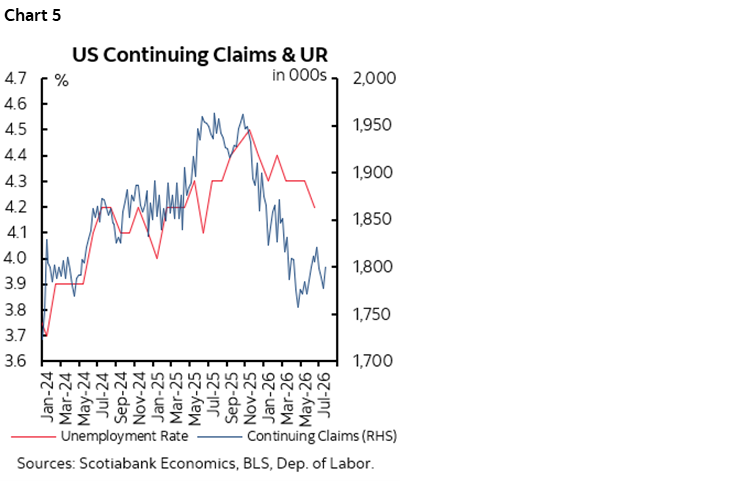
US weekly jobless claims were also refreshed. Initial applications to continue to hover around 200k/week. Continuing claims may be more interesting in that they’ve been falling again of late and are correlated with the US unemployment rate (chart 5) but ticked up this morning.
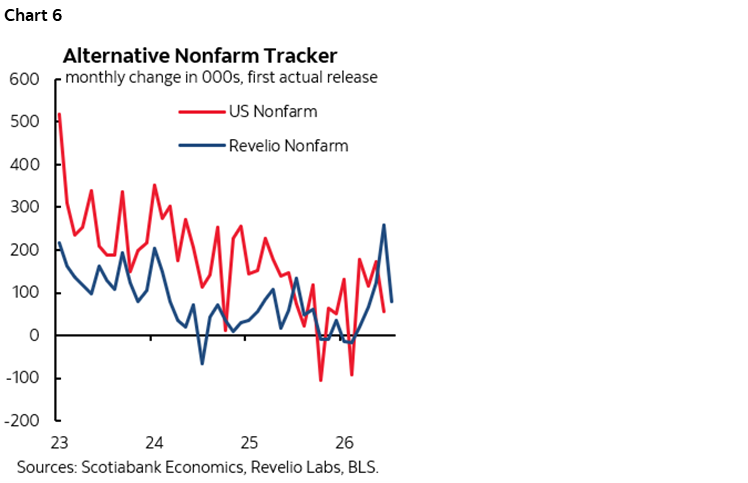
Also note that Revelio’s nonfarm payrolls reading was up by 79,200 in July as reported this morning. It has a poor track record at predicting nonfarm pre-revisions (chart 6).
GERMAN FACTORIES ARE DOING WELL
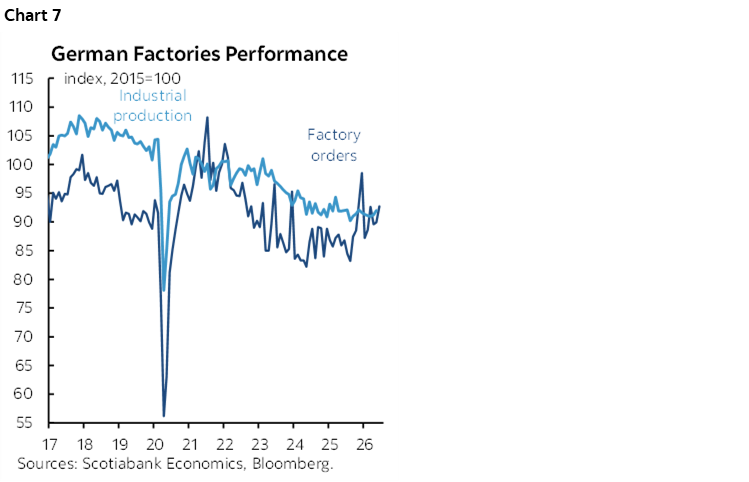
German factories have been doing pretty well over the past year. Factory orders have been trending higher (chart 7) and another gain of 3.1% m/m SA was recorded in June. Some of that gain was because the prior month’s rise was revised lower (0.3% instead of 1.9%). Orders for capital goods were up 11.8% m/m with orders for consumer goods up 12.7% mostly through smaller-ticket nondurable goods (19.2% m/m) but bigger ticket durable goods orders were also up 3.8%. By sector, orders were sharply up for computers and electronics (11.8% m/m), higher for autos (3.8%) and the engineering category (12.7%) while orders for chemicals remain on a downward trend. Who is ordering all of this stuff? Domestic buyers, as domestic factory orders were up 7.8% m/m in June with foreign orders flat (0.2%) and domestic firms dominated orders for capital goods and consumer goods.
SWEDISH INFLATION HITS BONDS
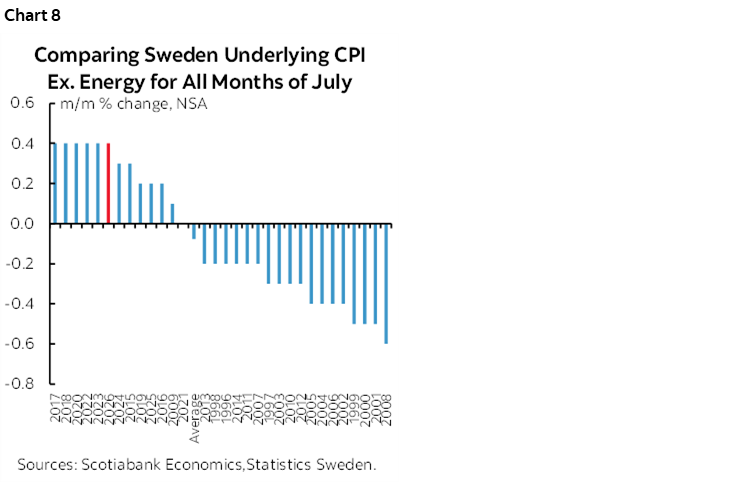
Somewhat firmer than expected Swedish inflation readings for July drove the krona to outperform most other major currencies this morning while sending Swedish government bond yields sharply higher by 4–7bps across the curve in bull flattener fashion. Key is that underlying inflation ex-energy jumped by 0.4% m/m, or four times faster than consensus albeit that consensus had very few entries. Chart 8 shows how strong the seasonally unadjusted gain was in comparison to like months of July in history. Markets raised hike pricing by about 5bps to 34bps by December with low change at a hike on August 20th, half a chance in September, most of a chance in November and over a full quarter point by December.
BANXICO TO STAY ON HOLD
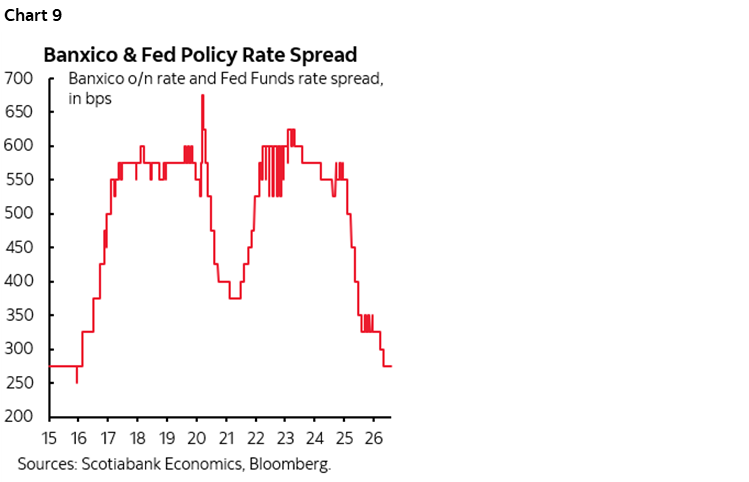
Mexico’s central bank is unanimously expected to stay on hold this afternoon at an overnight rate of 6.5% (3pmET). Banxico last cut at the May meeting and held in June. The policy rate spread relative to the Fed is at the historic wides which would make further easing dicey for the peso especially if the Fed were to actually tighten policy (chart 9). Banxico was clear when it last cut in May that it would “conclude the cycle that began in March 2024.”
CANADA TREADS WATER BEFORE JOBS
Canada should be quiet today ahead of tomorrow’s Labour Force Survey for July. Only S&P’s PMIs for July are on tap (9:30amET) and they don’t have a material following in Canada.
THE RATIONALE BEHIND IRRATIONAL WILDFIRE TARIFFS
What are the real reasons behind why Trump threatens wildfire tariffs against Canada? I mean, when something is so blindingly irrational as to defy any clear-headed justification, one has to consider other motives. It’s not like tariffs will blow the smoke away or stop forest fires. It’s not like they’ll fund a wall or a whole line-up of big fans at the border to keep the smoke out. It’s not like wildfires are unique to Canada as forests are ablaze in the US and Europe. Memo to Washington — it’s bloody hot! It’s not like a country as vast as Canada can avoid them. A more constructive approach would be nice after Canada sent water bombers and crews to help with California’s blazes and cross-border sharing of fire fighting resources has long existed. So what gives? Here are my theories:
- Like all other tariffs that the Trump administration proposes, the aim is to hike taxes on Americans in clandestine fashion using whatever excuse is needed to do so howsoever silly and to always make it sound like you’re doing so to punish someone else. A preponderance of studies by global groups show that tariffs ultimately get paid by American consumers and American businesses. Why do this? Because Washington’s deficit stands at 5.7% of GDP and the Trump administration has chosen to run pro-cyclical fiscal policy that has kept the deficit high for years without seizing the opportunity to rein it in. There is something much less magical about US economic performance than often understood as chips and data center subsidies alongside procyclical fiscal policy have artificially buoyed growth and contributed to inflation. In order to fund tax cuts in the ‘Big Beautiful Bill,’ the Trump administration has opted for tariff revenues wherever it can get them which greatly pleases Treasury Secretary Bessent who is overseeing this mess with apparently little concern. That includes falsely labelling Canadians as mules and human traffickers. It includes bogus forced labour tariffs. You raise tariffs through whatever abuse of past pieces of legislation you can get away with until the courts and polls push back because directly raising taxes on Americans would be political suicide and yet the US has gone further. It’s raising taxes on lower- and middle-income Americans through tariffs in order to fund tax cuts for companies and upper-income Americans in highly regressive fashion. In short, it’s a fiscal policy shell game that polls indicate many Americans are onto as they pay more and more for everything.
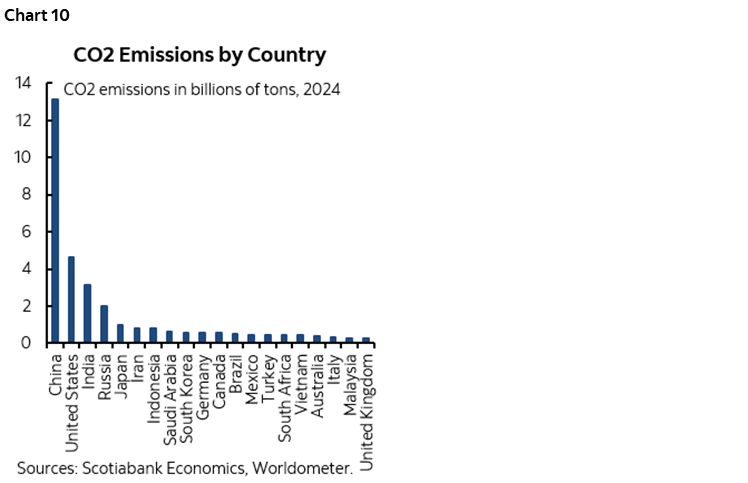
- Blame Canada is a recurring theme in Washington any time a reason crops up to deflect criticism. The Trump administration makes no excuses for being climate science deniers, rejecting evidence of global warming and the root causes. The US is #2 on the list of the world’s biggest greenhouse gas emitting nations right behind China (chart 10) and the Trump administration’s policies are maligned against cleaner energy and likely to further contribute to GHG emissions. There are many adjustments that can be made—like climate and population etc—but global warming is driven in part by aggregate GHG emissions sans adjustments. So, when the consequences whiff into Washington’s air, you blame Canada instead of fixing your own house.
DISCLAIMER
This report has been prepared by Scotiabank Economics as a resource for the clients of Scotiabank. Opinions, estimates and projections contained herein are our own as of the date hereof and are subject to change without notice. The information and opinions contained herein have been compiled or arrived at from sources believed reliable but no representation or warranty, express or implied, is made as to their accuracy or completeness. Neither Scotiabank nor any of its officers, directors, partners, employees or affiliates accepts any liability whatsoever for any direct or consequential loss arising from any use of this report or its contents.
These reports are provided to you for informational purposes only. This report is not, and is not constructed as, an offer to sell or solicitation of any offer to buy any financial instrument, nor shall this report be construed as an opinion as to whether you should enter into any swap or trading strategy involving a swap or any other transaction. The information contained in this report is not intended to be, and does not constitute, a recommendation of a swap or trading strategy involving a swap within the meaning of U.S. Commodity Futures Trading Commission Regulation 23.434 and Appendix A thereto. This material is not intended to be individually tailored to your needs or characteristics and should not be viewed as a “call to action” or suggestion that you enter into a swap or trading strategy involving a swap or any other transaction. Scotiabank may engage in transactions in a manner inconsistent with the views discussed this report and may have positions, or be in the process of acquiring or disposing of positions, referred to in this report.
Scotiabank, its affiliates and any of their respective officers, directors and employees may from time to time take positions in currencies, act as managers, co-managers or underwriters of a public offering or act as principals or agents, deal in, own or act as market makers or advisors, brokers or commercial and/or investment bankers in relation to securities or related derivatives. As a result of these actions, Scotiabank may receive remuneration. All Scotiabank products and services are subject to the terms of applicable agreements and local regulations. Officers, directors and employees of Scotiabank and its affiliates may serve as directors of corporations.
Any securities discussed in this report may not be suitable for all investors. Scotiabank recommends that investors independently evaluate any issuer and security discussed in this report, and consult with any advisors they deem necessary prior to making any investment.
This report and all information, opinions and conclusions contained in it are protected by copyright. This information may not be reproduced without the prior express written consent of Scotiabank.
™ Trademark of The Bank of Nova Scotia. Used under license, where applicable.
Scotiabank, together with “Global Banking and Markets”, is a marketing name for the global corporate and investment banking and capital markets businesses of The Bank of Nova Scotia and certain of its affiliates in the countries where they operate, including; Scotiabank Europe plc; Scotiabank (Ireland) Designated Activity Company; Scotiabank Inverlat S.A., Institución de Banca Múltiple, Grupo Financiero Scotiabank Inverlat, Scotia Inverlat Casa de Bolsa, S.A. de C.V., Grupo Financiero Scotiabank Inverlat, Scotia Inverlat Derivados S.A. de C.V. – all members of the Scotiabank group and authorized users of the Scotiabank mark. The Bank of Nova Scotia is incorporated in Canada with limited liability and is authorised and regulated by the Office of the Superintendent of Financial Institutions Canada. The Bank of Nova Scotia is authorized by the UK Prudential Regulation Authority and is subject to regulation by the UK Financial Conduct Authority and limited regulation by the UK Prudential Regulation Authority. Details about the extent of The Bank of Nova Scotia's regulation by the UK Prudential Regulation Authority are available from us on request. Scotiabank Europe plc is authorized by the UK Prudential Regulation Authority and regulated by the UK Financial Conduct Authority and the UK Prudential Regulation Authority.
Scotiabank Inverlat, S.A., Scotia Inverlat Casa de Bolsa, S.A. de C.V, Grupo Financiero Scotiabank Inverlat, and Scotia Inverlat Derivados, S.A. de C.V., are each authorized and regulated by the Mexican financial authorities.
Not all products and services are offered in all jurisdictions. Services described are available in jurisdictions where permitted by law.