

ON DECK FOR WEDNESDAY, AUGUST 26th
KEY POINTS:
- US Ts underperform on US data, await Nvidia, tariff risks
- Estimating tariff passthrough into Canadian CPI…
- …and the BoC is unlikely to look through it and other drivers
- The states most affected by Canada’s tariffs
- Canadian bank earnings continue to beat
- Aussie inflation reignites RBA hike pricing
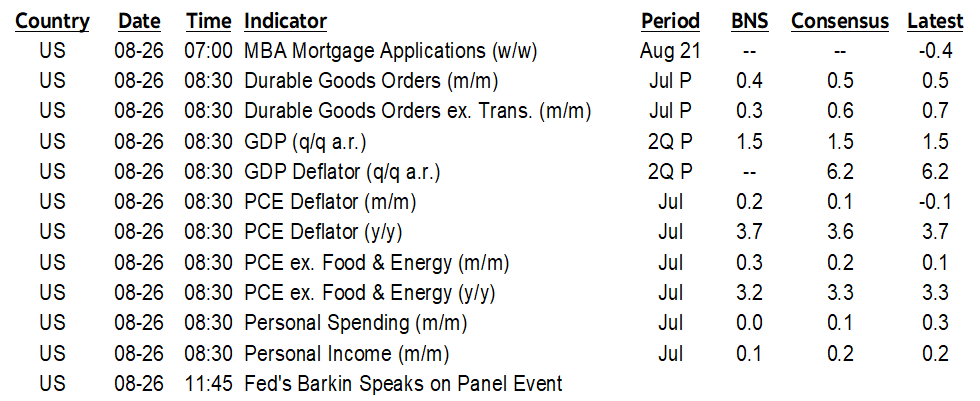
- US core PCE is down but not out
- US real consumer spending stalled in July
- …as incomes picked up but against a miserable trend
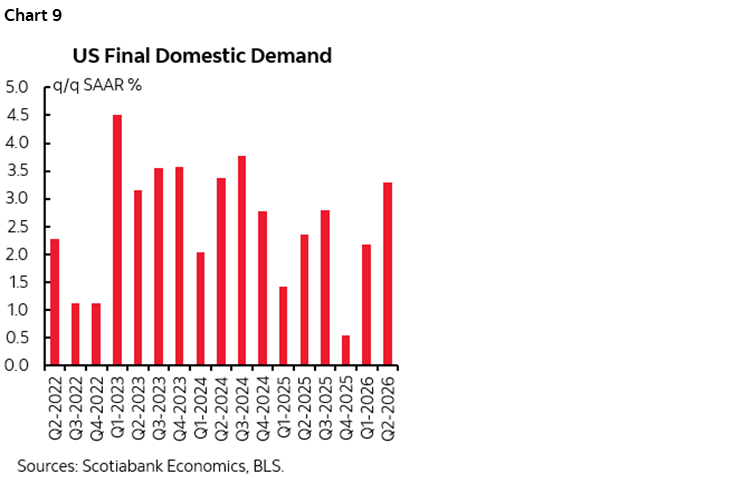
- US Q2 GDP unrevised as consumption revisions offset elsewhere
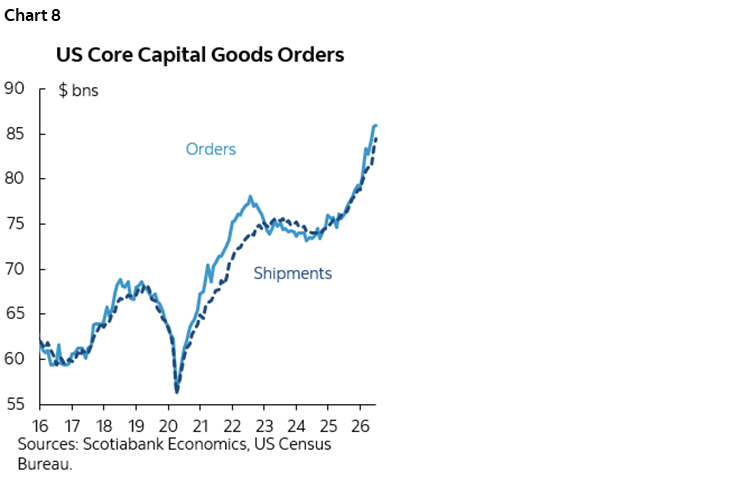
- US core durable goods orders are still soaring
Lower oil prices are once again knocking back the petrocurrencies like CAD and NOK; WTI and Brent are about a couple of bucks lower. Why is oil falling? Well, did you notice how Trump’s pivot to pick on Canada has no one talking about Iran? I’m not sure that we should declare that as a deliberate outcome or merely a byproduct of miscalculation through overplaying their hand on Friday night, but either way, Iran is rather liking it, and the Iran hawks have succumbed to ADHD. US Ts are underperforming other global sovereign benchmarks despite lower oil and partly due to US data (see below). CGBs are also broadly cheaper on US data and tariff concerns with implications for the BoC.
The only notable overnight development other than a Bank of Thailand hold that surprised no one was a hot Australian trimmed mean CPI print that rattled OIS pricing for a series of RBA meetings into year-end. Equities are mostly higher in Europe but hinting at a weak session in N.A. perhaps because of Nvidia’s earnings in the after-market, uncertainty around US data risk this morning, and next steps in the Canada-US ‘war’ sans shooting.
What a lovely backdrop for Chair Warsh’s speech on Friday in which he’s dealing with a Treasury Secretary who secretly pines for his job while toying with bond and FX markets, plus a new inflation threat from Trump’s trade wars.
Tariff watch also continues. There is a newswire piece quoting some anonymous US source saying that the US is working on retaliation against Canada, again. Go on, Make Americans Pay Again (MAPA). We don’t know the source and whether it’s someone who matters or an unelected and uninvested relative outsider.
And yet I’ll continue to emphasize that the US has picked a fight not with Carney, but with the whole country given polling evidence. Carney also continues to have very strong trans-Atlantic ties that he built up through two stints as a top central banker and will address the EU Parliament to deliver a State of the Union speech on September 16th (here). Carney seeks a broader deal with the EU and has become a poster boy of global resistance to Trump. Heaven knows Europe lacked one itself with Starmer et al. Perhaps Europe will get some inspiration.
I’ll also provide initial estimates of what could happen to Canadian CPI following retaliatory tariffs. Otherwise, Canada’s calendar is quiet with only National Bank’s earnings beat (adjusted EPS $3.25, consensus $3.16) to ponder as an extension of the beats started by BNS and BMO yesterday.
ESTIMATING THE CPI IMPACT OF CANADA’S RETALIATORY TARIFFS
Exactly how much pain in the form of higher prices would Canada’s retaliatory tariffs impose on Canadians? It’s no easy task to estimate the effects but my colleague Jay Parmar and I offer the following insights based on no further adjustments to what was announced yesterday.
Before starting, see yesterday’s announcement here, the list of targeted products here, and the accompanying policy supports here. Realize that Canada is playing the 2018 book all over again. Ohio—which makes or breaks many US presidents—holds the dubious distinction of being the most targeted state in the breakdown of the affected dollars of exports to Canada by state (chart 1). Canada’s tariffs affect about 8–9% of imports from the US and Ohio’s exposure is more than twice what it is once you get down to the 10th on the list. The aim is very deliberately oriented toward repeating the 2018 experience by targeting states where the races are close, where tariffs can have maximum effect like Harley Davidson’s plants in Wisconsin and Pennsylvania, and that are more often than not GOP friendly (here).
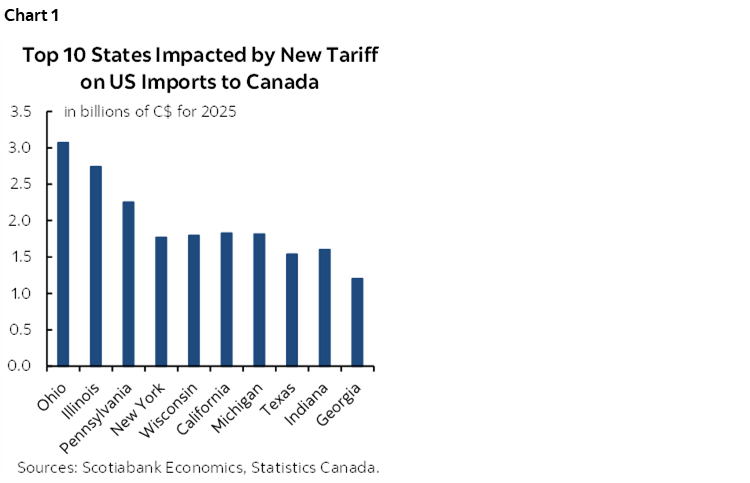
Chart 2 shows the share of US imports into Canada being targeted according to the size of the tariff (!5%, 25% or 50%). About two-thirds of the targeted imports face the highest 50% tariff.
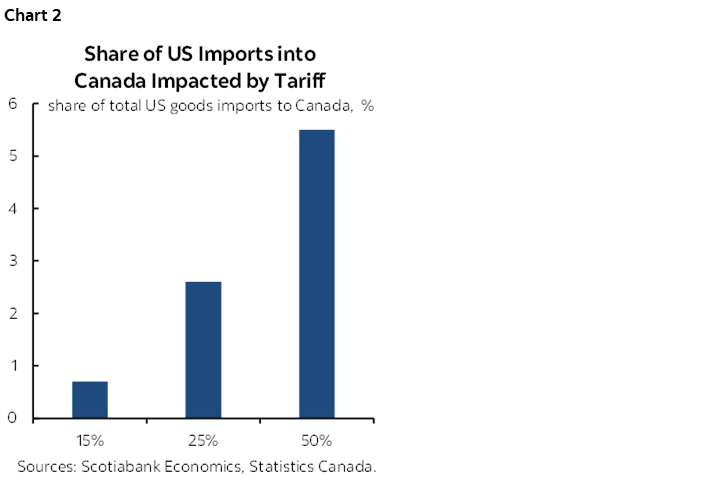
Chart 3 breaks down the share of the Canadian CPI basket by targeted item and tariff rate. The furthest right column shows the weighted contribution to higher prices if all tariffs are fully passed through with no second-round effects.
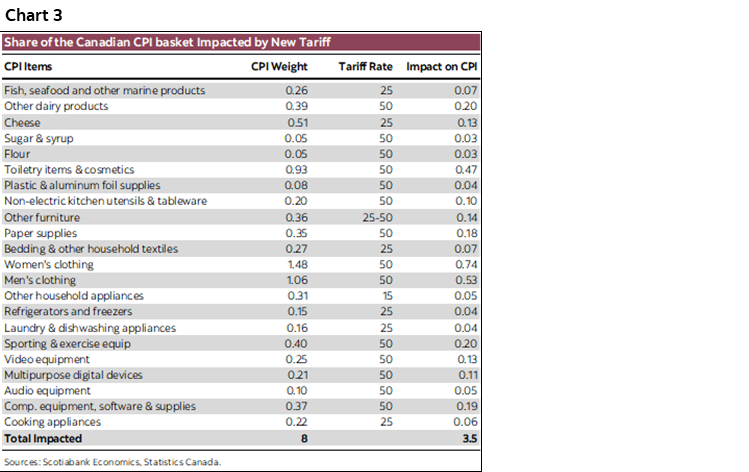
We figure as a very crude first pass that the just over 8% share of the CPI basket that is affected by the retaliatory tariffs will equate to about a 3.5% lift to CPI.
Except it won’t. CPI won’t rise by 3.5%. Theoretically it could go up by much less or much more. The latter would be triggered by second-round effects on wages and pricing behaviour plus the effects of fiscal policy easing and supports. Recall that Canada is a middle ground on second-round effects between the US labour market that clears and sets wages closer to real time, versus Europe’s dominant collective bargaining exercises. About one-third of Canadian workers are unionized (10% in the US).
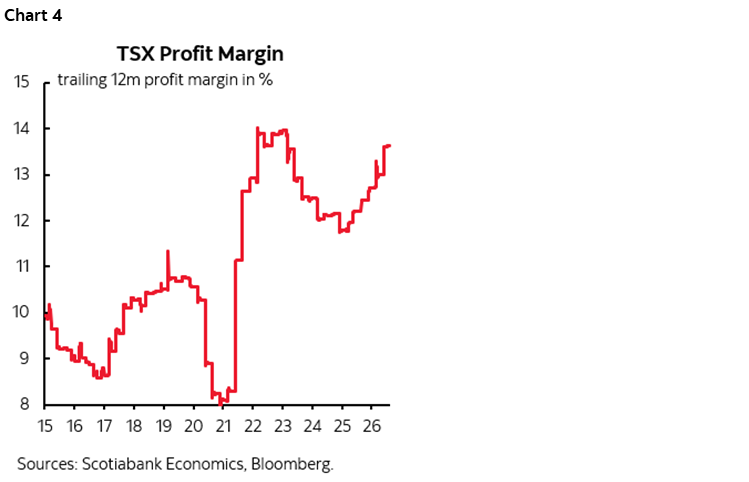
The more likely outcome is that much less than 3½% gets passed through. One reason is that there is some slack in Canada’s economy which may lessen the ability to pass on costs. Another is that profit margins are very high (chart 4) which might lead some companies to absorb the higher costs in margins but with varying effects by industry. A limit to this argument, however, is that eventually shareholders could pressure management to share the burden. Further, inventories are moderate relative to sales but expect orders to surge before the September 8th imposition of the retaliatory tariffs in such fashion as to stockpile inventories ahead of the holiday shopping season. That could mean a delayed fuse on pass through and perhaps little to none of sensibilities return.
BoC research has been mixed. Early work based on the 2018 experience suggested that there is high pass through of tariffs into CPI; they figured that the 2018 experience informed an assumed 75% rate of pass through into CPI within six quarters. Work done this summer trimmed this estimate back to about one-quarter pass through of more recent 25% tariffs with little spillover effects and rapid reversal after tariffs are removed.
And so if one-quarter pass through over six quarters does indeed apply today, then it would imply CPI rises by just shy of a full percentage point by 2027H2. Recall that trimmed mean and weighted median CPI exclude the effects of changes in indirect taxes like tariffs, but not the indirect effects of pass through which is ultimately what matters versus the sticker tariff rates.
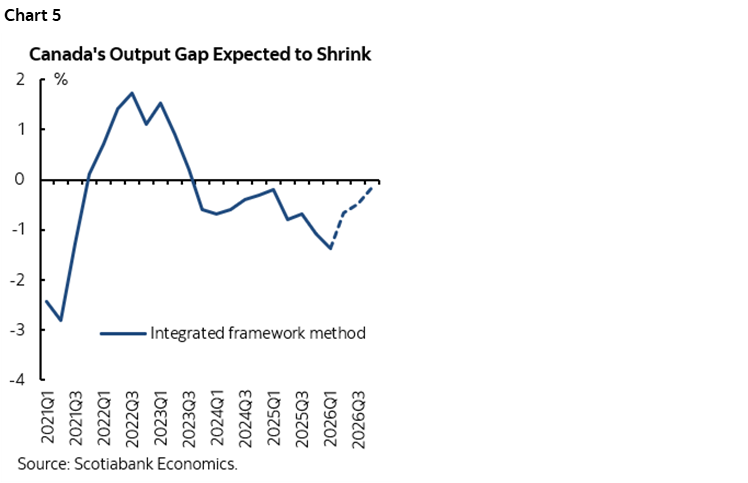
And yet today is different. The breadth of tariffs is greater. The uncertainty over future actions is high which could mean it all goes away quickly, or serial shocks build or we’re in some sort of tariff purgatory, call it penance for past misdeeds we simply don’t understand. The economy has been rebounding and slack in the economy is probably diminishing (chart 5). CAD has depreciated by about 18 cents since 2021. Fiscal policy easing is likely to be large at the Federal and provincial levels of government. Canada is embracing a much greater interventionist agenda in terms of big-ticket project and defence spending.
Key, however, is how monetary policy adjusts. We have factored into our inflation forecasts some monetary tightening, say 50–75bps of hikes. Tightening could thwart some of the pass through effects and tamp down the CPI hit. So, would the BoC look through such an inflation shock? The BoC’s research might lean against viewing it as a short-term one-off price level shock. Can you look through it for 1–2 years when it would be difficult to disentangle all of the effects? Would it be wrapped up in various other demand- and supply-side shocks when you’re already at the lower bound of neutral and basically zero if not negative on the real policy rate? With fiscal zooming ahead? With Canada extracting income for the world economy through the commodity-induced improvement in the terms of trade? Bahhh, details, details, just look through everything, right?
Good luck with that view, but we need to hear Governor Macklem’s view. Will he rear up at Jackson Hole? If he does, then I would be very surprised if his tone were to be dovish, less surprised if we see his knees knocking should someone ask the inevitable inflation question.
AUSSIE CPI REIGNITES RBA HIKE PRICING
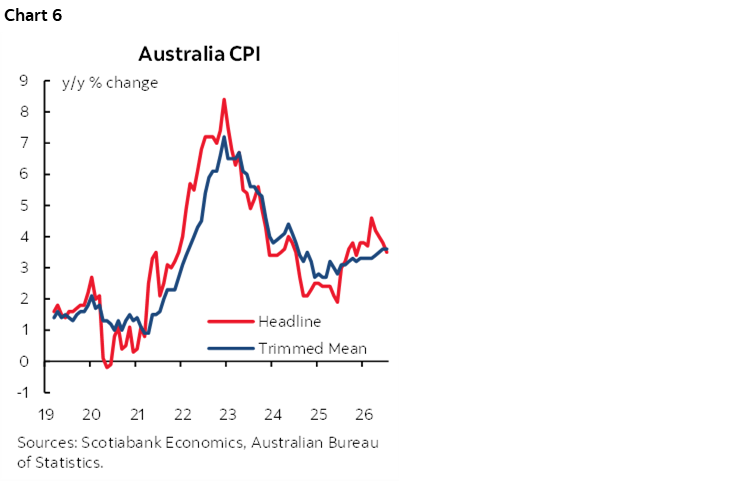
Australian CPI for July came in higher than expected and drove the A$ to be the strongest major cross to the dollar. The result also pushed the Australian two-year yield up 5bps and raised RBA hike pricing by 6bps for September 29th, 8bps to 21s in November and most of a hike by December. CPI increased by 1% m/m NSA (0.9% consensus). Trimmed mean CPI was up 0.5% m/m but that one is seasonally adjusted and hence the magnitude of the rise is more disconcerting. Chart 6.
US MACRO READINGS—CORE PCE IS STILL TAME
US core PCE inflation landed at 0.246% m/m SA in July. Newswires rounded that down to 0.2% but it was the teeniest of smidges away from rounding up to 0.3%. Perhaps that’s why US 2-year Treasuries were so volatile around the releases.
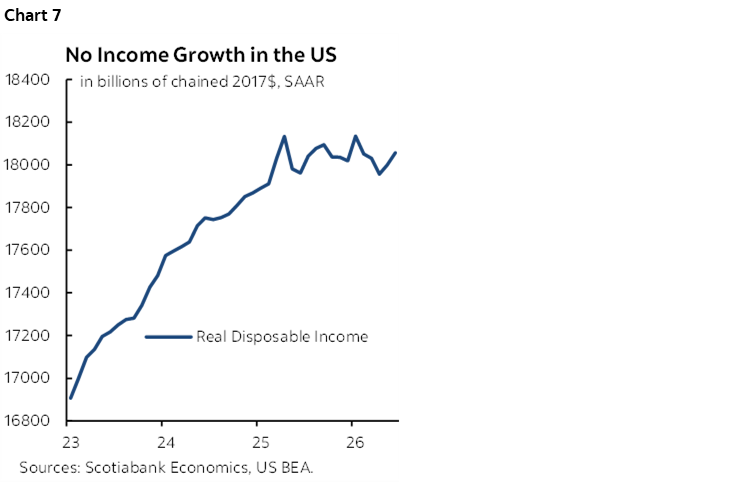
US personal income picked up to 0.4% m/m SA in July (0.2% consensus) but remains weak in real terms with a long-term pattern of no growth (chart 7).
US durable goods orders jumped by 1.1% m/m SA in July (0.5% consensus) but core orders ex-defence and air were only up 0.2% m/m SA albeit with an upward revision to the prior month to 1.7% m/m from 1.2% to make for a net beat including revisions. Core orders remain on a strong upward trajectory (chart 8)
US Q2 GDP was left unchanged at 1.5% but consumption was revised up to 3.4% q/q SAAR from 3.2%. Offsets were minor negative revisions to inventories and investment and net exports. The domestic economy accelerated, however, as indicated by final domestic demand (chart 9).
DISCLAIMER
This report has been prepared by Scotiabank Economics as a resource for the clients of Scotiabank. Opinions, estimates and projections contained herein are our own as of the date hereof and are subject to change without notice. The information and opinions contained herein have been compiled or arrived at from sources believed reliable but no representation or warranty, express or implied, is made as to their accuracy or completeness. Neither Scotiabank nor any of its officers, directors, partners, employees or affiliates accepts any liability whatsoever for any direct or consequential loss arising from any use of this report or its contents.
These reports are provided to you for informational purposes only. This report is not, and is not constructed as, an offer to sell or solicitation of any offer to buy any financial instrument, nor shall this report be construed as an opinion as to whether you should enter into any swap or trading strategy involving a swap or any other transaction. The information contained in this report is not intended to be, and does not constitute, a recommendation of a swap or trading strategy involving a swap within the meaning of U.S. Commodity Futures Trading Commission Regulation 23.434 and Appendix A thereto. This material is not intended to be individually tailored to your needs or characteristics and should not be viewed as a “call to action” or suggestion that you enter into a swap or trading strategy involving a swap or any other transaction. Scotiabank may engage in transactions in a manner inconsistent with the views discussed this report and may have positions, or be in the process of acquiring or disposing of positions, referred to in this report.
Scotiabank, its affiliates and any of their respective officers, directors and employees may from time to time take positions in currencies, act as managers, co-managers or underwriters of a public offering or act as principals or agents, deal in, own or act as market makers or advisors, brokers or commercial and/or investment bankers in relation to securities or related derivatives. As a result of these actions, Scotiabank may receive remuneration. All Scotiabank products and services are subject to the terms of applicable agreements and local regulations. Officers, directors and employees of Scotiabank and its affiliates may serve as directors of corporations.
Any securities discussed in this report may not be suitable for all investors. Scotiabank recommends that investors independently evaluate any issuer and security discussed in this report, and consult with any advisors they deem necessary prior to making any investment.
This report and all information, opinions and conclusions contained in it are protected by copyright. This information may not be reproduced without the prior express written consent of Scotiabank.
™ Trademark of The Bank of Nova Scotia. Used under license, where applicable.
Scotiabank, together with “Global Banking and Markets”, is a marketing name for the global corporate and investment banking and capital markets businesses of The Bank of Nova Scotia and certain of its affiliates in the countries where they operate, including; Scotiabank Europe plc; Scotiabank (Ireland) Designated Activity Company; Scotiabank Inverlat S.A., Institución de Banca Múltiple, Grupo Financiero Scotiabank Inverlat, Scotia Inverlat Casa de Bolsa, S.A. de C.V., Grupo Financiero Scotiabank Inverlat, Scotia Inverlat Derivados S.A. de C.V. – all members of the Scotiabank group and authorized users of the Scotiabank mark. The Bank of Nova Scotia is incorporated in Canada with limited liability and is authorised and regulated by the Office of the Superintendent of Financial Institutions Canada. The Bank of Nova Scotia is authorized by the UK Prudential Regulation Authority and is subject to regulation by the UK Financial Conduct Authority and limited regulation by the UK Prudential Regulation Authority. Details about the extent of The Bank of Nova Scotia's regulation by the UK Prudential Regulation Authority are available from us on request. Scotiabank Europe plc is authorized by the UK Prudential Regulation Authority and regulated by the UK Financial Conduct Authority and the UK Prudential Regulation Authority.
Scotiabank Inverlat, S.A., Scotia Inverlat Casa de Bolsa, S.A. de C.V, Grupo Financiero Scotiabank Inverlat, and Scotia Inverlat Derivados, S.A. de C.V., are each authorized and regulated by the Mexican financial authorities.
Not all products and services are offered in all jurisdictions. Services described are available in jurisdictions where permitted by law.