ON DECK FOR FRIDAY, SEPTEMBER 5

KEY POINTS:
- Markets await US, Canadian jobs
- US nonfarm payrolls preview
- Canadian jobs preview
Markets are optimistically positioned going into US and Canadian jobs reports. Risk-on sentiment is buoying equities, not by much, but gains are being posting across N.A. futures and European cash markets. The dollar is broadly softer. Sovereign yields have a mild downward bias across the majors. Oil is off by about 1%. Bring it on.
NONFARM PAYROLLS PREVIEW
I’ll synthesize what I wrote in my weekly and expand on several points.
Forecasters broadly expect a weak payrolls reading. The consensus median and mean are both at 75k. Most estimates are clustered within about 50–100k. The whisper number is 75k which is down by about 10k in the past few days and is now the same as consensus. I’m at the bottom at 0k. I’m surprised there are no negatives and will explain in a moment.
In fact, consensus is dead boring. The 90% confidence interval around estimated changes in payrolls is +/-136k and keeps going up over time. Given high statistical noise, it’s interesting to note that the range of estimates is comparatively so tight.
As for the unemployment rate, most are split between an unchanged 4.2% and 4.3% and I’m at 4.1% which has nothing to do with payrolls; it’s derived from the household survey and I think it’s possible that the bigger decline in jobs than the labour force in July’s version of that survey could rebalance in the other direction. The caution is that the household survey’s 90% CI around estimated changes in employment blows nonfarm’s out of the water; it sits at about +/-600k, indicating that the household survey’s modest survey sample is very noisy.
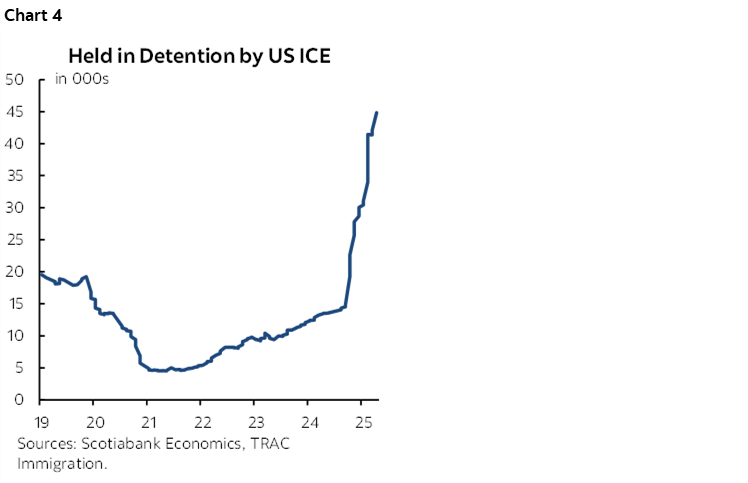
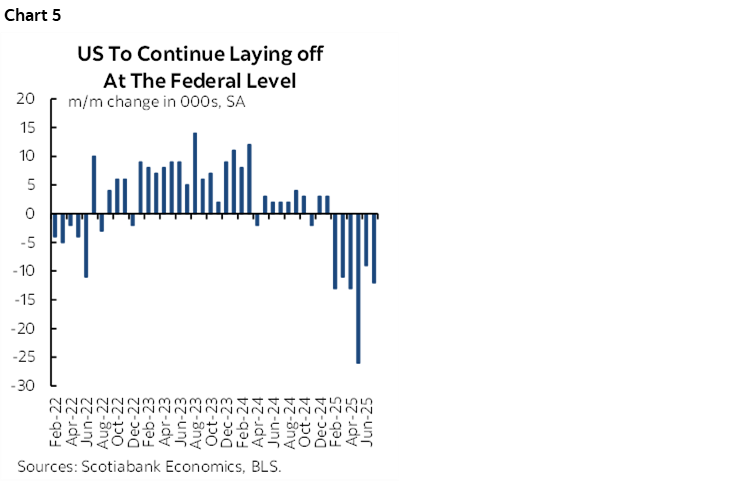
Why do I expect a weak payrolls number? If I apply last August’s seasonal adjustment factor for payrolls against the whole range of typical seasonally unadjusted changes in payrolls added to the July 2025 level of unadjusted payrolls and take the constructed seasonally adjusted difference, then the majority of scenarios that arise point to a negative payrolls reading. I only went flat. Why? Frankly, because nonfarm is quirky, I have low trust for BLS data these days partly as response rates plunge, it’s enough to be below consensus, and the good old risk-reward trade-off has its limits. Charts 1–3 are key.
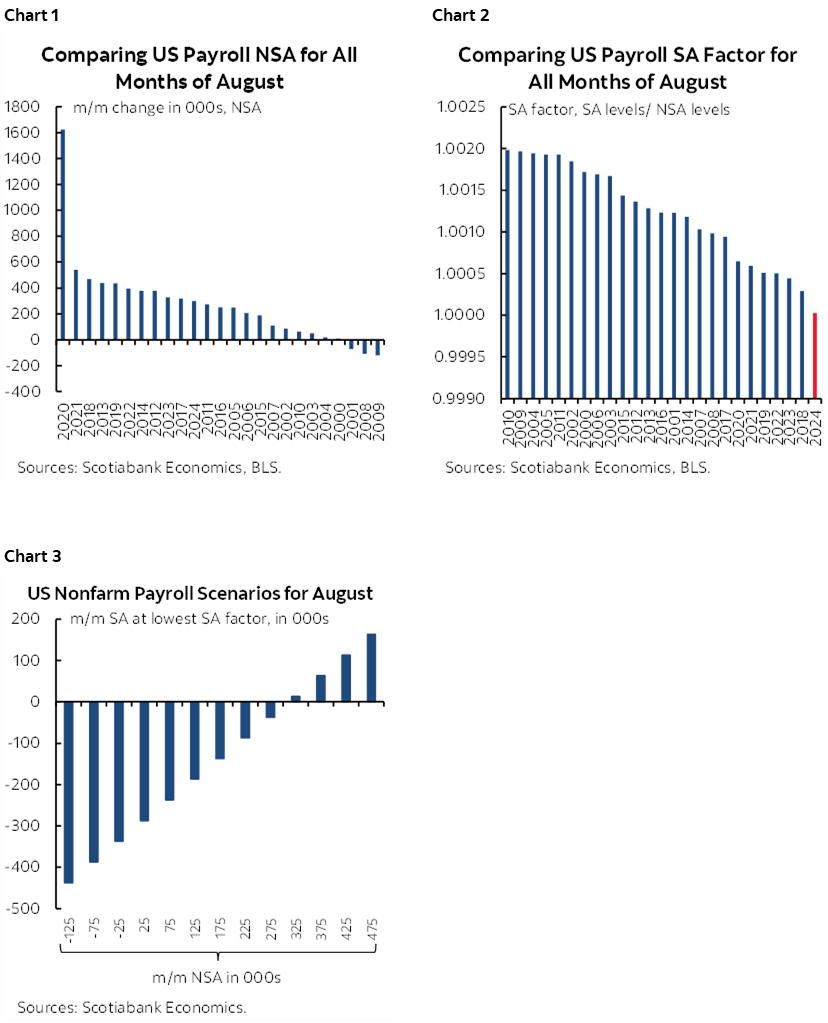
For instance, anything less than 310k m/m NSA for today’s payrolls (the August median is 252k since 2000) would reveal a seasonally adjusted payroll decline after applying last August’s SA factor. You would need a comparatively large NSA gain of about 400k or higher along with the same SA factor in order to get a meaningfully positive payrolls reading today. Since 2000, that’s only happened a handful of times with three of them occurring in the sharp August rebounds that occurred in the pandemic years of 2020, 2021, and 2022.
The risks? Well for one, the SA factor might not be the same as last August’s, but it could either be higher or lower; lower would extend the multi-year downward trend in August SA factors and worsen the payrolls outcome. For another, there might be revisions that could alter the base effect starting point in July and they are likely to be negative. And thirdly, there is obviously much uncertainty about the seasonally unadjusted change.
What we have to go by in terms of other labour market readings nevertheless points toward broad-based softening with the caveat that taken individually, none of them perform well at forecasting payrolls. Taken together, they are saying we’re losing momentum in the US job market.
- at inflection points—which this may be—a loss of momentum in job growth can be important information for the next reading. In statistical terms, we’re talking lagged dependents or AR1.
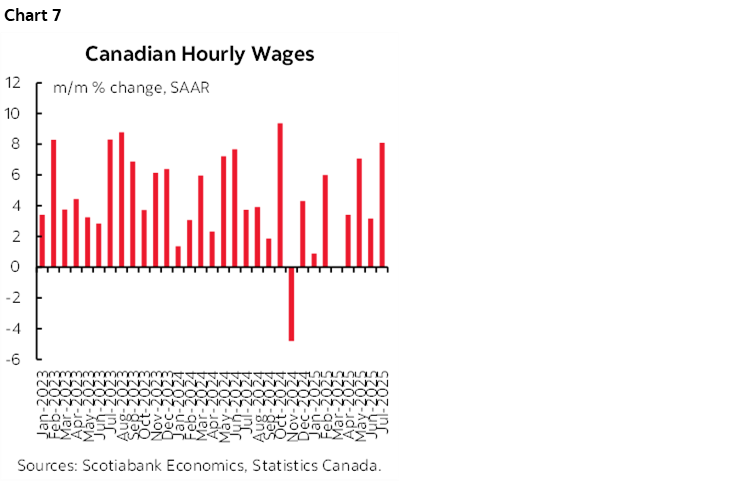
- it’s hard to tell the effects of the crackdown on immigration on both payrolls and the household survey. ICE detentions are skyrocketing (chart 4) but are still relatively small as a share of the workforce. The fear factor that has undocumented workers and other immigrants hiding may be the bigger downside. Worker shortages as immigration dries up are lowering the nonfarm payrolls monthly breakeven rate that would keep the unemployment rate stable.
- DOGE layoffs have been driving declines in federal government employment of 10–25k per month since February (chart 5). They are likely to reach a peak when layoff packages mature in September, meaning potentially hundreds of thousands drop off the next month. Then again, the allure of sticking to the last minute when the packages expire may decline the closer we get to the date as workers perhaps accept other jobs if available and leave the rest of their packages on the table. Alternatively, they may hang on and then seek jobless benefits.
- JOLTS job openings fell.
- The ISM readings for employment were weak. By contrast, S&P services PMI employment was solid but has a different sample.
- ADP was soft at 54k.
- Initial jobless claims were slightly higher between reference periods.
- Consumer confidence 'jobs plentiful' has been soft over the past three months.
- Challenger layoffs picked up a bit in August.
- NFIB hiring plans ticked slightly higher in August (15, 14 prior) and ‘hard to fill’ positions ticked slightly lower, indicating a touch more hiring activity among small businesses that are underrepresented on payrolls versus the household survey.
But nonfarm is its own beast. It uses an often-controversial birth-death model to impose judgement on the effects of firm openings and closings that can be volatile around potentially uncertain turning points. It has its own uniquely different seasonality issues. It counts multiple job holders instead of a single employed person with multiple jobs which is the approach in the household survey. It can be subject to large monthly revisions. It can be subject to large annual benchmarking revisions like the ones we’ll get next week on Tuesday. And nonfarm has a specific reference period.
All said and done, I’ve taken a risk with my payrolls estimate without knowing how consensus would emerge by submitting early to Reuters and Bloomberg. Anything less is boring. I hope the above helps to understand the call and risks a little better.
CANADIAN JOBS PREVIEW
I’ll synthesize what I wrote in my weekly and expand on several points.
Most forecasters are on the plus side for Canadian jobs this morning. Consensus ranges from -45k from some anonymous chicken at a US bank, to a gain of 35k which is mine. The median and mean estimates are both at about +5k which is 10–15k below a longer-run average gain. Most forecasters are clustered within about 0–15k. Like nonfarm, there just isn’t much variability in the range of views relative to the 95% confidence interval surrounding monthly changes in jobs that is +/-57k. It’s a noisy household survey; Canada’s payrolls survey lags two months behind unlike the US that releases both measures simultaneously.
As for the unemployment rate, the most popular estimate is for a one-tick rise to 7% from 6.9% the prior month but with three of us out of eleven in ‘berg’s consensus at an unchanged 6.9% and a couple are a little higher than 7%. After jobs fell by 41k and the labour force declined by 33k in July, I think there’s a decent shot at jobs outpacing the labour force this time.
Here’s the loose rationale:
- July’s base effect was distorted by the summer jobs market and offered a misleading indication of labour market weakness that could shake out in terms of base effect influences. The 41k loss was 83% driven by the 15–24 age category as summer jobs for students have been getting hammered by the massive surge of temporary residents over recent years. If they didn't get jobs in August, they won't be a usual drag in September upon returning to school. Further, the 41k loss followed a large 83k gain in June and so some payback wasn’t especially surprising.
- Further, seasonal adjustment factors are likely to overstate employment growth this August. Recent SA factors have been among the highest on record when comparing like months of August over time (chart 6). This would overstate job growth compared to prior months of August all else equal. Now, statcan will tell you they apply standard X12a Arima methods that are internationally recognized and have to let the output speak for itself. And I agree. They can’t impose their own judgement that may be arbitrary. But that’s where the street and markets need to question the data including roles like mine. Given that there is a recency bias to how SA factors are calculated which skews their calculation to the experiences of recent years, is it fair to assume that in 2025 we have the same wildly distorted seasonality in the pandemic and immediate post-pandemic period? A period marked by wild openings and closings, the arrival of vaccines, workforce changes with respect to technology and employer practices, and stimulus responses that gyrated all over the map. I don’t think so, but I don’t have a better idea on how to seasonally adjust other than to strongly question the data and offer alternative scenarios at different SA factors which we usually do.

- other labour market readings are scarcer in Canada than in the US. Job postings were slightly lower in August but have been little changed for a while. Surveys show most employers are looking through nearer-term uncertainty and hoarding labour at least until they have greater clarity on the outlook. Less than 10% of employers are indicating plans to downside over the next 12 months.
- The Air Canada strike hit in the LFS reference week in August. The direct effects wouldn’t be material since they were not technically out of work. The indirect effects may have disrupted hiring and firing plans for some sectors but I doubt this will be a meaningful influence.
- and pay attention to wages (chart 7). About 8% m/m SAAR growth in July may well mean revert lower in this report, but the trend has been warm over the months and the real wage gains that are being booked are disconnected from tumbling labour productivity which spells cost-induced inflation risk. We’ll also watch what happens to hours worked as input to GDP expectations for August.
Does it matter to the BoC? You bet it does. A meaningful decline in employment would be taken dovishly by the BoC. They could spin the GDP numbers in whatever way they choose, by either emphasizing the negative headline, or emphasizing strength in final domestic demand and how consumption soared while looking through high volatility in the trade and inventory figures with trade possibly on the mend given early tracking in Q3. We’ll also need to see the next inflation readings the week after next.

DISCLAIMER
This report has been prepared by Scotiabank Economics as a resource for the clients of Scotiabank. Opinions, estimates and projections contained herein are our own as of the date hereof and are subject to change without notice. The information and opinions contained herein have been compiled or arrived at from sources believed reliable but no representation or warranty, express or implied, is made as to their accuracy or completeness. Neither Scotiabank nor any of its officers, directors, partners, employees or affiliates accepts any liability whatsoever for any direct or consequential loss arising from any use of this report or its contents.
These reports are provided to you for informational purposes only. This report is not, and is not constructed as, an offer to sell or solicitation of any offer to buy any financial instrument, nor shall this report be construed as an opinion as to whether you should enter into any swap or trading strategy involving a swap or any other transaction. The information contained in this report is not intended to be, and does not constitute, a recommendation of a swap or trading strategy involving a swap within the meaning of U.S. Commodity Futures Trading Commission Regulation 23.434 and Appendix A thereto. This material is not intended to be individually tailored to your needs or characteristics and should not be viewed as a “call to action” or suggestion that you enter into a swap or trading strategy involving a swap or any other transaction. Scotiabank may engage in transactions in a manner inconsistent with the views discussed this report and may have positions, or be in the process of acquiring or disposing of positions, referred to in this report.
Scotiabank, its affiliates and any of their respective officers, directors and employees may from time to time take positions in currencies, act as managers, co-managers or underwriters of a public offering or act as principals or agents, deal in, own or act as market makers or advisors, brokers or commercial and/or investment bankers in relation to securities or related derivatives. As a result of these actions, Scotiabank may receive remuneration. All Scotiabank products and services are subject to the terms of applicable agreements and local regulations. Officers, directors and employees of Scotiabank and its affiliates may serve as directors of corporations.
Any securities discussed in this report may not be suitable for all investors. Scotiabank recommends that investors independently evaluate any issuer and security discussed in this report, and consult with any advisors they deem necessary prior to making any investment.
This report and all information, opinions and conclusions contained in it are protected by copyright. This information may not be reproduced without the prior express written consent of Scotiabank.
™ Trademark of The Bank of Nova Scotia. Used under license, where applicable.
Scotiabank, together with “Global Banking and Markets”, is a marketing name for the global corporate and investment banking and capital markets businesses of The Bank of Nova Scotia and certain of its affiliates in the countries where they operate, including; Scotiabank Europe plc; Scotiabank (Ireland) Designated Activity Company; Scotiabank Inverlat S.A., Institución de Banca Múltiple, Grupo Financiero Scotiabank Inverlat, Scotia Inverlat Casa de Bolsa, S.A. de C.V., Grupo Financiero Scotiabank Inverlat, Scotia Inverlat Derivados S.A. de C.V. – all members of the Scotiabank group and authorized users of the Scotiabank mark. The Bank of Nova Scotia is incorporated in Canada with limited liability and is authorised and regulated by the Office of the Superintendent of Financial Institutions Canada. The Bank of Nova Scotia is authorized by the UK Prudential Regulation Authority and is subject to regulation by the UK Financial Conduct Authority and limited regulation by the UK Prudential Regulation Authority. Details about the extent of The Bank of Nova Scotia's regulation by the UK Prudential Regulation Authority are available from us on request. Scotiabank Europe plc is authorized by the UK Prudential Regulation Authority and regulated by the UK Financial Conduct Authority and the UK Prudential Regulation Authority.
Scotiabank Inverlat, S.A., Scotia Inverlat Casa de Bolsa, S.A. de C.V, Grupo Financiero Scotiabank Inverlat, and Scotia Inverlat Derivados, S.A. de C.V., are each authorized and regulated by the Mexican financial authorities.
Not all products and services are offered in all jurisdictions. Services described are available in jurisdictions where permitted by law.