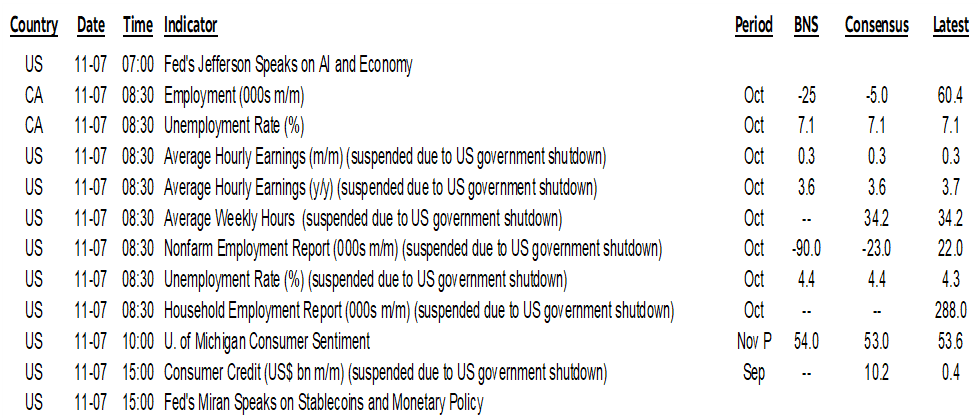
ON DECK FOR FRIDAY, NOVEMBER 7
KEY POINTS:
- Risk off sentiment continues
- Canadian jobs preview…
- ...and why it matters little to the BoC
- US UofM consumer sentiment and expected misery
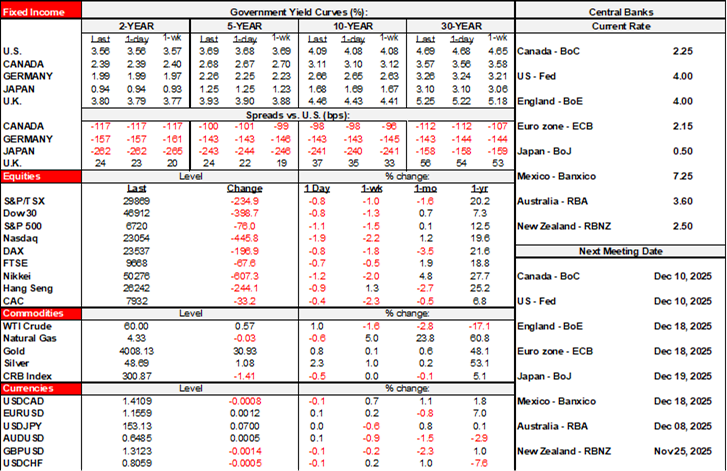
Markets continue to play defence this morning. Stocks are gently lower across global benchmarks. Sovereign bonds also have a very slight cheapening bias. Gold is up by about $30/oz. The dollar is mixed but most crosses are little changed.
Overnight developments were very light including data wise with just a better than expected jump in German exports during September to consider (+1.4% m/m, 0.5% consensus, prior -0.8% revised from -0.5%). Canadian jobs and UMich will close out the week. The absurdity of the US government shutdown appears to be nowhere close to ending which adds to the risk that we might not even get key data in time for the December 10th FOMC meeting.
CANADIAN JOBS PREVIEW
Canada updates job market conditions with the Labour Force Survey for October this morning (8:30amET). Here’s a slightly adjusted version of what I wrote in my weekly.
Today’s figures are one of two sets of readings before the next Bank of Canada decision on December 10th which dampens some of its significance to markets. So does the fact that the BoC just set a very high bar against returning with further easing in its latest communications.
After a surprise 60k jobs were created in September it’s reasonable to expect some payback in the context of present macroeconomic uncertainties. Much of that gain was narrowly focused on Alberta but had otherwise solid details even if the gain in manufacturing jobs was kind of sus.
My guess is a loss of about 25k. Plus or minus a bazillion. The 95% confidence band around whatever number the survey spits out is about +/-57k. The unemployment rate may be stable through offsetting effects on the pool of labour.
Consensus is scattered all over the map between -25k and +25k and absent any clustering with a median of -5k. Most see the unemployment rate unchanged at 7.1% or a tick higher.
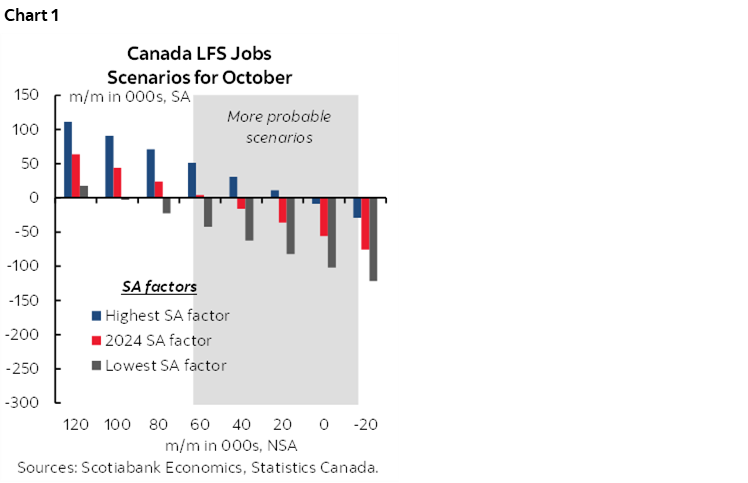
One added reason (other than coming off the prior large gain) is that October’s seasonal adjustment factor tends to shave unadjusted jobs and when combined with what is likely to be on the low end of seasonally unadjusted figures for like months of October the most probable outcome is a material drop in seasonally adjusted jobs. Chart 1 shows the scenarios for the change in jobs using different seasonally unadjusted changes and different SA factors. The odds favour a decline using this approach.
Further, surveys like the Ivey PMI and the CFIB’s small business hiring plans measure point toward downside risk to jobs over coming months.
If such expectations are anywhere close to reality, then they would restore a weak pattern for employment markets. Canada lost about 41k jobs in July, then another 66k in August before regaining 60k in September.
Hours worked may also be dented by the teacher’s strike in Alberta and Canada Post workers returning to work but at less than seasonally regular hours. That could add to tentative tracking of a -0.5% q/q SAAR drop in Q4 hours worked that is so far based solely on the way Q3 ended and handed off to Q4 from the Q3 average.
UMICH—MISERY IS ON THE RISE?
Watch UMich for both inflation expectations (chart 2) and expected unemployment over the next year (chart 3)—both of which have been high this year (10amET). In fact, expected unemployment is running at GFC levels and higher than the pandemic. I’ll take a deeper dive into the mixture of US labour market readings in my weekly in an effort to examine how much it is weakening.
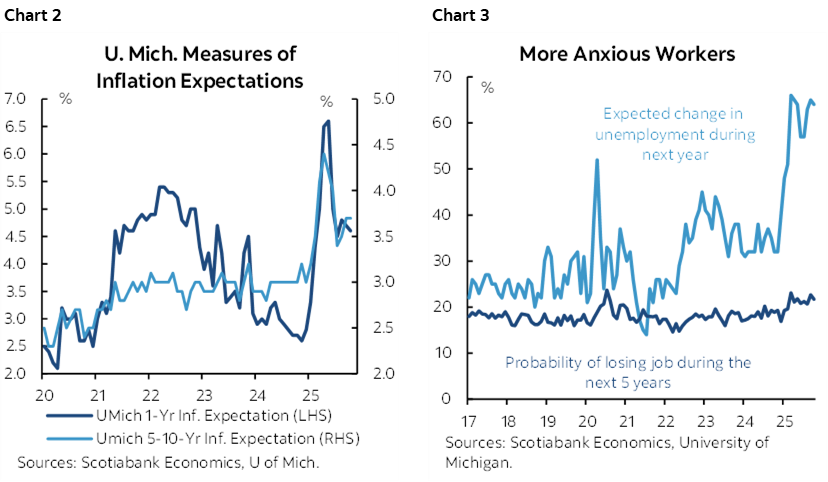
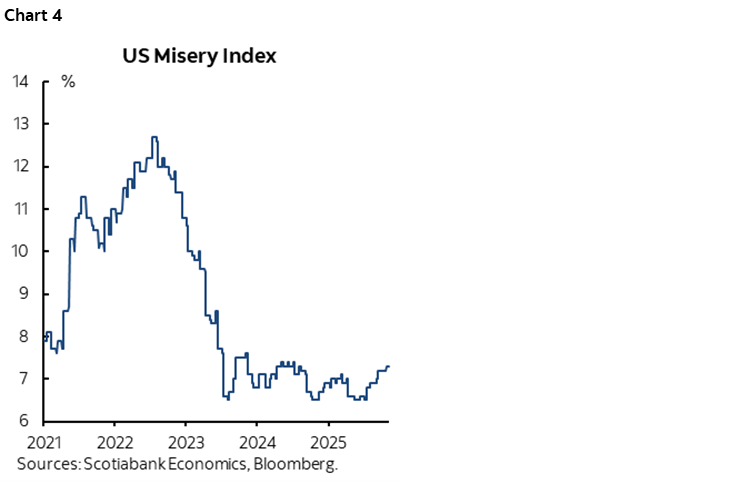
Always treat these measures of expectations with high suspicion, but if the fears of US consumers are proven correct, then the rising misery index—that combines the unemployment rate with actual inflation—could easily return to a multi-year high from what is presently the highest since about mid-2024 (chart 4).
DISCLAIMER
This report has been prepared by Scotiabank Economics as a resource for the clients of Scotiabank. Opinions, estimates and projections contained herein are our own as of the date hereof and are subject to change without notice. The information and opinions contained herein have been compiled or arrived at from sources believed reliable but no representation or warranty, express or implied, is made as to their accuracy or completeness. Neither Scotiabank nor any of its officers, directors, partners, employees or affiliates accepts any liability whatsoever for any direct or consequential loss arising from any use of this report or its contents.
These reports are provided to you for informational purposes only. This report is not, and is not constructed as, an offer to sell or solicitation of any offer to buy any financial instrument, nor shall this report be construed as an opinion as to whether you should enter into any swap or trading strategy involving a swap or any other transaction. The information contained in this report is not intended to be, and does not constitute, a recommendation of a swap or trading strategy involving a swap within the meaning of U.S. Commodity Futures Trading Commission Regulation 23.434 and Appendix A thereto. This material is not intended to be individually tailored to your needs or characteristics and should not be viewed as a “call to action” or suggestion that you enter into a swap or trading strategy involving a swap or any other transaction. Scotiabank may engage in transactions in a manner inconsistent with the views discussed this report and may have positions, or be in the process of acquiring or disposing of positions, referred to in this report.
Scotiabank, its affiliates and any of their respective officers, directors and employees may from time to time take positions in currencies, act as managers, co-managers or underwriters of a public offering or act as principals or agents, deal in, own or act as market makers or advisors, brokers or commercial and/or investment bankers in relation to securities or related derivatives. As a result of these actions, Scotiabank may receive remuneration. All Scotiabank products and services are subject to the terms of applicable agreements and local regulations. Officers, directors and employees of Scotiabank and its affiliates may serve as directors of corporations.
Any securities discussed in this report may not be suitable for all investors. Scotiabank recommends that investors independently evaluate any issuer and security discussed in this report, and consult with any advisors they deem necessary prior to making any investment.
This report and all information, opinions and conclusions contained in it are protected by copyright. This information may not be reproduced without the prior express written consent of Scotiabank.
™ Trademark of The Bank of Nova Scotia. Used under license, where applicable.
Scotiabank, together with “Global Banking and Markets”, is a marketing name for the global corporate and investment banking and capital markets businesses of The Bank of Nova Scotia and certain of its affiliates in the countries where they operate, including; Scotiabank Europe plc; Scotiabank (Ireland) Designated Activity Company; Scotiabank Inverlat S.A., Institución de Banca Múltiple, Grupo Financiero Scotiabank Inverlat, Scotia Inverlat Casa de Bolsa, S.A. de C.V., Grupo Financiero Scotiabank Inverlat, Scotia Inverlat Derivados S.A. de C.V. – all members of the Scotiabank group and authorized users of the Scotiabank mark. The Bank of Nova Scotia is incorporated in Canada with limited liability and is authorised and regulated by the Office of the Superintendent of Financial Institutions Canada. The Bank of Nova Scotia is authorized by the UK Prudential Regulation Authority and is subject to regulation by the UK Financial Conduct Authority and limited regulation by the UK Prudential Regulation Authority. Details about the extent of The Bank of Nova Scotia's regulation by the UK Prudential Regulation Authority are available from us on request. Scotiabank Europe plc is authorized by the UK Prudential Regulation Authority and regulated by the UK Financial Conduct Authority and the UK Prudential Regulation Authority.
Scotiabank Inverlat, S.A., Scotia Inverlat Casa de Bolsa, S.A. de C.V, Grupo Financiero Scotiabank Inverlat, and Scotia Inverlat Derivados, S.A. de C.V., are each authorized and regulated by the Mexican financial authorities.
Not all products and services are offered in all jurisdictions. Services described are available in jurisdictions where permitted by law.