ON DECK FOR FRIDAY, NOVEMBER 28
KEY POINTS:
- CAD vulnerable to GDP
- Canadian GDP likely to extend softness through Q3/Q4
- US markets to shut early today with nothing on tap
- Data reinforces a possible BoJ hike next month
- Korean factories are reeling
- European inflation & GDP data taken in stride
- Global Week Ahead—Newly Invigorated (reminder here)
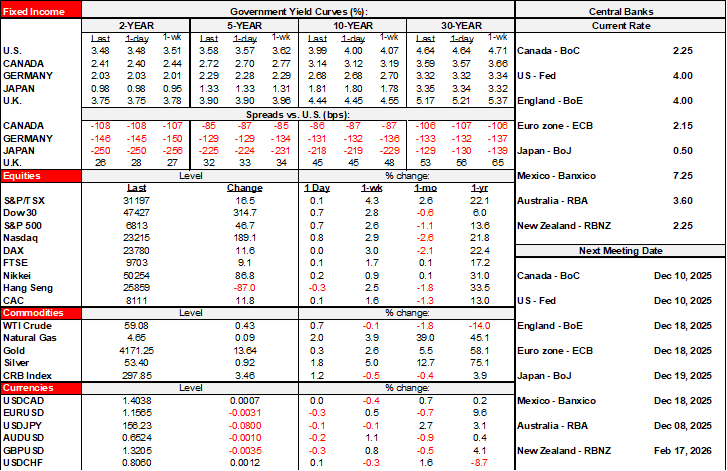
The week is ending with a dump of data and snow if you live in the northeast US or central Canada. Most of the data had little effect but reinforced a decent chance at a BoJ hike in December. Canada follows up with a dump of GDP data. US market participants return to an empty calendar for roughly half a day ahead of early closes in stocks (2pmET) and bonds (1pmET), for those who didn’t take the day off. See my Global Week Ahead including the focus on CAD stablecoin (here).
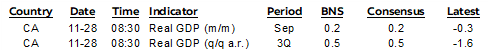
Canadian GDP—Scorekeeping Amid Prolonged Pause
Canada will report GDP for Q3, plus detailed figures for the month of September, and the preliminary estimate for October sans details (8:30amET). Expect soft numbers. That may spark market volatility, but the BoC is focused upon complex drivers of inflation that trade off spare capacity and rising cost pressures with a clear signal they are on an extended hold.
Q3 growth is likely to land around ½% q/q SAAR on an expenditure-accounts basis that fully accounts for net trade and inventory effects. That’s basically stall speed (chart 1). Our ability to estimate Q3 growth is limited by virtue of the fact that we’re still missing trade figures from September due to the US government shutdown and its effects on Statistics Canada. Inventory figures are also incomplete. Therefore, one should treat the estimates with wider brackets than normal and with higher revision risk than normal once Statcan more fully assesses the trade picture.
Still, anything around that reading wouldn’t surprise the BoC. It forecast 0.5% Q3 growth in the October MPR.
As for the monthlies, Statcan had previously guided that September would be tracking at about 0.1% m/m SA. I’ve bumped that up a bit to 0.2% given data since that guidance.
As for October, it wasn’t just the Blue Jays who were throwing strikes. Hours worked fell in each of September and October by 0.2% m/m SA partly because of the Canada Post strike from about late-September to mid-October, and the Alberta teachers strike. Both of those strikes carried direct and indirect effects. It will be important to assess growth independent of estimated impacts. Other readings appeared weak for the month on balance including preliminary estimates. That could leave us tracking another very soft quarter in Q4 on a highly tentative basis.
Overnight Sweep
Most of the overnight data was largely ignored by markets with few exceptions like South Korea.
The won tumbled overnight because industrial production came in much weaker than expected (-4% m/m SA, +0.3% consensus). Factory output also fell by 1.1% m/m SA in September. The level of output is at the lowest since July 2024.
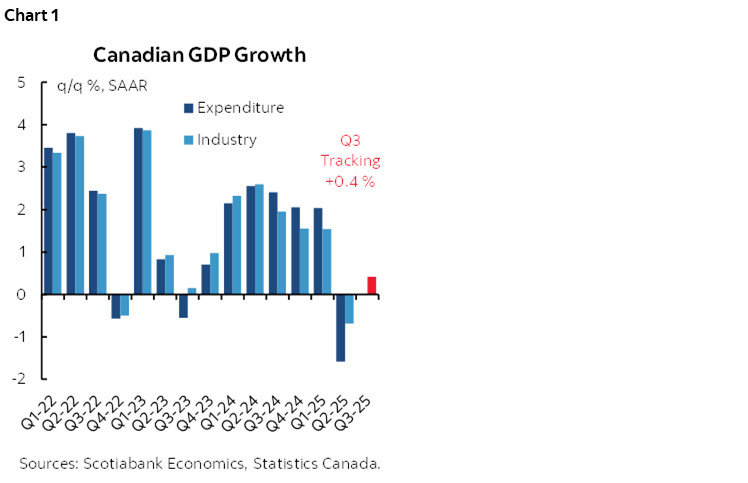
Japanese markets took updates in stride overnight largely because the pricing for the December BoJ meeting had been ratcheted higher by about 10bps starting on Tuesday to 14bps of a quarter point hike at present when BoJ speak sounded more open to a near-term hike. BoJ Board member Kazuyuki Masu had indicated that a decision to hike was nearing.
The Japanese data generally supported such a stance. Tokyo core CPI ex-food and energy in November remained firm at 2.4% m/m SAAR after it surged by 8.7% in October (chart 2). The year-over-year rate was unchanged at 2.8% y/y as expected. Retail sales grew by 1.6% m/m SA (consensus 0.8%) and industrial production also beat estimates (1.4% m/m SA, -0.6% consensus). So did housing starts (+3.2% y/y, -4.9% consensus).
EGBs showed little interest in CPI updates ahead of the Eurozone add-up next week. Markets get the narrative that the ECB is on hold for an extended period. Here are the readings:
- France’s CPI was -0.2% m/m (0% consensus)
- Italian CPI was also weaker than expected (-0.2% m/m, -0.1% consensus)
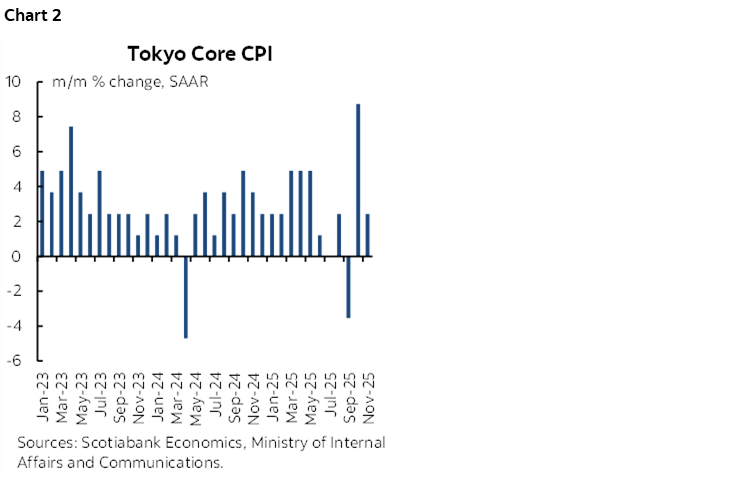
- Spain’s CPI was firmer than expected (0%, -0.2% consensus) but still soft compared to other Septembers given it’s seasonally unadjusted data (chart 3).
- German states were soft in line with expectations for the national add-up that gets released at 8amET. Each of the states registered declines of -0.2% or -0.3% m/m NSA.
German retail sales volumes fell -0.3% m/m (+0.2% consensus).
Swedish GDP grew more than expected due to upward revisions. GDP was up 1.1% q/q SA in Q3 which matched expectations but Q2 was revised up (0.8% from 0.5%). If local markets cared, then it came with a lag as Swedish 2s sold off by about 2bps to underperform elsewhere in Europe.
The Swiss economy remains weak. GDP fell -0.5% q/q SA in Q3 (-0.4% consensus) and the prior quarter was revised up by only a tick to 0.2% q/q.
India’s economy beat expectations with GDP up 8.2% y/y in Q3 (7.4% consensus).
DISCLAIMER
This report has been prepared by Scotiabank Economics as a resource for the clients of Scotiabank. Opinions, estimates and projections contained herein are our own as of the date hereof and are subject to change without notice. The information and opinions contained herein have been compiled or arrived at from sources believed reliable but no representation or warranty, express or implied, is made as to their accuracy or completeness. Neither Scotiabank nor any of its officers, directors, partners, employees or affiliates accepts any liability whatsoever for any direct or consequential loss arising from any use of this report or its contents.
These reports are provided to you for informational purposes only. This report is not, and is not constructed as, an offer to sell or solicitation of any offer to buy any financial instrument, nor shall this report be construed as an opinion as to whether you should enter into any swap or trading strategy involving a swap or any other transaction. The information contained in this report is not intended to be, and does not constitute, a recommendation of a swap or trading strategy involving a swap within the meaning of U.S. Commodity Futures Trading Commission Regulation 23.434 and Appendix A thereto. This material is not intended to be individually tailored to your needs or characteristics and should not be viewed as a “call to action” or suggestion that you enter into a swap or trading strategy involving a swap or any other transaction. Scotiabank may engage in transactions in a manner inconsistent with the views discussed this report and may have positions, or be in the process of acquiring or disposing of positions, referred to in this report.
Scotiabank, its affiliates and any of their respective officers, directors and employees may from time to time take positions in currencies, act as managers, co-managers or underwriters of a public offering or act as principals or agents, deal in, own or act as market makers or advisors, brokers or commercial and/or investment bankers in relation to securities or related derivatives. As a result of these actions, Scotiabank may receive remuneration. All Scotiabank products and services are subject to the terms of applicable agreements and local regulations. Officers, directors and employees of Scotiabank and its affiliates may serve as directors of corporations.
Any securities discussed in this report may not be suitable for all investors. Scotiabank recommends that investors independently evaluate any issuer and security discussed in this report, and consult with any advisors they deem necessary prior to making any investment.
This report and all information, opinions and conclusions contained in it are protected by copyright. This information may not be reproduced without the prior express written consent of Scotiabank.
™ Trademark of The Bank of Nova Scotia. Used under license, where applicable.
Scotiabank, together with “Global Banking and Markets”, is a marketing name for the global corporate and investment banking and capital markets businesses of The Bank of Nova Scotia and certain of its affiliates in the countries where they operate, including; Scotiabank Europe plc; Scotiabank (Ireland) Designated Activity Company; Scotiabank Inverlat S.A., Institución de Banca Múltiple, Grupo Financiero Scotiabank Inverlat, Scotia Inverlat Casa de Bolsa, S.A. de C.V., Grupo Financiero Scotiabank Inverlat, Scotia Inverlat Derivados S.A. de C.V. – all members of the Scotiabank group and authorized users of the Scotiabank mark. The Bank of Nova Scotia is incorporated in Canada with limited liability and is authorised and regulated by the Office of the Superintendent of Financial Institutions Canada. The Bank of Nova Scotia is authorized by the UK Prudential Regulation Authority and is subject to regulation by the UK Financial Conduct Authority and limited regulation by the UK Prudential Regulation Authority. Details about the extent of The Bank of Nova Scotia's regulation by the UK Prudential Regulation Authority are available from us on request. Scotiabank Europe plc is authorized by the UK Prudential Regulation Authority and regulated by the UK Financial Conduct Authority and the UK Prudential Regulation Authority.
Scotiabank Inverlat, S.A., Scotia Inverlat Casa de Bolsa, S.A. de C.V, Grupo Financiero Scotiabank Inverlat, and Scotia Inverlat Derivados, S.A. de C.V., are each authorized and regulated by the Mexican financial authorities.
Not all products and services are offered in all jurisdictions. Services described are available in jurisdictions where permitted by law.