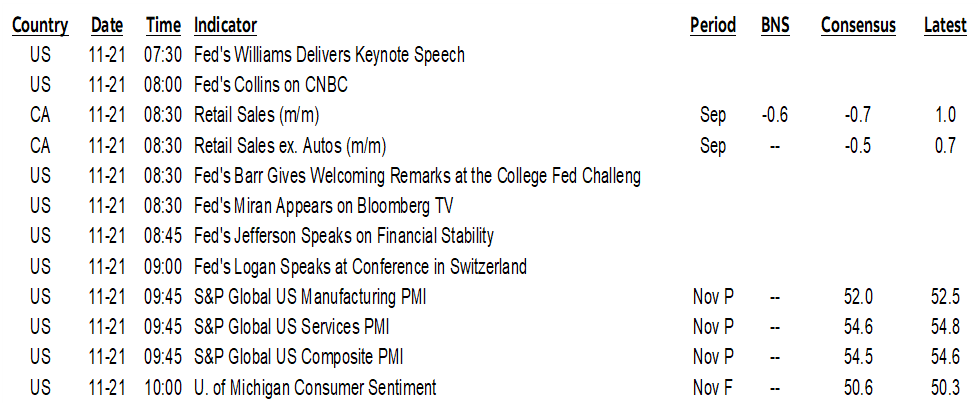
ON DECK FOR FRIDAY, NOVEMBER 21
KEY POINTS:
- Markets continue to play defence after nonfarm fallout
- The one thing that everyone should be asking the BLS about nonfarm
- Global PMIs signal weaker growth in Japan, Australia…
- …cooler growth in the UK and India…
- …and no change in the Eurozone with the US on tap
- UK consumers retreated on eve of Starmer’s budget
- Don’t look for a Blue Jays effect in today’s Canadian retail numbers
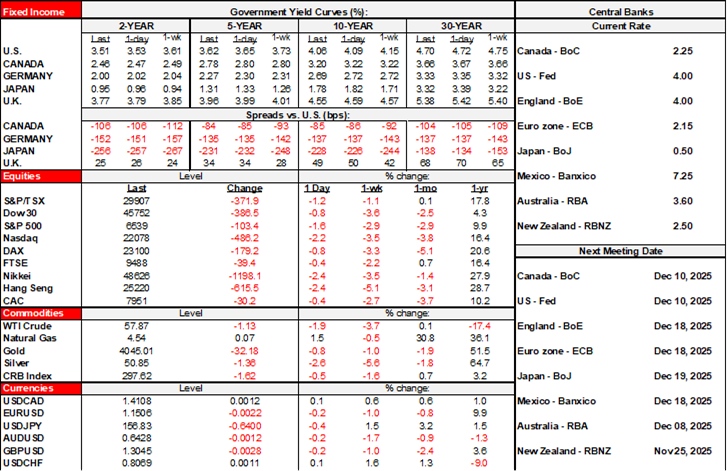
Sovereign yields continue to move moderately lower this morning. Equities continue to be soft. Fallout from yesterday’s US job readings continues as the nonfarm details were soft, the SA factors appeared cooked (see below), the unemployment rate increased and continuing claims increased which signals further increases in the unemployment rate. Yet Fed-speak was mixed, although it’s still important to weight the perspectives by voting status. Overnight releases didn’t help via a mixed picture for global PMIs and soft UK data ahead of US PMIs and Canadian retail sales.
NONFARM FALLOUT—IT’S ALL IN THE CHOSEN SEASONAL ADJUSTMENTS
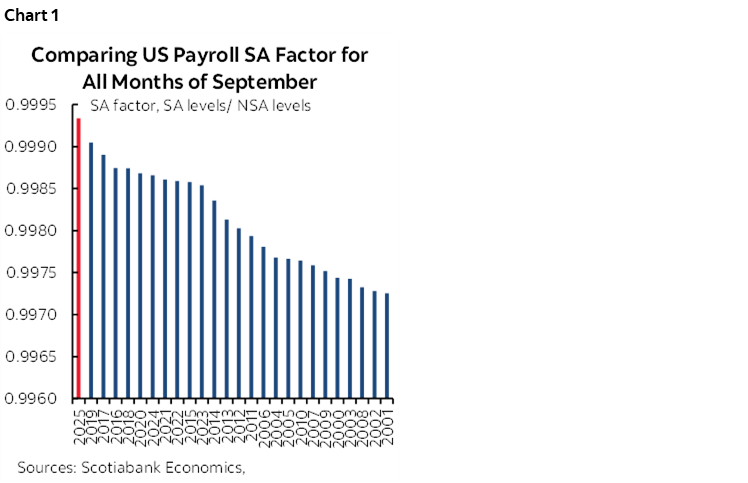
I think the BLS has to account for why it went with a record high seasonal adjustment factor in yesterday’s nonfarm payrolls report. The SA factor was off the charts compared to any prior month of September on record (chart 1). This distorted payrolls as argued.
There is never any explanation other than hiding behind an opaque statistical estimation. Yet it was the single reason why payrolls remained positive despite one of the weakest seasonally unadjusted payroll numbers on record for like months of September. Had the BLS opted for last year’s SA factor or continued to drift lower given greater distance from the pandemic given the recency bias to how the SA factors are calculated, then payrolls would have declined (chart 2).
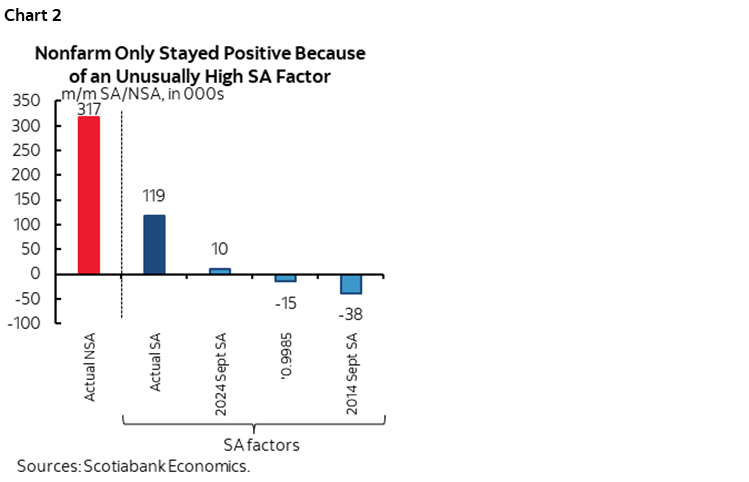
The chart shows how seasonally adjusted payrolls changed as reported, how seasonally unadjusted payrolls changed as reported, and then what seasonally adjusted payrolls would have been at SA factors less than record highs such as using the 2024 September SA factor or continuing the downward drift in SA factors as distance from the distorted pandemic era yields less influence upon the recency bias to how they are calculated.
The number that was revealed was sure to curry favour with Trump. Sure to avoid his criticism had it shown job losses. Perhaps it lessened the risk that another obviously unqualified candidate like Antoni would be nominated to head the BLS, or perhaps it raised the odds that an internal candidate would be chosen.
In short, my trust for this data is pretty low.
PMIs REVEAL A MIXED PICTURE
The monthly parade of purchasing managers’ indices marched on overnight with the US readings still on tap. Quicker growth was signalled in Japan and Australia, cooler growth was indicated by readings from the UK and India, and the Eurozone was unchanged and still signalling moderate growth. Composite PMI trends are shown in chart 3.
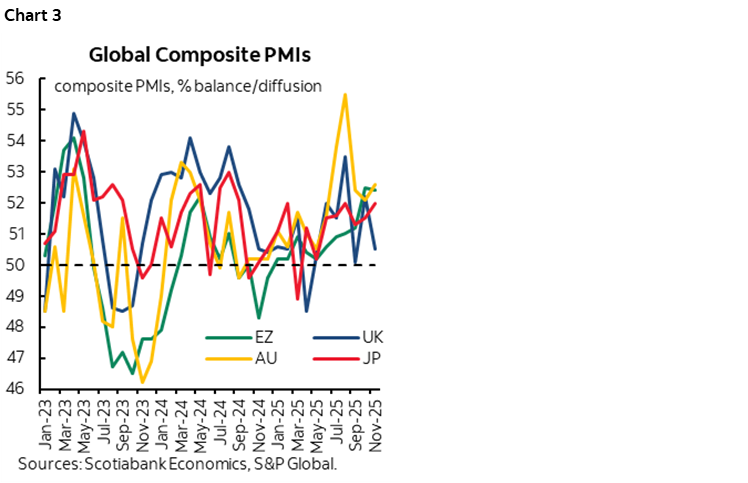
- Eurozone: The composite PMI was flat (52.4, 52.5 prior) given little change in services (53.1, 53.0 prior) and manufacturing (49.7, 50.0 prior). Germany’s composite PMI decelerated mainly due to services but also manufacturing while France accelerated because of services.
- UK: The composite PMI fell significantly to 50.5 (52.2 prior) which signals a stalling economy. The decline was entirely due to services (50.5 from 52.3) as manufacturing accelerated but to still no real growth (50.2, 49.7 prior).
- Japan: The composite PMI moved up half a point to 52.0 entirely due to a 0.6 gain in manufacturing to 48.8 which signalled a slower pace of contraction while services remained at 53.1 which continues to signal moderate growth.
- India: The composite PMI slipped half a point to 59.9, signalling solid ongoing growth. The decline was entirely due to manufacturing (57.4 from 59.2) that nevertheless continues to post solid growth while services accelerated (59.5, 58.9 prior).
- Australia: Quicker growth was signalled by a 52.6 composite PMI (52.1 prior) as manufacturing accelerated (51.6, 49.7 prior) and services were little changed (52.7, 52.5 prior).
- US: The November PMIs are due out this morning (9:45amET). They’ve been signalling moderate overall growth that is led by services.
UK DATA SOURS BEFORE BUDGET
Macro data soured on the eve of the Starmer administration’s second budget that is coming next week. The result contributed to lower yields across the curve. UK retail sales fell sharply in October. Total sales volumes were down by 1.1% m/m (-0.2% consensus) as the prior month was revised up a touch (0.7% from 0.5%). Ex-fuel sales volumes were down 1% m/m, or double consensus, with minor revisions.
CANADA REFRESHES RETAIL SALES FOR SEPTEMBER–OCTOBER
Retail sales are expected to dip when September’s final estimate arrives, but key will be October’s fresh guidance. Statcan had advised a month ago that September’s reading would decline with consensus estimates around -0.7% m/m SA, but that guidance can be materially revised. October’s reading will be the first guidance and will give us a better feel for how the consumer is performing in Q3 into Q4. Current pre-data tracking is shown in chart 4 up to Q3.
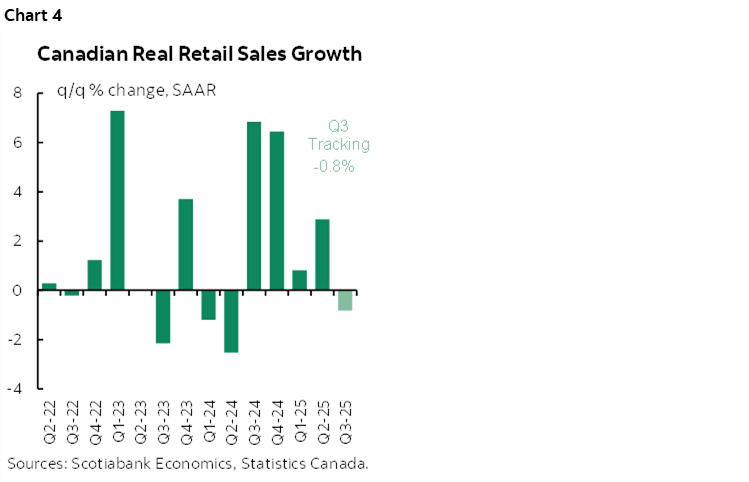
A big caveat is always that Canadian retail sales are a fraction of consumer spending. They include no services unlike, say, the US that at least includes restaurants and bars. Ergo, don’t look to retail sales to show much of any impact of the “world” series for one thing.
DISCLAIMER
This report has been prepared by Scotiabank Economics as a resource for the clients of Scotiabank. Opinions, estimates and projections contained herein are our own as of the date hereof and are subject to change without notice. The information and opinions contained herein have been compiled or arrived at from sources believed reliable but no representation or warranty, express or implied, is made as to their accuracy or completeness. Neither Scotiabank nor any of its officers, directors, partners, employees or affiliates accepts any liability whatsoever for any direct or consequential loss arising from any use of this report or its contents.
These reports are provided to you for informational purposes only. This report is not, and is not constructed as, an offer to sell or solicitation of any offer to buy any financial instrument, nor shall this report be construed as an opinion as to whether you should enter into any swap or trading strategy involving a swap or any other transaction. The information contained in this report is not intended to be, and does not constitute, a recommendation of a swap or trading strategy involving a swap within the meaning of U.S. Commodity Futures Trading Commission Regulation 23.434 and Appendix A thereto. This material is not intended to be individually tailored to your needs or characteristics and should not be viewed as a “call to action” or suggestion that you enter into a swap or trading strategy involving a swap or any other transaction. Scotiabank may engage in transactions in a manner inconsistent with the views discussed this report and may have positions, or be in the process of acquiring or disposing of positions, referred to in this report.
Scotiabank, its affiliates and any of their respective officers, directors and employees may from time to time take positions in currencies, act as managers, co-managers or underwriters of a public offering or act as principals or agents, deal in, own or act as market makers or advisors, brokers or commercial and/or investment bankers in relation to securities or related derivatives. As a result of these actions, Scotiabank may receive remuneration. All Scotiabank products and services are subject to the terms of applicable agreements and local regulations. Officers, directors and employees of Scotiabank and its affiliates may serve as directors of corporations.
Any securities discussed in this report may not be suitable for all investors. Scotiabank recommends that investors independently evaluate any issuer and security discussed in this report, and consult with any advisors they deem necessary prior to making any investment.
This report and all information, opinions and conclusions contained in it are protected by copyright. This information may not be reproduced without the prior express written consent of Scotiabank.
™ Trademark of The Bank of Nova Scotia. Used under license, where applicable.
Scotiabank, together with “Global Banking and Markets”, is a marketing name for the global corporate and investment banking and capital markets businesses of The Bank of Nova Scotia and certain of its affiliates in the countries where they operate, including; Scotiabank Europe plc; Scotiabank (Ireland) Designated Activity Company; Scotiabank Inverlat S.A., Institución de Banca Múltiple, Grupo Financiero Scotiabank Inverlat, Scotia Inverlat Casa de Bolsa, S.A. de C.V., Grupo Financiero Scotiabank Inverlat, Scotia Inverlat Derivados S.A. de C.V. – all members of the Scotiabank group and authorized users of the Scotiabank mark. The Bank of Nova Scotia is incorporated in Canada with limited liability and is authorised and regulated by the Office of the Superintendent of Financial Institutions Canada. The Bank of Nova Scotia is authorized by the UK Prudential Regulation Authority and is subject to regulation by the UK Financial Conduct Authority and limited regulation by the UK Prudential Regulation Authority. Details about the extent of The Bank of Nova Scotia's regulation by the UK Prudential Regulation Authority are available from us on request. Scotiabank Europe plc is authorized by the UK Prudential Regulation Authority and regulated by the UK Financial Conduct Authority and the UK Prudential Regulation Authority.
Scotiabank Inverlat, S.A., Scotia Inverlat Casa de Bolsa, S.A. de C.V, Grupo Financiero Scotiabank Inverlat, and Scotia Inverlat Derivados, S.A. de C.V., are each authorized and regulated by the Mexican financial authorities.
Not all products and services are offered in all jurisdictions. Services described are available in jurisdictions where permitted by law.