ON DECK FOR FRIDAY, MAY 16
KEY POINTS:
- Equities up on further signs that Trump is backpedaling
- Trump indicates lower across-the-board tariffs are coming
- Kiwi dollar up on inflation report
- Japan’s economy contracted
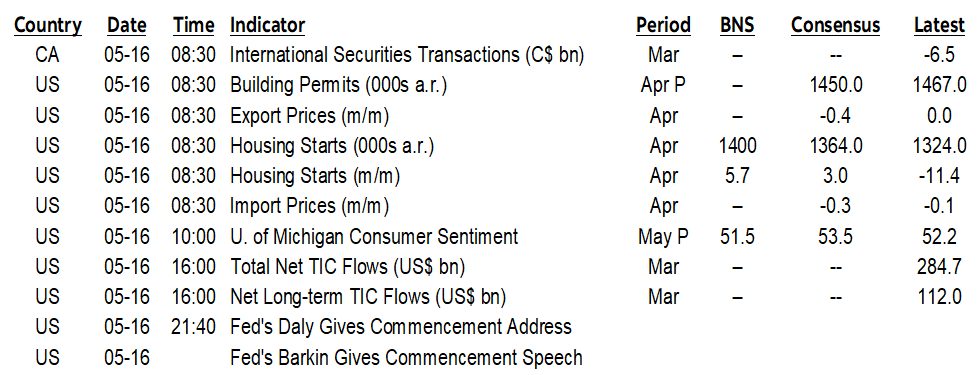
- US UofM highlights light N.A. developments
It’s a Happy Friday for equities. They’re modestly up across the board. A catalyst is an additional sign that Trump is backing down on tariffs but trying to make it sound like he’s not. Sovereign bond yields are down a few basis points across maturities and countries except Canada where yields are flat. Oil is consolidating yesterday’s sell off. The dollar is mixed and little changed on balance.
FURTHER SIGNS TRUMP IS BACKING DOWN
Trump said in the 3–4amET window when US equity futures began to post further gains that “it’s not possible to meet the number of people that want to see us” and there are “150 countries that want to make a deal.” It used to be 200 countries btw, 5 more than a liberal definition of the number of countries that exist. Because of negotiating capacity limits, Trump said the US administration will instead set tariff rates for trading partners “over the next two to three weeks” and that Bessent and Lutnick will be sending letters “telling people what they’ll be paying to do business in the United States.”
Nonsense. Trump went way too far and gave himself no out, so now he’s forced to unilaterally back down as the consequences to the US economy become clearer and other partners like China, Europe and Canada dig in.
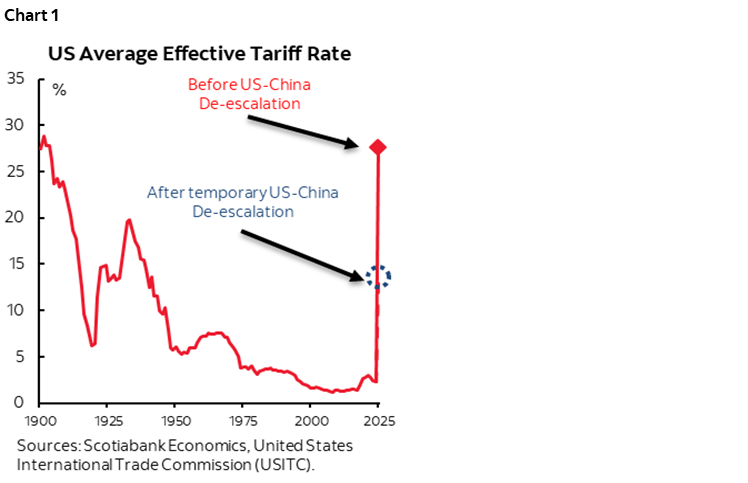
We need to see the tariff rates as they unfold, and the responses. If the temporary 90-day fiancé deal with China is any indication, then tariffs are likely to be much lower, but still damaging and still bad economic policy. Chart 1 shows where the US effective average tariff rate on its own goods imports presently stands. From a peak of about 27%, John McNally in our group calculates that it is now 13.6% on all goods after the temporary China deal. As a share of total goods and services imports, the effective average tariff rate is now 11.2%. These rates could drop again if Trump’s comments this morning result in further cuts. They are likely to continue to be too high and damaging, but less crippling to the outlook—as long as Trump’s erratic ways don’t escalate all over again.
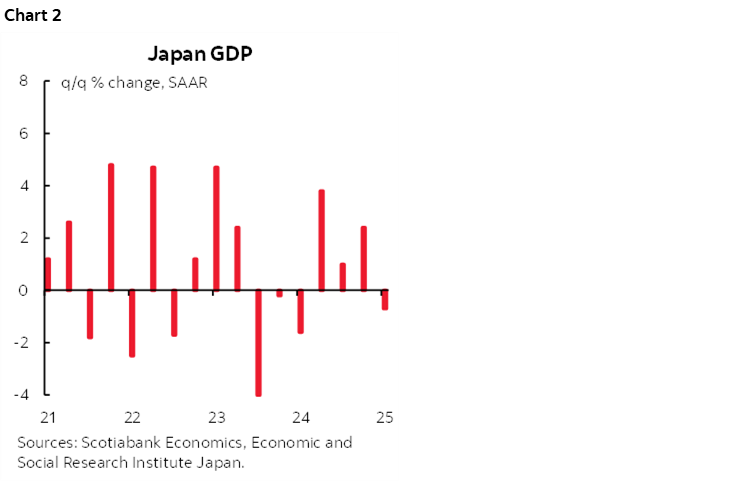
JAPAN’S ECONOMY CONTRACTS
Japan’s economy slipped into contraction by more than expected (-0.7% q/q SAAR, -0.3% consensus). Part of that was due to an upward revision to Q4 (2.4% from 2.2%). Inventories added 0.3 ppts, consumption was a flat contributor again, and business spending added 1.4 ppts while net exports shaved 0.8 ppts off GDP. It’s a minor dip after three decent quarters (chart 2), but greater risk lies ahead for the trading nation.
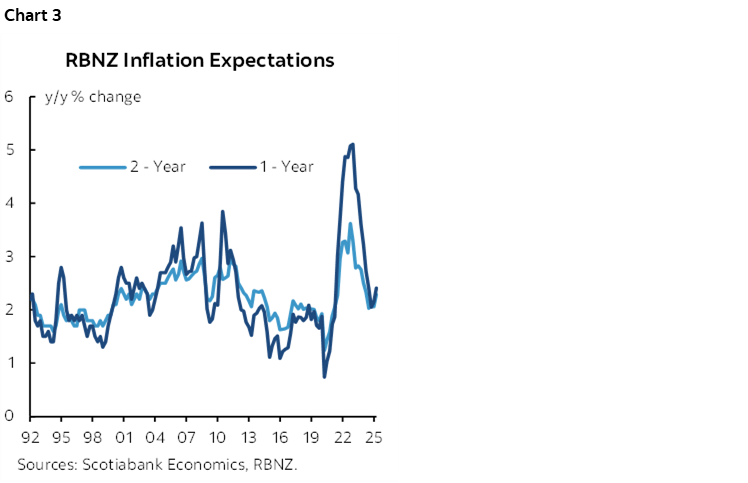
KIWI DOLLAR UP ON INFLATION REPORT
NZ 2-year inflation expectations edged up to 2.3% from 2.06% and drove the kiwi dollar to be the strongest in class against the USD this morning. The up-tick is relatively minor compared to the steep declines that preceded it (chart 3).
LIGHT N.A. DEVELOPMENTS ON TAP
How provies may respond to Ontario’s budget is the only semi-pertinent matter in Canada.
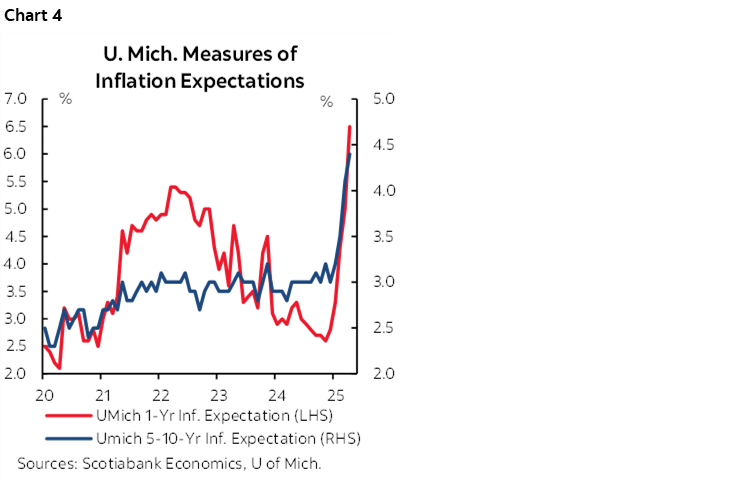
US markets will follow UofM sentiment (10amET) and its components such as inflation expectations (chart 4). Housing starts are expected to post a solid gain for April (8:30amET) and April’s import prices are also due at the same time.
DISCLAIMER
This report has been prepared by Scotiabank Economics as a resource for the clients of Scotiabank. Opinions, estimates and projections contained herein are our own as of the date hereof and are subject to change without notice. The information and opinions contained herein have been compiled or arrived at from sources believed reliable but no representation or warranty, express or implied, is made as to their accuracy or completeness. Neither Scotiabank nor any of its officers, directors, partners, employees or affiliates accepts any liability whatsoever for any direct or consequential loss arising from any use of this report or its contents.
These reports are provided to you for informational purposes only. This report is not, and is not constructed as, an offer to sell or solicitation of any offer to buy any financial instrument, nor shall this report be construed as an opinion as to whether you should enter into any swap or trading strategy involving a swap or any other transaction. The information contained in this report is not intended to be, and does not constitute, a recommendation of a swap or trading strategy involving a swap within the meaning of U.S. Commodity Futures Trading Commission Regulation 23.434 and Appendix A thereto. This material is not intended to be individually tailored to your needs or characteristics and should not be viewed as a “call to action” or suggestion that you enter into a swap or trading strategy involving a swap or any other transaction. Scotiabank may engage in transactions in a manner inconsistent with the views discussed this report and may have positions, or be in the process of acquiring or disposing of positions, referred to in this report.
Scotiabank, its affiliates and any of their respective officers, directors and employees may from time to time take positions in currencies, act as managers, co-managers or underwriters of a public offering or act as principals or agents, deal in, own or act as market makers or advisors, brokers or commercial and/or investment bankers in relation to securities or related derivatives. As a result of these actions, Scotiabank may receive remuneration. All Scotiabank products and services are subject to the terms of applicable agreements and local regulations. Officers, directors and employees of Scotiabank and its affiliates may serve as directors of corporations.
Any securities discussed in this report may not be suitable for all investors. Scotiabank recommends that investors independently evaluate any issuer and security discussed in this report, and consult with any advisors they deem necessary prior to making any investment.
This report and all information, opinions and conclusions contained in it are protected by copyright. This information may not be reproduced without the prior express written consent of Scotiabank.
™ Trademark of The Bank of Nova Scotia. Used under license, where applicable.
Scotiabank, together with “Global Banking and Markets”, is a marketing name for the global corporate and investment banking and capital markets businesses of The Bank of Nova Scotia and certain of its affiliates in the countries where they operate, including; Scotiabank Europe plc; Scotiabank (Ireland) Designated Activity Company; Scotiabank Inverlat S.A., Institución de Banca Múltiple, Grupo Financiero Scotiabank Inverlat, Scotia Inverlat Casa de Bolsa, S.A. de C.V., Grupo Financiero Scotiabank Inverlat, Scotia Inverlat Derivados S.A. de C.V. – all members of the Scotiabank group and authorized users of the Scotiabank mark. The Bank of Nova Scotia is incorporated in Canada with limited liability and is authorised and regulated by the Office of the Superintendent of Financial Institutions Canada. The Bank of Nova Scotia is authorized by the UK Prudential Regulation Authority and is subject to regulation by the UK Financial Conduct Authority and limited regulation by the UK Prudential Regulation Authority. Details about the extent of The Bank of Nova Scotia's regulation by the UK Prudential Regulation Authority are available from us on request. Scotiabank Europe plc is authorized by the UK Prudential Regulation Authority and regulated by the UK Financial Conduct Authority and the UK Prudential Regulation Authority.
Scotiabank Inverlat, S.A., Scotia Inverlat Casa de Bolsa, S.A. de C.V, Grupo Financiero Scotiabank Inverlat, and Scotia Inverlat Derivados, S.A. de C.V., are each authorized and regulated by the Mexican financial authorities.
Not all products and services are offered in all jurisdictions. Services described are available in jurisdictions where permitted by law.